Free Statistics

of Irreproducible Research!

Author's title

Author*Unverified author*
R Software Modulerwasp_autocorrelation.wasp
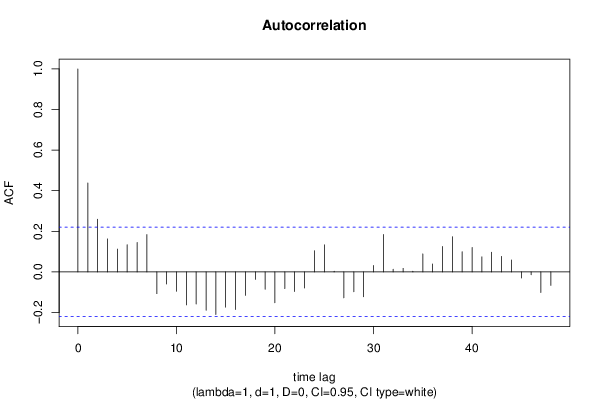
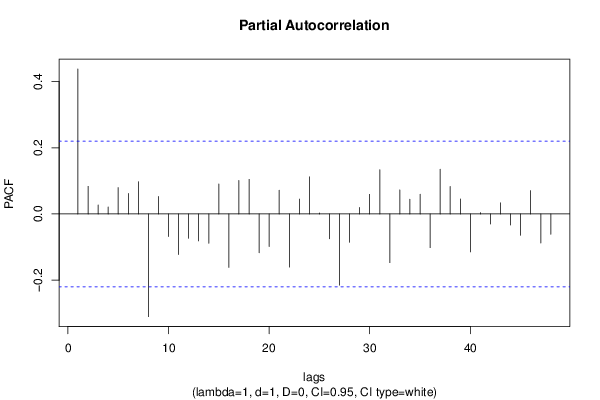
Title produced by software(Partial) Autocorrelation Function
Date of computationFri, 27 May 2016 12:14:51 +0100
Cite this page as followsStatistical Computations at FreeStatistics.org, Office for Research Development and Education, URL https://freestatistics.org/blog/index.php?v=date/2016/May/27/t14643477981tofk4f0m9s9j6c.htm/, Retrieved Thu, 02 May 2024 09:00:08 +0000
Statistical Computations at FreeStatistics.org, Office for Research Development and Education, URL https://freestatistics.org/blog/index.php?pk=295614, Retrieved Thu, 02 May 2024 09:00:08 +0000
QR Codes:

Original text written by user:
IsPrivate?No (this computation is public)
User-defined keywords
Estimated Impact147
Family? (F = Feedback message, R = changed R code, M = changed R Module, P = changed Parameters, D = changed Data)
-     [(Partial) Autocorrelation Function] [] [2016-03-15 21:40:58] [1a32794f6d0828a41bce1c25d1e3e5ae]
- R PD    [(Partial) Autocorrelation Function] [] [2016-05-27 11:14:51] [ac7ea8eb5659db737c8f3ddefda617c5] [Current]
Feedback Forum

Post a new message
Dataseries X:
340.4
343.2
345
346.6
348.7
351.1
352.7
354.8
359.8
364.4
366.2
368.8
369.6
370.6
374.2
378.1
381
383.2
387.3
391.4
395.1
399.1
403
406.3
410.2
413.3
418.4
421.4
422.5
425.5
427.3
430.7
433.2
437.5
439.9
443
445.6
446.2
449.3
453.9
458
461.2
463.7
466
468.3
471.7
474.7
477.3
479.8
482.6
485.6
488.5
492
494.8
498.3
502.1
505.8
511.7
516.6
521.3
526.1
530.4
534.7
538.4
544.6
547.7
551.4
554.3
557.5
560.7
563.8
566.2
567.2
569.3
570.9
573
575.1
578.1
581
584.4


Summary of computational transaction
Raw Inputview raw input (R code)
Raw Outputview raw output of R engine
Computing time1 seconds
R Server'Sir Maurice George Kendall' @ kendall.wessa.net

\begin{tabular}{lllllllll}
\hline
Summary of computational transaction \tabularnewline
Raw Input & view raw input (R code)  \tabularnewline
Raw Output & view raw output of R engine  \tabularnewline
Computing time & 1 seconds \tabularnewline
R Server & 'Sir Maurice George Kendall' @ kendall.wessa.net \tabularnewline
\hline
\end{tabular}
%Source: https://freestatistics.org/blog/index.php?pk=295614&T=0

[TABLE]
[ROW][C]Summary of computational transaction[/C][/ROW]
[ROW][C]Raw Input[/C][C]view raw input (R code) [/C][/ROW]
[ROW][C]Raw Output[/C][C]view raw output of R engine [/C][/ROW]
[ROW][C]Computing time[/C][C]1 seconds[/C][/ROW]
[ROW][C]R Server[/C][C]'Sir Maurice George Kendall' @ kendall.wessa.net[/C][/ROW]
[/TABLE]
Source: https://freestatistics.org/blog/index.php?pk=295614&T=0

Globally Unique Identifier (entire table): ba.freestatistics.org/blog/index.php?pk=295614&T=0

As an alternative you can also use a QR Code:  

The GUIDs for individual cells are displayed in the table below:

Summary of computational transaction
Raw Inputview raw input (R code)
Raw Outputview raw output of R engine
Computing time1 seconds
R Server'Sir Maurice George Kendall' @ kendall.wessa.net


Autocorrelation Function
Time lag kACF(k)T-STATP-value
10.4383763.89640.000102
20.2594892.30640.011855
30.1626071.44530.076167
40.112420.99920.160373
50.1342091.19290.118245
60.1445371.28470.10133
70.1835741.63160.053367
8-0.106993-0.9510.172258
9-0.059318-0.52720.299756
10-0.095428-0.84820.199448
11-0.162505-1.44440.076294
12-0.158584-1.40950.081302
13-0.188671-1.67690.048753
14-0.210088-1.86730.032784
15-0.173718-1.5440.063287
16-0.185056-1.64480.051991
17-0.115864-1.02980.153118
18-0.036878-0.32780.371972
19-0.085923-0.76370.223661
20-0.151683-1.34820.090725
21-0.082306-0.73160.233302
22-0.096869-0.8610.195924
23-0.079598-0.70750.240675
240.1041870.9260.178625
250.1333361.18510.119761
260.00360.0320.487277
27-0.127848-1.13630.129625
28-0.097923-0.87040.193372
29-0.122843-1.09190.139108
300.0312190.27750.391067
310.1843041.63810.052685
320.0133280.11850.453002
330.0173190.15390.439026
340.003660.03250.487064
350.0886720.78810.216487
360.0386080.34320.366197
370.1248521.10970.135245
380.1735051.54210.063517
390.0993720.88320.189894
400.1203241.06950.144058
410.0739980.65770.25632
420.0967790.86020.196143
430.0763830.67890.249591
440.0584020.51910.302575
45-0.029941-0.26610.395418
46-0.013859-0.12320.451139
47-0.101536-0.90250.184775
48-0.06636-0.58980.278497

\begin{tabular}{lllllllll}
\hline
Autocorrelation Function \tabularnewline
Time lag k & ACF(k) & T-STAT & P-value \tabularnewline
1 & 0.438376 & 3.8964 & 0.000102 \tabularnewline
2 & 0.259489 & 2.3064 & 0.011855 \tabularnewline
3 & 0.162607 & 1.4453 & 0.076167 \tabularnewline
4 & 0.11242 & 0.9992 & 0.160373 \tabularnewline
5 & 0.134209 & 1.1929 & 0.118245 \tabularnewline
6 & 0.144537 & 1.2847 & 0.10133 \tabularnewline
7 & 0.183574 & 1.6316 & 0.053367 \tabularnewline
8 & -0.106993 & -0.951 & 0.172258 \tabularnewline
9 & -0.059318 & -0.5272 & 0.299756 \tabularnewline
10 & -0.095428 & -0.8482 & 0.199448 \tabularnewline
11 & -0.162505 & -1.4444 & 0.076294 \tabularnewline
12 & -0.158584 & -1.4095 & 0.081302 \tabularnewline
13 & -0.188671 & -1.6769 & 0.048753 \tabularnewline
14 & -0.210088 & -1.8673 & 0.032784 \tabularnewline
15 & -0.173718 & -1.544 & 0.063287 \tabularnewline
16 & -0.185056 & -1.6448 & 0.051991 \tabularnewline
17 & -0.115864 & -1.0298 & 0.153118 \tabularnewline
18 & -0.036878 & -0.3278 & 0.371972 \tabularnewline
19 & -0.085923 & -0.7637 & 0.223661 \tabularnewline
20 & -0.151683 & -1.3482 & 0.090725 \tabularnewline
21 & -0.082306 & -0.7316 & 0.233302 \tabularnewline
22 & -0.096869 & -0.861 & 0.195924 \tabularnewline
23 & -0.079598 & -0.7075 & 0.240675 \tabularnewline
24 & 0.104187 & 0.926 & 0.178625 \tabularnewline
25 & 0.133336 & 1.1851 & 0.119761 \tabularnewline
26 & 0.0036 & 0.032 & 0.487277 \tabularnewline
27 & -0.127848 & -1.1363 & 0.129625 \tabularnewline
28 & -0.097923 & -0.8704 & 0.193372 \tabularnewline
29 & -0.122843 & -1.0919 & 0.139108 \tabularnewline
30 & 0.031219 & 0.2775 & 0.391067 \tabularnewline
31 & 0.184304 & 1.6381 & 0.052685 \tabularnewline
32 & 0.013328 & 0.1185 & 0.453002 \tabularnewline
33 & 0.017319 & 0.1539 & 0.439026 \tabularnewline
34 & 0.00366 & 0.0325 & 0.487064 \tabularnewline
35 & 0.088672 & 0.7881 & 0.216487 \tabularnewline
36 & 0.038608 & 0.3432 & 0.366197 \tabularnewline
37 & 0.124852 & 1.1097 & 0.135245 \tabularnewline
38 & 0.173505 & 1.5421 & 0.063517 \tabularnewline
39 & 0.099372 & 0.8832 & 0.189894 \tabularnewline
40 & 0.120324 & 1.0695 & 0.144058 \tabularnewline
41 & 0.073998 & 0.6577 & 0.25632 \tabularnewline
42 & 0.096779 & 0.8602 & 0.196143 \tabularnewline
43 & 0.076383 & 0.6789 & 0.249591 \tabularnewline
44 & 0.058402 & 0.5191 & 0.302575 \tabularnewline
45 & -0.029941 & -0.2661 & 0.395418 \tabularnewline
46 & -0.013859 & -0.1232 & 0.451139 \tabularnewline
47 & -0.101536 & -0.9025 & 0.184775 \tabularnewline
48 & -0.06636 & -0.5898 & 0.278497 \tabularnewline
\hline
\end{tabular}
%Source: https://freestatistics.org/blog/index.php?pk=295614&T=1

[TABLE]
[ROW][C]Autocorrelation Function[/C][/ROW]
[ROW][C]Time lag k[/C][C]ACF(k)[/C][C]T-STAT[/C][C]P-value[/C][/ROW]
[ROW][C]1[/C][C]0.438376[/C][C]3.8964[/C][C]0.000102[/C][/ROW]
[ROW][C]2[/C][C]0.259489[/C][C]2.3064[/C][C]0.011855[/C][/ROW]
[ROW][C]3[/C][C]0.162607[/C][C]1.4453[/C][C]0.076167[/C][/ROW]
[ROW][C]4[/C][C]0.11242[/C][C]0.9992[/C][C]0.160373[/C][/ROW]
[ROW][C]5[/C][C]0.134209[/C][C]1.1929[/C][C]0.118245[/C][/ROW]
[ROW][C]6[/C][C]0.144537[/C][C]1.2847[/C][C]0.10133[/C][/ROW]
[ROW][C]7[/C][C]0.183574[/C][C]1.6316[/C][C]0.053367[/C][/ROW]
[ROW][C]8[/C][C]-0.106993[/C][C]-0.951[/C][C]0.172258[/C][/ROW]
[ROW][C]9[/C][C]-0.059318[/C][C]-0.5272[/C][C]0.299756[/C][/ROW]
[ROW][C]10[/C][C]-0.095428[/C][C]-0.8482[/C][C]0.199448[/C][/ROW]
[ROW][C]11[/C][C]-0.162505[/C][C]-1.4444[/C][C]0.076294[/C][/ROW]
[ROW][C]12[/C][C]-0.158584[/C][C]-1.4095[/C][C]0.081302[/C][/ROW]
[ROW][C]13[/C][C]-0.188671[/C][C]-1.6769[/C][C]0.048753[/C][/ROW]
[ROW][C]14[/C][C]-0.210088[/C][C]-1.8673[/C][C]0.032784[/C][/ROW]
[ROW][C]15[/C][C]-0.173718[/C][C]-1.544[/C][C]0.063287[/C][/ROW]
[ROW][C]16[/C][C]-0.185056[/C][C]-1.6448[/C][C]0.051991[/C][/ROW]
[ROW][C]17[/C][C]-0.115864[/C][C]-1.0298[/C][C]0.153118[/C][/ROW]
[ROW][C]18[/C][C]-0.036878[/C][C]-0.3278[/C][C]0.371972[/C][/ROW]
[ROW][C]19[/C][C]-0.085923[/C][C]-0.7637[/C][C]0.223661[/C][/ROW]
[ROW][C]20[/C][C]-0.151683[/C][C]-1.3482[/C][C]0.090725[/C][/ROW]
[ROW][C]21[/C][C]-0.082306[/C][C]-0.7316[/C][C]0.233302[/C][/ROW]
[ROW][C]22[/C][C]-0.096869[/C][C]-0.861[/C][C]0.195924[/C][/ROW]
[ROW][C]23[/C][C]-0.079598[/C][C]-0.7075[/C][C]0.240675[/C][/ROW]
[ROW][C]24[/C][C]0.104187[/C][C]0.926[/C][C]0.178625[/C][/ROW]
[ROW][C]25[/C][C]0.133336[/C][C]1.1851[/C][C]0.119761[/C][/ROW]
[ROW][C]26[/C][C]0.0036[/C][C]0.032[/C][C]0.487277[/C][/ROW]
[ROW][C]27[/C][C]-0.127848[/C][C]-1.1363[/C][C]0.129625[/C][/ROW]
[ROW][C]28[/C][C]-0.097923[/C][C]-0.8704[/C][C]0.193372[/C][/ROW]
[ROW][C]29[/C][C]-0.122843[/C][C]-1.0919[/C][C]0.139108[/C][/ROW]
[ROW][C]30[/C][C]0.031219[/C][C]0.2775[/C][C]0.391067[/C][/ROW]
[ROW][C]31[/C][C]0.184304[/C][C]1.6381[/C][C]0.052685[/C][/ROW]
[ROW][C]32[/C][C]0.013328[/C][C]0.1185[/C][C]0.453002[/C][/ROW]
[ROW][C]33[/C][C]0.017319[/C][C]0.1539[/C][C]0.439026[/C][/ROW]
[ROW][C]34[/C][C]0.00366[/C][C]0.0325[/C][C]0.487064[/C][/ROW]
[ROW][C]35[/C][C]0.088672[/C][C]0.7881[/C][C]0.216487[/C][/ROW]
[ROW][C]36[/C][C]0.038608[/C][C]0.3432[/C][C]0.366197[/C][/ROW]
[ROW][C]37[/C][C]0.124852[/C][C]1.1097[/C][C]0.135245[/C][/ROW]
[ROW][C]38[/C][C]0.173505[/C][C]1.5421[/C][C]0.063517[/C][/ROW]
[ROW][C]39[/C][C]0.099372[/C][C]0.8832[/C][C]0.189894[/C][/ROW]
[ROW][C]40[/C][C]0.120324[/C][C]1.0695[/C][C]0.144058[/C][/ROW]
[ROW][C]41[/C][C]0.073998[/C][C]0.6577[/C][C]0.25632[/C][/ROW]
[ROW][C]42[/C][C]0.096779[/C][C]0.8602[/C][C]0.196143[/C][/ROW]
[ROW][C]43[/C][C]0.076383[/C][C]0.6789[/C][C]0.249591[/C][/ROW]
[ROW][C]44[/C][C]0.058402[/C][C]0.5191[/C][C]0.302575[/C][/ROW]
[ROW][C]45[/C][C]-0.029941[/C][C]-0.2661[/C][C]0.395418[/C][/ROW]
[ROW][C]46[/C][C]-0.013859[/C][C]-0.1232[/C][C]0.451139[/C][/ROW]
[ROW][C]47[/C][C]-0.101536[/C][C]-0.9025[/C][C]0.184775[/C][/ROW]
[ROW][C]48[/C][C]-0.06636[/C][C]-0.5898[/C][C]0.278497[/C][/ROW]
[/TABLE]
Source: https://freestatistics.org/blog/index.php?pk=295614&T=1

Globally Unique Identifier (entire table): ba.freestatistics.org/blog/index.php?pk=295614&T=1

As an alternative you can also use a QR Code:  

The GUIDs for individual cells are displayed in the table below:

Autocorrelation Function
Time lag kACF(k)T-STATP-value
10.4383763.89640.000102
20.2594892.30640.011855
30.1626071.44530.076167
40.112420.99920.160373
50.1342091.19290.118245
60.1445371.28470.10133
70.1835741.63160.053367
8-0.106993-0.9510.172258
9-0.059318-0.52720.299756
10-0.095428-0.84820.199448
11-0.162505-1.44440.076294
12-0.158584-1.40950.081302
13-0.188671-1.67690.048753
14-0.210088-1.86730.032784
15-0.173718-1.5440.063287
16-0.185056-1.64480.051991
17-0.115864-1.02980.153118
18-0.036878-0.32780.371972
19-0.085923-0.76370.223661
20-0.151683-1.34820.090725
21-0.082306-0.73160.233302
22-0.096869-0.8610.195924
23-0.079598-0.70750.240675
240.1041870.9260.178625
250.1333361.18510.119761
260.00360.0320.487277
27-0.127848-1.13630.129625
28-0.097923-0.87040.193372
29-0.122843-1.09190.139108
300.0312190.27750.391067
310.1843041.63810.052685
320.0133280.11850.453002
330.0173190.15390.439026
340.003660.03250.487064
350.0886720.78810.216487
360.0386080.34320.366197
370.1248521.10970.135245
380.1735051.54210.063517
390.0993720.88320.189894
400.1203241.06950.144058
410.0739980.65770.25632
420.0967790.86020.196143
430.0763830.67890.249591
440.0584020.51910.302575
45-0.029941-0.26610.395418
46-0.013859-0.12320.451139
47-0.101536-0.90250.184775
48-0.06636-0.58980.278497


Partial Autocorrelation Function
Time lag kPACF(k)T-STATP-value
10.4383763.89640.000102
20.083330.74060.230551
30.0271770.24160.404874
40.0208850.18560.426606
50.07960.70750.24067
60.0617820.54910.292233
70.0972760.86460.194937
8-0.310462-2.75940.003597
90.0527660.4690.320184
10-0.068007-0.60450.273635
11-0.122515-1.08890.139745
12-0.073431-0.65270.257933
13-0.081446-0.72390.235629
14-0.088365-0.78540.217282
150.0903430.8030.212197
16-0.161576-1.43610.077458
170.1012450.89990.185459
180.1045680.92940.177752
19-0.11752-1.04450.149711
20-0.098369-0.87430.192296
210.0719310.63930.262227
22-0.160655-1.42790.078627
230.0449590.39960.345263
240.1122290.99750.160781
250.0031050.02760.489025
26-0.07511-0.66760.253169
27-0.215262-1.91330.029667
28-0.085815-0.76270.223944
290.0197420.17550.430581
300.059170.52590.30021
310.1339061.19020.118769
32-0.147102-1.30750.097422
330.0727330.64650.259926
340.0445590.39610.346567
350.0595920.52970.298913
36-0.101873-0.90550.183985
370.135441.20380.116128
380.0831370.73890.231067
390.0451610.40140.344606
40-0.114647-1.0190.155655
410.0039850.03540.485917
42-0.030528-0.27130.39342
430.0334810.29760.383402
44-0.033417-0.2970.383616
45-0.064232-0.57090.284843
460.0705180.62680.266307
47-0.087744-0.77990.218894
48-0.061379-0.54560.293456

\begin{tabular}{lllllllll}
\hline
Partial Autocorrelation Function \tabularnewline
Time lag k & PACF(k) & T-STAT & P-value \tabularnewline
1 & 0.438376 & 3.8964 & 0.000102 \tabularnewline
2 & 0.08333 & 0.7406 & 0.230551 \tabularnewline
3 & 0.027177 & 0.2416 & 0.404874 \tabularnewline
4 & 0.020885 & 0.1856 & 0.426606 \tabularnewline
5 & 0.0796 & 0.7075 & 0.24067 \tabularnewline
6 & 0.061782 & 0.5491 & 0.292233 \tabularnewline
7 & 0.097276 & 0.8646 & 0.194937 \tabularnewline
8 & -0.310462 & -2.7594 & 0.003597 \tabularnewline
9 & 0.052766 & 0.469 & 0.320184 \tabularnewline
10 & -0.068007 & -0.6045 & 0.273635 \tabularnewline
11 & -0.122515 & -1.0889 & 0.139745 \tabularnewline
12 & -0.073431 & -0.6527 & 0.257933 \tabularnewline
13 & -0.081446 & -0.7239 & 0.235629 \tabularnewline
14 & -0.088365 & -0.7854 & 0.217282 \tabularnewline
15 & 0.090343 & 0.803 & 0.212197 \tabularnewline
16 & -0.161576 & -1.4361 & 0.077458 \tabularnewline
17 & 0.101245 & 0.8999 & 0.185459 \tabularnewline
18 & 0.104568 & 0.9294 & 0.177752 \tabularnewline
19 & -0.11752 & -1.0445 & 0.149711 \tabularnewline
20 & -0.098369 & -0.8743 & 0.192296 \tabularnewline
21 & 0.071931 & 0.6393 & 0.262227 \tabularnewline
22 & -0.160655 & -1.4279 & 0.078627 \tabularnewline
23 & 0.044959 & 0.3996 & 0.345263 \tabularnewline
24 & 0.112229 & 0.9975 & 0.160781 \tabularnewline
25 & 0.003105 & 0.0276 & 0.489025 \tabularnewline
26 & -0.07511 & -0.6676 & 0.253169 \tabularnewline
27 & -0.215262 & -1.9133 & 0.029667 \tabularnewline
28 & -0.085815 & -0.7627 & 0.223944 \tabularnewline
29 & 0.019742 & 0.1755 & 0.430581 \tabularnewline
30 & 0.05917 & 0.5259 & 0.30021 \tabularnewline
31 & 0.133906 & 1.1902 & 0.118769 \tabularnewline
32 & -0.147102 & -1.3075 & 0.097422 \tabularnewline
33 & 0.072733 & 0.6465 & 0.259926 \tabularnewline
34 & 0.044559 & 0.3961 & 0.346567 \tabularnewline
35 & 0.059592 & 0.5297 & 0.298913 \tabularnewline
36 & -0.101873 & -0.9055 & 0.183985 \tabularnewline
37 & 0.13544 & 1.2038 & 0.116128 \tabularnewline
38 & 0.083137 & 0.7389 & 0.231067 \tabularnewline
39 & 0.045161 & 0.4014 & 0.344606 \tabularnewline
40 & -0.114647 & -1.019 & 0.155655 \tabularnewline
41 & 0.003985 & 0.0354 & 0.485917 \tabularnewline
42 & -0.030528 & -0.2713 & 0.39342 \tabularnewline
43 & 0.033481 & 0.2976 & 0.383402 \tabularnewline
44 & -0.033417 & -0.297 & 0.383616 \tabularnewline
45 & -0.064232 & -0.5709 & 0.284843 \tabularnewline
46 & 0.070518 & 0.6268 & 0.266307 \tabularnewline
47 & -0.087744 & -0.7799 & 0.218894 \tabularnewline
48 & -0.061379 & -0.5456 & 0.293456 \tabularnewline
\hline
\end{tabular}
%Source: https://freestatistics.org/blog/index.php?pk=295614&T=2

[TABLE]
[ROW][C]Partial Autocorrelation Function[/C][/ROW]
[ROW][C]Time lag k[/C][C]PACF(k)[/C][C]T-STAT[/C][C]P-value[/C][/ROW]
[ROW][C]1[/C][C]0.438376[/C][C]3.8964[/C][C]0.000102[/C][/ROW]
[ROW][C]2[/C][C]0.08333[/C][C]0.7406[/C][C]0.230551[/C][/ROW]
[ROW][C]3[/C][C]0.027177[/C][C]0.2416[/C][C]0.404874[/C][/ROW]
[ROW][C]4[/C][C]0.020885[/C][C]0.1856[/C][C]0.426606[/C][/ROW]
[ROW][C]5[/C][C]0.0796[/C][C]0.7075[/C][C]0.24067[/C][/ROW]
[ROW][C]6[/C][C]0.061782[/C][C]0.5491[/C][C]0.292233[/C][/ROW]
[ROW][C]7[/C][C]0.097276[/C][C]0.8646[/C][C]0.194937[/C][/ROW]
[ROW][C]8[/C][C]-0.310462[/C][C]-2.7594[/C][C]0.003597[/C][/ROW]
[ROW][C]9[/C][C]0.052766[/C][C]0.469[/C][C]0.320184[/C][/ROW]
[ROW][C]10[/C][C]-0.068007[/C][C]-0.6045[/C][C]0.273635[/C][/ROW]
[ROW][C]11[/C][C]-0.122515[/C][C]-1.0889[/C][C]0.139745[/C][/ROW]
[ROW][C]12[/C][C]-0.073431[/C][C]-0.6527[/C][C]0.257933[/C][/ROW]
[ROW][C]13[/C][C]-0.081446[/C][C]-0.7239[/C][C]0.235629[/C][/ROW]
[ROW][C]14[/C][C]-0.088365[/C][C]-0.7854[/C][C]0.217282[/C][/ROW]
[ROW][C]15[/C][C]0.090343[/C][C]0.803[/C][C]0.212197[/C][/ROW]
[ROW][C]16[/C][C]-0.161576[/C][C]-1.4361[/C][C]0.077458[/C][/ROW]
[ROW][C]17[/C][C]0.101245[/C][C]0.8999[/C][C]0.185459[/C][/ROW]
[ROW][C]18[/C][C]0.104568[/C][C]0.9294[/C][C]0.177752[/C][/ROW]
[ROW][C]19[/C][C]-0.11752[/C][C]-1.0445[/C][C]0.149711[/C][/ROW]
[ROW][C]20[/C][C]-0.098369[/C][C]-0.8743[/C][C]0.192296[/C][/ROW]
[ROW][C]21[/C][C]0.071931[/C][C]0.6393[/C][C]0.262227[/C][/ROW]
[ROW][C]22[/C][C]-0.160655[/C][C]-1.4279[/C][C]0.078627[/C][/ROW]
[ROW][C]23[/C][C]0.044959[/C][C]0.3996[/C][C]0.345263[/C][/ROW]
[ROW][C]24[/C][C]0.112229[/C][C]0.9975[/C][C]0.160781[/C][/ROW]
[ROW][C]25[/C][C]0.003105[/C][C]0.0276[/C][C]0.489025[/C][/ROW]
[ROW][C]26[/C][C]-0.07511[/C][C]-0.6676[/C][C]0.253169[/C][/ROW]
[ROW][C]27[/C][C]-0.215262[/C][C]-1.9133[/C][C]0.029667[/C][/ROW]
[ROW][C]28[/C][C]-0.085815[/C][C]-0.7627[/C][C]0.223944[/C][/ROW]
[ROW][C]29[/C][C]0.019742[/C][C]0.1755[/C][C]0.430581[/C][/ROW]
[ROW][C]30[/C][C]0.05917[/C][C]0.5259[/C][C]0.30021[/C][/ROW]
[ROW][C]31[/C][C]0.133906[/C][C]1.1902[/C][C]0.118769[/C][/ROW]
[ROW][C]32[/C][C]-0.147102[/C][C]-1.3075[/C][C]0.097422[/C][/ROW]
[ROW][C]33[/C][C]0.072733[/C][C]0.6465[/C][C]0.259926[/C][/ROW]
[ROW][C]34[/C][C]0.044559[/C][C]0.3961[/C][C]0.346567[/C][/ROW]
[ROW][C]35[/C][C]0.059592[/C][C]0.5297[/C][C]0.298913[/C][/ROW]
[ROW][C]36[/C][C]-0.101873[/C][C]-0.9055[/C][C]0.183985[/C][/ROW]
[ROW][C]37[/C][C]0.13544[/C][C]1.2038[/C][C]0.116128[/C][/ROW]
[ROW][C]38[/C][C]0.083137[/C][C]0.7389[/C][C]0.231067[/C][/ROW]
[ROW][C]39[/C][C]0.045161[/C][C]0.4014[/C][C]0.344606[/C][/ROW]
[ROW][C]40[/C][C]-0.114647[/C][C]-1.019[/C][C]0.155655[/C][/ROW]
[ROW][C]41[/C][C]0.003985[/C][C]0.0354[/C][C]0.485917[/C][/ROW]
[ROW][C]42[/C][C]-0.030528[/C][C]-0.2713[/C][C]0.39342[/C][/ROW]
[ROW][C]43[/C][C]0.033481[/C][C]0.2976[/C][C]0.383402[/C][/ROW]
[ROW][C]44[/C][C]-0.033417[/C][C]-0.297[/C][C]0.383616[/C][/ROW]
[ROW][C]45[/C][C]-0.064232[/C][C]-0.5709[/C][C]0.284843[/C][/ROW]
[ROW][C]46[/C][C]0.070518[/C][C]0.6268[/C][C]0.266307[/C][/ROW]
[ROW][C]47[/C][C]-0.087744[/C][C]-0.7799[/C][C]0.218894[/C][/ROW]
[ROW][C]48[/C][C]-0.061379[/C][C]-0.5456[/C][C]0.293456[/C][/ROW]
[/TABLE]
Source: https://freestatistics.org/blog/index.php?pk=295614&T=2

Globally Unique Identifier (entire table): ba.freestatistics.org/blog/index.php?pk=295614&T=2

As an alternative you can also use a QR Code:  

The GUIDs for individual cells are displayed in the table below:

Partial Autocorrelation Function
Time lag kPACF(k)T-STATP-value
10.4383763.89640.000102
20.083330.74060.230551
30.0271770.24160.404874
40.0208850.18560.426606
50.07960.70750.24067
60.0617820.54910.292233
70.0972760.86460.194937
8-0.310462-2.75940.003597
90.0527660.4690.320184
10-0.068007-0.60450.273635
11-0.122515-1.08890.139745
12-0.073431-0.65270.257933
13-0.081446-0.72390.235629
14-0.088365-0.78540.217282
150.0903430.8030.212197
16-0.161576-1.43610.077458
170.1012450.89990.185459
180.1045680.92940.177752
19-0.11752-1.04450.149711
20-0.098369-0.87430.192296
210.0719310.63930.262227
22-0.160655-1.42790.078627
230.0449590.39960.345263
240.1122290.99750.160781
250.0031050.02760.489025
26-0.07511-0.66760.253169
27-0.215262-1.91330.029667
28-0.085815-0.76270.223944
290.0197420.17550.430581
300.059170.52590.30021
310.1339061.19020.118769
32-0.147102-1.30750.097422
330.0727330.64650.259926
340.0445590.39610.346567
350.0595920.52970.298913
36-0.101873-0.90550.183985
370.135441.20380.116128
380.0831370.73890.231067
390.0451610.40140.344606
40-0.114647-1.0190.155655
410.0039850.03540.485917
42-0.030528-0.27130.39342
430.0334810.29760.383402
44-0.033417-0.2970.383616
45-0.064232-0.57090.284843
460.0705180.62680.266307
47-0.087744-0.77990.218894
48-0.061379-0.54560.293456


Parameters (Session):
par1 = 48 ; par2 = 1 ; par3 = 1 ; par4 = 0 ; par5 = 12 ; par6 = White Noise ; par7 = 0.95 ;
Parameters (R input):
par1 = 48 ; par2 = 1 ; par3 = 1 ; par4 = 0 ; par5 = 12 ; par6 = White Noise ; par7 = 0.95 ; par8 = ;
R code (references can be found in the software module):
if (par1 == 'Default') {
par1 = 10*log10(length(x))
} else {
par1 <- as.numeric(par1)
}
par2 <- as.numeric(par2)
par3 <- as.numeric(par3)
par4 <- as.numeric(par4)
par5 <- as.numeric(par5)
if (par6 == 'White Noise') par6 <- 'white' else par6 <- 'ma'
par7 <- as.numeric(par7)
if (par8 != '') par8 <- as.numeric(par8)
x <- na.omit(x)
ox <- x
if (par8 == '') {
if (par2 == 0) {
x <- log(x)
} else {
x <- (x ^ par2 - 1) / par2
}
} else {
x <- log(x,base=par8)
}
if (par3 > 0) x <- diff(x,lag=1,difference=par3)
if (par4 > 0) x <- diff(x,lag=par5,difference=par4)
bitmap(file='picts.png')
op <- par(mfrow=c(2,1))
plot(ox,type='l',main='Original Time Series',xlab='time',ylab='value')
if (par8=='') {
mytitle <- paste('Working Time Series (lambda=',par2,', d=',par3,', D=',par4,')',sep='')
mysub <- paste('(lambda=',par2,', d=',par3,', D=',par4,', CI=', par7, ', CI type=',par6,')',sep='')
} else {
mytitle <- paste('Working Time Series (base=',par8,', d=',par3,', D=',par4,')',sep='')
mysub <- paste('(base=',par8,', d=',par3,', D=',par4,', CI=', par7, ', CI type=',par6,')',sep='')
}
plot(x,type='l', main=mytitle,xlab='time',ylab='value')
par(op)
dev.off()
bitmap(file='pic1.png')
racf <- acf(x, par1, main='Autocorrelation', xlab='time lag', ylab='ACF', ci.type=par6, ci=par7, sub=mysub)
dev.off()
bitmap(file='pic2.png')
rpacf <- pacf(x,par1,main='Partial Autocorrelation',xlab='lags',ylab='PACF',sub=mysub)
dev.off()
(myacf <- c(racf$acf))
(mypacf <- c(rpacf$acf))
lengthx <- length(x)
sqrtn <- sqrt(lengthx)
load(file='createtable')
a<-table.start()
a<-table.row.start(a)
a<-table.element(a,'Autocorrelation Function',4,TRUE)
a<-table.row.end(a)
a<-table.row.start(a)
a<-table.element(a,'Time lag k',header=TRUE)
a<-table.element(a,hyperlink('basics.htm','ACF(k)','click here for more information about the Autocorrelation Function'),header=TRUE)
a<-table.element(a,'T-STAT',header=TRUE)
a<-table.element(a,'P-value',header=TRUE)
a<-table.row.end(a)
for (i in 2:(par1+1)) {
a<-table.row.start(a)
a<-table.element(a,i-1,header=TRUE)
a<-table.element(a,round(myacf[i],6))
mytstat <- myacf[i]*sqrtn
a<-table.element(a,round(mytstat,4))
a<-table.element(a,round(1-pt(abs(mytstat),lengthx),6))
a<-table.row.end(a)
}
a<-table.end(a)
table.save(a,file='mytable.tab')
a<-table.start()
a<-table.row.start(a)
a<-table.element(a,'Partial Autocorrelation Function',4,TRUE)
a<-table.row.end(a)
a<-table.row.start(a)
a<-table.element(a,'Time lag k',header=TRUE)
a<-table.element(a,hyperlink('basics.htm','PACF(k)','click here for more information about the Partial Autocorrelation Function'),header=TRUE)
a<-table.element(a,'T-STAT',header=TRUE)
a<-table.element(a,'P-value',header=TRUE)
a<-table.row.end(a)
for (i in 1:par1) {
a<-table.row.start(a)
a<-table.element(a,i,header=TRUE)
a<-table.element(a,round(mypacf[i],6))
mytstat <- mypacf[i]*sqrtn
a<-table.element(a,round(mytstat,4))
a<-table.element(a,round(1-pt(abs(mytstat),lengthx),6))
a<-table.row.end(a)
}
a<-table.end(a)
table.save(a,file='mytable1.tab')