Free Statistics

of Irreproducible Research!

Author's title

Author*Unverified author*
R Software Modulerwasp_exponentialsmoothing.wasp
Title produced by softwareExponential Smoothing
Date of computationSun, 29 May 2016 13:29:06 +0100
Cite this page as followsStatistical Computations at FreeStatistics.org, Office for Research Development and Education, URL https://freestatistics.org/blog/index.php?v=date/2016/May/29/t14645249845ccn5ua2ci5xpjr.htm/, Retrieved Sun, 28 Apr 2024 06:43:43 +0000
Statistical Computations at FreeStatistics.org, Office for Research Development and Education, URL https://freestatistics.org/blog/index.php?pk=295661, Retrieved Sun, 28 Apr 2024 06:43:43 +0000
QR Codes:

Original text written by user:
IsPrivate?No (this computation is public)
User-defined keywords
Estimated Impact87
Family? (F = Feedback message, R = changed R code, M = changed R Module, P = changed Parameters, D = changed Data)
-     [Exponential Smoothing] [] [2016-04-26 11:01:15] [eb84577074ca016fc26a8bcabc390030]
- R P     [Exponential Smoothing] [] [2016-05-29 12:29:06] [73c24565f080d314e595da727a2003f4] [Current]
Feedback Forum

Post a new message
Dataseries X:
89,72
89.95
90.19
90.23
90.32
90.86
90.99
90.98
91.22
91.42
91.55
91.67
92.30
92.92
93.10
93.23
93.36
93.42
93.58
93.68
94.02
94.29
94.54
94.64
96.70
96.83
97.07
97.11
97.42
97.44
97.67
97.84
98.17
98.31
98.42
98.44
98.89
99.26
99.59
99.82
99.95
99.99
100.28
100.38
100.46
100.52
100.43
100.44
101.33
101.43
101.41
101.53
101.58
101.73
102.12
101.86
101.93
101.86
101.92
102.02


Summary of computational transaction
Raw Inputview raw input (R code)
Raw Outputview raw output of R engine
Computing time2 seconds
R Server'Sir Ronald Aylmer Fisher' @ fisher.wessa.net

\begin{tabular}{lllllllll}
\hline
Summary of computational transaction \tabularnewline
Raw Input & view raw input (R code)  \tabularnewline
Raw Output & view raw output of R engine  \tabularnewline
Computing time & 2 seconds \tabularnewline
R Server & 'Sir Ronald Aylmer Fisher' @ fisher.wessa.net \tabularnewline
\hline
\end{tabular}
%Source: https://freestatistics.org/blog/index.php?pk=295661&T=0

[TABLE]
[ROW][C]Summary of computational transaction[/C][/ROW]
[ROW][C]Raw Input[/C][C]view raw input (R code) [/C][/ROW]
[ROW][C]Raw Output[/C][C]view raw output of R engine [/C][/ROW]
[ROW][C]Computing time[/C][C]2 seconds[/C][/ROW]
[ROW][C]R Server[/C][C]'Sir Ronald Aylmer Fisher' @ fisher.wessa.net[/C][/ROW]
[/TABLE]
Source: https://freestatistics.org/blog/index.php?pk=295661&T=0

Globally Unique Identifier (entire table): ba.freestatistics.org/blog/index.php?pk=295661&T=0

As an alternative you can also use a QR Code:  

The GUIDs for individual cells are displayed in the table below:

Summary of computational transaction
Raw Inputview raw input (R code)
Raw Outputview raw output of R engine
Computing time2 seconds
R Server'Sir Ronald Aylmer Fisher' @ fisher.wessa.net


Estimated Parameters of Exponential Smoothing
ParameterValue
alpha0.999948123556096
betaFALSE
gammaFALSE

\begin{tabular}{lllllllll}
\hline
Estimated Parameters of Exponential Smoothing \tabularnewline
Parameter & Value \tabularnewline
alpha & 0.999948123556096 \tabularnewline
beta & FALSE \tabularnewline
gamma & FALSE \tabularnewline
\hline
\end{tabular}
%Source: https://freestatistics.org/blog/index.php?pk=295661&T=1

[TABLE]
[ROW][C]Estimated Parameters of Exponential Smoothing[/C][/ROW]
[ROW][C]Parameter[/C][C]Value[/C][/ROW]
[ROW][C]alpha[/C][C]0.999948123556096[/C][/ROW]
[ROW][C]beta[/C][C]FALSE[/C][/ROW]
[ROW][C]gamma[/C][C]FALSE[/C][/ROW]
[/TABLE]
Source: https://freestatistics.org/blog/index.php?pk=295661&T=1

Globally Unique Identifier (entire table): ba.freestatistics.org/blog/index.php?pk=295661&T=1

As an alternative you can also use a QR Code:  

The GUIDs for individual cells are displayed in the table below:

Estimated Parameters of Exponential Smoothing
ParameterValue
alpha0.999948123556096
betaFALSE
gammaFALSE


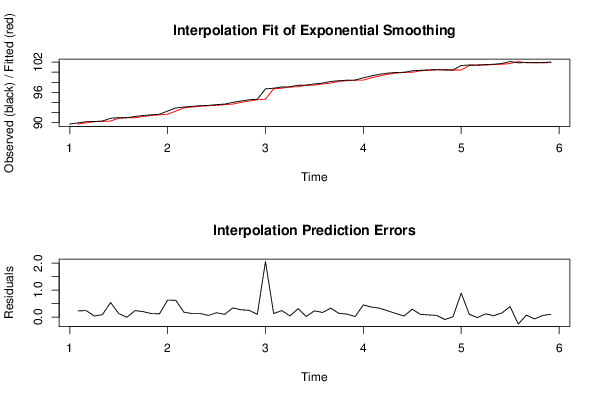
Interpolation Forecasts of Exponential Smoothing
tObservedFittedResiduals
289.9589.720.230000000000004
390.1989.94998806841790.240011931582103
490.2390.18998754903450.0400124509655058
590.3290.22999792429630.0900020757036657
690.8690.31999533101240.540004668987635
790.9990.85997198647810.130028013521923
890.9890.989993254609-0.00999325460904288
991.2290.98000051841450.239999481585485
1091.4291.21998754968040.200012450319647
1191.5591.41998962406540.130010375934646
1291.6791.5499932555240.120006744475987
1392.391.66999377447690.630006225523147
1492.9292.29996731751740.620032682482616
1593.192.91996783490930.180032165090665
1693.2393.09999066057150.130009339428526
1793.3693.22999325557780.13000674442219
1893.4293.35999325571240.0600067442875911
1993.5893.41999688706350.160003112936494
2093.6893.57999169960750.100008300392531
2194.0293.6799948119250.340005188074983
2294.2994.01998236173990.270017638260072
2394.5494.28998599244510.250014007554867
2494.6494.53998703016240.100012969837636
2596.794.63999481168282.06000518831722
2696.8396.69989313425640.130106865743599
2797.0796.82999325051850.240006749481523
2897.1197.06998754930330.040012450696679
2997.4297.10999792429630.310002075703665
3097.4497.41998391819470.020016081805295
3197.6797.43999896163690.230001038363142
3297.8497.6699880683640.170011931635955
3398.1797.83999118038560.330008819614434
3498.3198.1699828803160.140017119684018
3598.4298.30999273640970.110007263590262
3698.4498.41999429321440.0200057067856392
3798.8998.43999896217510.450001037824933
3899.2698.88997665554640.3700233444536
3999.5999.25998080450470.330019195495268
4099.8299.58998287977770.230017120222271
4199.9599.81998806752970.130011932470254
4299.9999.94999325544330.0400067445567203
43100.2899.98999792459240.290002075407642
44100.38100.2799849557240.10001504427639
45100.46100.3799948115750.0800051884248347
46100.52100.4599958496150.0600041503846711
47100.43100.519996887198-0.0899968871980406
48100.44100.4300046687180.00999533128153018
49101.33100.4399994814780.890000518522243
50101.43101.3299538299380.100046170061987
51101.41101.42999480996-0.0199948099604796
52101.53101.410001037260.119998962740368
53101.58101.5299937748810.0500062251194606
54101.73101.5799974058550.150002594145136
55102.12101.7299922183990.39000778160117
56101.86102.119979767783-0.259979767783207
57101.93101.8600134868260.0699865131741717
58101.86101.929996369349-0.0699963693485728
59101.92101.8600036311630.0599963688372753
60102.02101.9199968876020.100003112398255

\begin{tabular}{lllllllll}
\hline
Interpolation Forecasts of Exponential Smoothing \tabularnewline
t & Observed & Fitted & Residuals \tabularnewline
2 & 89.95 & 89.72 & 0.230000000000004 \tabularnewline
3 & 90.19 & 89.9499880684179 & 0.240011931582103 \tabularnewline
4 & 90.23 & 90.1899875490345 & 0.0400124509655058 \tabularnewline
5 & 90.32 & 90.2299979242963 & 0.0900020757036657 \tabularnewline
6 & 90.86 & 90.3199953310124 & 0.540004668987635 \tabularnewline
7 & 90.99 & 90.8599719864781 & 0.130028013521923 \tabularnewline
8 & 90.98 & 90.989993254609 & -0.00999325460904288 \tabularnewline
9 & 91.22 & 90.9800005184145 & 0.239999481585485 \tabularnewline
10 & 91.42 & 91.2199875496804 & 0.200012450319647 \tabularnewline
11 & 91.55 & 91.4199896240654 & 0.130010375934646 \tabularnewline
12 & 91.67 & 91.549993255524 & 0.120006744475987 \tabularnewline
13 & 92.3 & 91.6699937744769 & 0.630006225523147 \tabularnewline
14 & 92.92 & 92.2999673175174 & 0.620032682482616 \tabularnewline
15 & 93.1 & 92.9199678349093 & 0.180032165090665 \tabularnewline
16 & 93.23 & 93.0999906605715 & 0.130009339428526 \tabularnewline
17 & 93.36 & 93.2299932555778 & 0.13000674442219 \tabularnewline
18 & 93.42 & 93.3599932557124 & 0.0600067442875911 \tabularnewline
19 & 93.58 & 93.4199968870635 & 0.160003112936494 \tabularnewline
20 & 93.68 & 93.5799916996075 & 0.100008300392531 \tabularnewline
21 & 94.02 & 93.679994811925 & 0.340005188074983 \tabularnewline
22 & 94.29 & 94.0199823617399 & 0.270017638260072 \tabularnewline
23 & 94.54 & 94.2899859924451 & 0.250014007554867 \tabularnewline
24 & 94.64 & 94.5399870301624 & 0.100012969837636 \tabularnewline
25 & 96.7 & 94.6399948116828 & 2.06000518831722 \tabularnewline
26 & 96.83 & 96.6998931342564 & 0.130106865743599 \tabularnewline
27 & 97.07 & 96.8299932505185 & 0.240006749481523 \tabularnewline
28 & 97.11 & 97.0699875493033 & 0.040012450696679 \tabularnewline
29 & 97.42 & 97.1099979242963 & 0.310002075703665 \tabularnewline
30 & 97.44 & 97.4199839181947 & 0.020016081805295 \tabularnewline
31 & 97.67 & 97.4399989616369 & 0.230001038363142 \tabularnewline
32 & 97.84 & 97.669988068364 & 0.170011931635955 \tabularnewline
33 & 98.17 & 97.8399911803856 & 0.330008819614434 \tabularnewline
34 & 98.31 & 98.169982880316 & 0.140017119684018 \tabularnewline
35 & 98.42 & 98.3099927364097 & 0.110007263590262 \tabularnewline
36 & 98.44 & 98.4199942932144 & 0.0200057067856392 \tabularnewline
37 & 98.89 & 98.4399989621751 & 0.450001037824933 \tabularnewline
38 & 99.26 & 98.8899766555464 & 0.3700233444536 \tabularnewline
39 & 99.59 & 99.2599808045047 & 0.330019195495268 \tabularnewline
40 & 99.82 & 99.5899828797777 & 0.230017120222271 \tabularnewline
41 & 99.95 & 99.8199880675297 & 0.130011932470254 \tabularnewline
42 & 99.99 & 99.9499932554433 & 0.0400067445567203 \tabularnewline
43 & 100.28 & 99.9899979245924 & 0.290002075407642 \tabularnewline
44 & 100.38 & 100.279984955724 & 0.10001504427639 \tabularnewline
45 & 100.46 & 100.379994811575 & 0.0800051884248347 \tabularnewline
46 & 100.52 & 100.459995849615 & 0.0600041503846711 \tabularnewline
47 & 100.43 & 100.519996887198 & -0.0899968871980406 \tabularnewline
48 & 100.44 & 100.430004668718 & 0.00999533128153018 \tabularnewline
49 & 101.33 & 100.439999481478 & 0.890000518522243 \tabularnewline
50 & 101.43 & 101.329953829938 & 0.100046170061987 \tabularnewline
51 & 101.41 & 101.42999480996 & -0.0199948099604796 \tabularnewline
52 & 101.53 & 101.41000103726 & 0.119998962740368 \tabularnewline
53 & 101.58 & 101.529993774881 & 0.0500062251194606 \tabularnewline
54 & 101.73 & 101.579997405855 & 0.150002594145136 \tabularnewline
55 & 102.12 & 101.729992218399 & 0.39000778160117 \tabularnewline
56 & 101.86 & 102.119979767783 & -0.259979767783207 \tabularnewline
57 & 101.93 & 101.860013486826 & 0.0699865131741717 \tabularnewline
58 & 101.86 & 101.929996369349 & -0.0699963693485728 \tabularnewline
59 & 101.92 & 101.860003631163 & 0.0599963688372753 \tabularnewline
60 & 102.02 & 101.919996887602 & 0.100003112398255 \tabularnewline
\hline
\end{tabular}
%Source: https://freestatistics.org/blog/index.php?pk=295661&T=2

[TABLE]
[ROW][C]Interpolation Forecasts of Exponential Smoothing[/C][/ROW]
[ROW][C]t[/C][C]Observed[/C][C]Fitted[/C][C]Residuals[/C][/ROW]
[ROW][C]2[/C][C]89.95[/C][C]89.72[/C][C]0.230000000000004[/C][/ROW]
[ROW][C]3[/C][C]90.19[/C][C]89.9499880684179[/C][C]0.240011931582103[/C][/ROW]
[ROW][C]4[/C][C]90.23[/C][C]90.1899875490345[/C][C]0.0400124509655058[/C][/ROW]
[ROW][C]5[/C][C]90.32[/C][C]90.2299979242963[/C][C]0.0900020757036657[/C][/ROW]
[ROW][C]6[/C][C]90.86[/C][C]90.3199953310124[/C][C]0.540004668987635[/C][/ROW]
[ROW][C]7[/C][C]90.99[/C][C]90.8599719864781[/C][C]0.130028013521923[/C][/ROW]
[ROW][C]8[/C][C]90.98[/C][C]90.989993254609[/C][C]-0.00999325460904288[/C][/ROW]
[ROW][C]9[/C][C]91.22[/C][C]90.9800005184145[/C][C]0.239999481585485[/C][/ROW]
[ROW][C]10[/C][C]91.42[/C][C]91.2199875496804[/C][C]0.200012450319647[/C][/ROW]
[ROW][C]11[/C][C]91.55[/C][C]91.4199896240654[/C][C]0.130010375934646[/C][/ROW]
[ROW][C]12[/C][C]91.67[/C][C]91.549993255524[/C][C]0.120006744475987[/C][/ROW]
[ROW][C]13[/C][C]92.3[/C][C]91.6699937744769[/C][C]0.630006225523147[/C][/ROW]
[ROW][C]14[/C][C]92.92[/C][C]92.2999673175174[/C][C]0.620032682482616[/C][/ROW]
[ROW][C]15[/C][C]93.1[/C][C]92.9199678349093[/C][C]0.180032165090665[/C][/ROW]
[ROW][C]16[/C][C]93.23[/C][C]93.0999906605715[/C][C]0.130009339428526[/C][/ROW]
[ROW][C]17[/C][C]93.36[/C][C]93.2299932555778[/C][C]0.13000674442219[/C][/ROW]
[ROW][C]18[/C][C]93.42[/C][C]93.3599932557124[/C][C]0.0600067442875911[/C][/ROW]
[ROW][C]19[/C][C]93.58[/C][C]93.4199968870635[/C][C]0.160003112936494[/C][/ROW]
[ROW][C]20[/C][C]93.68[/C][C]93.5799916996075[/C][C]0.100008300392531[/C][/ROW]
[ROW][C]21[/C][C]94.02[/C][C]93.679994811925[/C][C]0.340005188074983[/C][/ROW]
[ROW][C]22[/C][C]94.29[/C][C]94.0199823617399[/C][C]0.270017638260072[/C][/ROW]
[ROW][C]23[/C][C]94.54[/C][C]94.2899859924451[/C][C]0.250014007554867[/C][/ROW]
[ROW][C]24[/C][C]94.64[/C][C]94.5399870301624[/C][C]0.100012969837636[/C][/ROW]
[ROW][C]25[/C][C]96.7[/C][C]94.6399948116828[/C][C]2.06000518831722[/C][/ROW]
[ROW][C]26[/C][C]96.83[/C][C]96.6998931342564[/C][C]0.130106865743599[/C][/ROW]
[ROW][C]27[/C][C]97.07[/C][C]96.8299932505185[/C][C]0.240006749481523[/C][/ROW]
[ROW][C]28[/C][C]97.11[/C][C]97.0699875493033[/C][C]0.040012450696679[/C][/ROW]
[ROW][C]29[/C][C]97.42[/C][C]97.1099979242963[/C][C]0.310002075703665[/C][/ROW]
[ROW][C]30[/C][C]97.44[/C][C]97.4199839181947[/C][C]0.020016081805295[/C][/ROW]
[ROW][C]31[/C][C]97.67[/C][C]97.4399989616369[/C][C]0.230001038363142[/C][/ROW]
[ROW][C]32[/C][C]97.84[/C][C]97.669988068364[/C][C]0.170011931635955[/C][/ROW]
[ROW][C]33[/C][C]98.17[/C][C]97.8399911803856[/C][C]0.330008819614434[/C][/ROW]
[ROW][C]34[/C][C]98.31[/C][C]98.169982880316[/C][C]0.140017119684018[/C][/ROW]
[ROW][C]35[/C][C]98.42[/C][C]98.3099927364097[/C][C]0.110007263590262[/C][/ROW]
[ROW][C]36[/C][C]98.44[/C][C]98.4199942932144[/C][C]0.0200057067856392[/C][/ROW]
[ROW][C]37[/C][C]98.89[/C][C]98.4399989621751[/C][C]0.450001037824933[/C][/ROW]
[ROW][C]38[/C][C]99.26[/C][C]98.8899766555464[/C][C]0.3700233444536[/C][/ROW]
[ROW][C]39[/C][C]99.59[/C][C]99.2599808045047[/C][C]0.330019195495268[/C][/ROW]
[ROW][C]40[/C][C]99.82[/C][C]99.5899828797777[/C][C]0.230017120222271[/C][/ROW]
[ROW][C]41[/C][C]99.95[/C][C]99.8199880675297[/C][C]0.130011932470254[/C][/ROW]
[ROW][C]42[/C][C]99.99[/C][C]99.9499932554433[/C][C]0.0400067445567203[/C][/ROW]
[ROW][C]43[/C][C]100.28[/C][C]99.9899979245924[/C][C]0.290002075407642[/C][/ROW]
[ROW][C]44[/C][C]100.38[/C][C]100.279984955724[/C][C]0.10001504427639[/C][/ROW]
[ROW][C]45[/C][C]100.46[/C][C]100.379994811575[/C][C]0.0800051884248347[/C][/ROW]
[ROW][C]46[/C][C]100.52[/C][C]100.459995849615[/C][C]0.0600041503846711[/C][/ROW]
[ROW][C]47[/C][C]100.43[/C][C]100.519996887198[/C][C]-0.0899968871980406[/C][/ROW]
[ROW][C]48[/C][C]100.44[/C][C]100.430004668718[/C][C]0.00999533128153018[/C][/ROW]
[ROW][C]49[/C][C]101.33[/C][C]100.439999481478[/C][C]0.890000518522243[/C][/ROW]
[ROW][C]50[/C][C]101.43[/C][C]101.329953829938[/C][C]0.100046170061987[/C][/ROW]
[ROW][C]51[/C][C]101.41[/C][C]101.42999480996[/C][C]-0.0199948099604796[/C][/ROW]
[ROW][C]52[/C][C]101.53[/C][C]101.41000103726[/C][C]0.119998962740368[/C][/ROW]
[ROW][C]53[/C][C]101.58[/C][C]101.529993774881[/C][C]0.0500062251194606[/C][/ROW]
[ROW][C]54[/C][C]101.73[/C][C]101.579997405855[/C][C]0.150002594145136[/C][/ROW]
[ROW][C]55[/C][C]102.12[/C][C]101.729992218399[/C][C]0.39000778160117[/C][/ROW]
[ROW][C]56[/C][C]101.86[/C][C]102.119979767783[/C][C]-0.259979767783207[/C][/ROW]
[ROW][C]57[/C][C]101.93[/C][C]101.860013486826[/C][C]0.0699865131741717[/C][/ROW]
[ROW][C]58[/C][C]101.86[/C][C]101.929996369349[/C][C]-0.0699963693485728[/C][/ROW]
[ROW][C]59[/C][C]101.92[/C][C]101.860003631163[/C][C]0.0599963688372753[/C][/ROW]
[ROW][C]60[/C][C]102.02[/C][C]101.919996887602[/C][C]0.100003112398255[/C][/ROW]
[/TABLE]
Source: https://freestatistics.org/blog/index.php?pk=295661&T=2

Globally Unique Identifier (entire table): ba.freestatistics.org/blog/index.php?pk=295661&T=2

As an alternative you can also use a QR Code:  

The GUIDs for individual cells are displayed in the table below:

Interpolation Forecasts of Exponential Smoothing
tObservedFittedResiduals
289.9589.720.230000000000004
390.1989.94998806841790.240011931582103
490.2390.18998754903450.0400124509655058
590.3290.22999792429630.0900020757036657
690.8690.31999533101240.540004668987635
790.9990.85997198647810.130028013521923
890.9890.989993254609-0.00999325460904288
991.2290.98000051841450.239999481585485
1091.4291.21998754968040.200012450319647
1191.5591.41998962406540.130010375934646
1291.6791.5499932555240.120006744475987
1392.391.66999377447690.630006225523147
1492.9292.29996731751740.620032682482616
1593.192.91996783490930.180032165090665
1693.2393.09999066057150.130009339428526
1793.3693.22999325557780.13000674442219
1893.4293.35999325571240.0600067442875911
1993.5893.41999688706350.160003112936494
2093.6893.57999169960750.100008300392531
2194.0293.6799948119250.340005188074983
2294.2994.01998236173990.270017638260072
2394.5494.28998599244510.250014007554867
2494.6494.53998703016240.100012969837636
2596.794.63999481168282.06000518831722
2696.8396.69989313425640.130106865743599
2797.0796.82999325051850.240006749481523
2897.1197.06998754930330.040012450696679
2997.4297.10999792429630.310002075703665
3097.4497.41998391819470.020016081805295
3197.6797.43999896163690.230001038363142
3297.8497.6699880683640.170011931635955
3398.1797.83999118038560.330008819614434
3498.3198.1699828803160.140017119684018
3598.4298.30999273640970.110007263590262
3698.4498.41999429321440.0200057067856392
3798.8998.43999896217510.450001037824933
3899.2698.88997665554640.3700233444536
3999.5999.25998080450470.330019195495268
4099.8299.58998287977770.230017120222271
4199.9599.81998806752970.130011932470254
4299.9999.94999325544330.0400067445567203
43100.2899.98999792459240.290002075407642
44100.38100.2799849557240.10001504427639
45100.46100.3799948115750.0800051884248347
46100.52100.4599958496150.0600041503846711
47100.43100.519996887198-0.0899968871980406
48100.44100.4300046687180.00999533128153018
49101.33100.4399994814780.890000518522243
50101.43101.3299538299380.100046170061987
51101.41101.42999480996-0.0199948099604796
52101.53101.410001037260.119998962740368
53101.58101.5299937748810.0500062251194606
54101.73101.5799974058550.150002594145136
55102.12101.7299922183990.39000778160117
56101.86102.119979767783-0.259979767783207
57101.93101.8600134868260.0699865131741717
58101.86101.929996369349-0.0699963693485728
59101.92101.8600036311630.0599963688372753
60102.02101.9199968876020.100003112398255


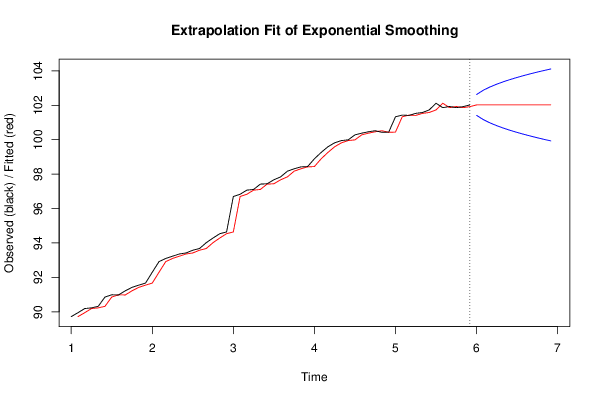
Extrapolation Forecasts of Exponential Smoothing
tForecast95% Lower Bound95% Upper Bound
61102.019994812194101.416598641338102.623390983051
62102.019994812194101.166685897488102.8733037269
63102.019994812194100.974918131357103.065071493032
64102.019994812194100.813249423248103.22674020114
65102.019994812194100.67081595131103.369173673078
66102.019994812194100.542045975607103.497943648781
67102.019994812194100.423629588168103.616360036221
68102.019994812194100.31341018394103.726579440449
69102.019994812194100.209889771511103.830099852877
70102.019994812194100.111977667822103.928011956567
71102.019994812194100.018850492528104.02113913186
72102.01999481219499.929868559298104.11012106509

\begin{tabular}{lllllllll}
\hline
Extrapolation Forecasts of Exponential Smoothing \tabularnewline
t & Forecast & 95% Lower Bound & 95% Upper Bound \tabularnewline
61 & 102.019994812194 & 101.416598641338 & 102.623390983051 \tabularnewline
62 & 102.019994812194 & 101.166685897488 & 102.8733037269 \tabularnewline
63 & 102.019994812194 & 100.974918131357 & 103.065071493032 \tabularnewline
64 & 102.019994812194 & 100.813249423248 & 103.22674020114 \tabularnewline
65 & 102.019994812194 & 100.67081595131 & 103.369173673078 \tabularnewline
66 & 102.019994812194 & 100.542045975607 & 103.497943648781 \tabularnewline
67 & 102.019994812194 & 100.423629588168 & 103.616360036221 \tabularnewline
68 & 102.019994812194 & 100.31341018394 & 103.726579440449 \tabularnewline
69 & 102.019994812194 & 100.209889771511 & 103.830099852877 \tabularnewline
70 & 102.019994812194 & 100.111977667822 & 103.928011956567 \tabularnewline
71 & 102.019994812194 & 100.018850492528 & 104.02113913186 \tabularnewline
72 & 102.019994812194 & 99.929868559298 & 104.11012106509 \tabularnewline
\hline
\end{tabular}
%Source: https://freestatistics.org/blog/index.php?pk=295661&T=3

[TABLE]
[ROW][C]Extrapolation Forecasts of Exponential Smoothing[/C][/ROW]
[ROW][C]t[/C][C]Forecast[/C][C]95% Lower Bound[/C][C]95% Upper Bound[/C][/ROW]
[ROW][C]61[/C][C]102.019994812194[/C][C]101.416598641338[/C][C]102.623390983051[/C][/ROW]
[ROW][C]62[/C][C]102.019994812194[/C][C]101.166685897488[/C][C]102.8733037269[/C][/ROW]
[ROW][C]63[/C][C]102.019994812194[/C][C]100.974918131357[/C][C]103.065071493032[/C][/ROW]
[ROW][C]64[/C][C]102.019994812194[/C][C]100.813249423248[/C][C]103.22674020114[/C][/ROW]
[ROW][C]65[/C][C]102.019994812194[/C][C]100.67081595131[/C][C]103.369173673078[/C][/ROW]
[ROW][C]66[/C][C]102.019994812194[/C][C]100.542045975607[/C][C]103.497943648781[/C][/ROW]
[ROW][C]67[/C][C]102.019994812194[/C][C]100.423629588168[/C][C]103.616360036221[/C][/ROW]
[ROW][C]68[/C][C]102.019994812194[/C][C]100.31341018394[/C][C]103.726579440449[/C][/ROW]
[ROW][C]69[/C][C]102.019994812194[/C][C]100.209889771511[/C][C]103.830099852877[/C][/ROW]
[ROW][C]70[/C][C]102.019994812194[/C][C]100.111977667822[/C][C]103.928011956567[/C][/ROW]
[ROW][C]71[/C][C]102.019994812194[/C][C]100.018850492528[/C][C]104.02113913186[/C][/ROW]
[ROW][C]72[/C][C]102.019994812194[/C][C]99.929868559298[/C][C]104.11012106509[/C][/ROW]
[/TABLE]
Source: https://freestatistics.org/blog/index.php?pk=295661&T=3

Globally Unique Identifier (entire table): ba.freestatistics.org/blog/index.php?pk=295661&T=3

As an alternative you can also use a QR Code:  

The GUIDs for individual cells are displayed in the table below:

Extrapolation Forecasts of Exponential Smoothing
tForecast95% Lower Bound95% Upper Bound
61102.019994812194101.416598641338102.623390983051
62102.019994812194101.166685897488102.8733037269
63102.019994812194100.974918131357103.065071493032
64102.019994812194100.813249423248103.22674020114
65102.019994812194100.67081595131103.369173673078
66102.019994812194100.542045975607103.497943648781
67102.019994812194100.423629588168103.616360036221
68102.019994812194100.31341018394103.726579440449
69102.019994812194100.209889771511103.830099852877
70102.019994812194100.111977667822103.928011956567
71102.019994812194100.018850492528104.02113913186
72102.01999481219499.929868559298104.11012106509


Parameters (Session):
par1 = 12 ; par2 = Single ; par3 = multiplicative ;
Parameters (R input):
par1 = 12 ; par2 = Single ; par3 = multiplicative ;
R code (references can be found in the software module):
par1 <- as.numeric(par1)
if (par2 == 'Single') K <- 1
if (par2 == 'Double') K <- 2
if (par2 == 'Triple') K <- par1
nx <- length(x)
nxmK <- nx - K
x <- ts(x, frequency = par1)
if (par2 == 'Single') fit <- HoltWinters(x, gamma=F, beta=F)
if (par2 == 'Double') fit <- HoltWinters(x, gamma=F)
if (par2 == 'Triple') fit <- HoltWinters(x, seasonal=par3)
fit
myresid <- x - fit$fitted[,'xhat']
bitmap(file='test1.png')
op <- par(mfrow=c(2,1))
plot(fit,ylab='Observed (black) / Fitted (red)',main='Interpolation Fit of Exponential Smoothing')
plot(myresid,ylab='Residuals',main='Interpolation Prediction Errors')
par(op)
dev.off()
bitmap(file='test2.png')
p <- predict(fit, par1, prediction.interval=TRUE)
np <- length(p[,1])
plot(fit,p,ylab='Observed (black) / Fitted (red)',main='Extrapolation Fit of Exponential Smoothing')
dev.off()
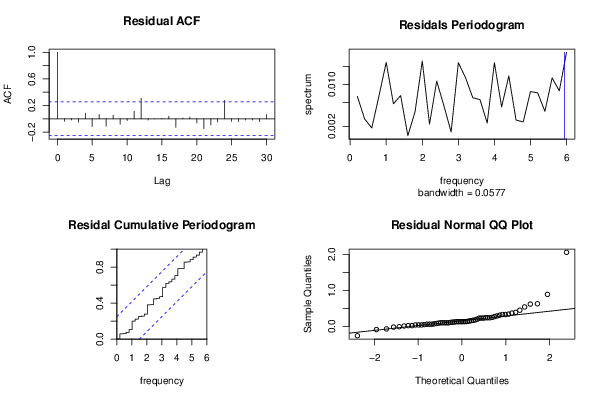
bitmap(file='test3.png')
op <- par(mfrow = c(2,2))
acf(as.numeric(myresid),lag.max = nx/2,main='Residual ACF')
spectrum(myresid,main='Residals Periodogram')
cpgram(myresid,main='Residal Cumulative Periodogram')
qqnorm(myresid,main='Residual Normal QQ Plot')
qqline(myresid)
par(op)
dev.off()
load(file='createtable')
a<-table.start()
a<-table.row.start(a)
a<-table.element(a,'Estimated Parameters of Exponential Smoothing',2,TRUE)
a<-table.row.end(a)
a<-table.row.start(a)
a<-table.element(a,'Parameter',header=TRUE)
a<-table.element(a,'Value',header=TRUE)
a<-table.row.end(a)
a<-table.row.start(a)
a<-table.element(a,'alpha',header=TRUE)
a<-table.element(a,fit$alpha)
a<-table.row.end(a)
a<-table.row.start(a)
a<-table.element(a,'beta',header=TRUE)
a<-table.element(a,fit$beta)
a<-table.row.end(a)
a<-table.row.start(a)
a<-table.element(a,'gamma',header=TRUE)
a<-table.element(a,fit$gamma)
a<-table.row.end(a)
a<-table.end(a)
table.save(a,file='mytable.tab')
a<-table.start()
a<-table.row.start(a)
a<-table.element(a,'Interpolation Forecasts of Exponential Smoothing',4,TRUE)
a<-table.row.end(a)
a<-table.row.start(a)
a<-table.element(a,'t',header=TRUE)
a<-table.element(a,'Observed',header=TRUE)
a<-table.element(a,'Fitted',header=TRUE)
a<-table.element(a,'Residuals',header=TRUE)
a<-table.row.end(a)
for (i in 1:nxmK) {
a<-table.row.start(a)
a<-table.element(a,i+K,header=TRUE)
a<-table.element(a,x[i+K])
a<-table.element(a,fit$fitted[i,'xhat'])
a<-table.element(a,myresid[i])
a<-table.row.end(a)
}
a<-table.end(a)
table.save(a,file='mytable1.tab')
a<-table.start()
a<-table.row.start(a)
a<-table.element(a,'Extrapolation Forecasts of Exponential Smoothing',4,TRUE)
a<-table.row.end(a)
a<-table.row.start(a)
a<-table.element(a,'t',header=TRUE)
a<-table.element(a,'Forecast',header=TRUE)
a<-table.element(a,'95% Lower Bound',header=TRUE)
a<-table.element(a,'95% Upper Bound',header=TRUE)
a<-table.row.end(a)
for (i in 1:np) {
a<-table.row.start(a)
a<-table.element(a,nx+i,header=TRUE)
a<-table.element(a,p[i,'fit'])
a<-table.element(a,p[i,'lwr'])
a<-table.element(a,p[i,'upr'])
a<-table.row.end(a)
}
a<-table.end(a)
table.save(a,file='mytable2.tab')