Free Statistics

of Irreproducible Research!

Author's title

Author*The author of this computation has been verified*
R Software Modulerwasp_notchedbox1.wasp
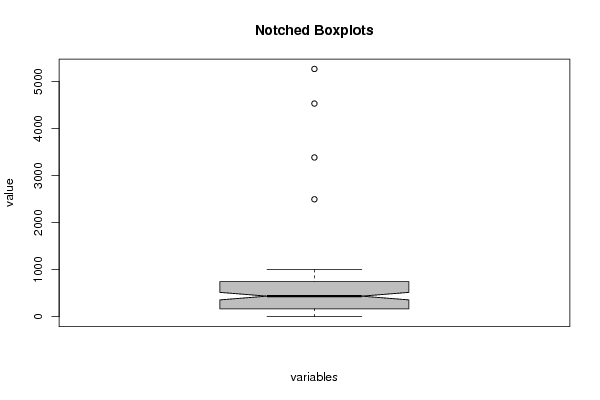
Title produced by softwareNotched Boxplots
Date of computationThu, 17 Nov 2016 10:55:57 +0100
Cite this page as followsStatistical Computations at FreeStatistics.org, Office for Research Development and Education, URL https://freestatistics.org/blog/index.php?v=date/2016/Nov/17/t14793765704t0429vi27boeyj.htm/, Retrieved Sun, 05 May 2024 09:28:27 +0000
Statistical Computations at FreeStatistics.org, Office for Research Development and Education, URL https://freestatistics.org/blog/index.php?pk=296799, Retrieved Sun, 05 May 2024 09:28:27 +0000
QR Codes:

Original text written by user:
IsPrivate?No (this computation is public)
User-defined keywords
Estimated Impact85
Family? (F = Feedback message, R = changed R code, M = changed R Module, P = changed Parameters, D = changed Data)
-       [Notched Boxplots] [] [2016-11-17 09:55:57] [219800a2f11ddd28e3280d87dbde8c8d] [Current]
Feedback Forum

Post a new message
Dataseries X:
945
18
46
47
665
872
743
194
8
246
862
437
615
470
635
413
91
169
36
675
130
110
63
3384
168
169
79
107
936
331
837
861
641
177
645
594
34
153
81
994
42
354
813
995
35
219
571
642
417
63
646
525
4529
799
287
212
942
750
201
284
124
39
540
310
958
124
275
835
38
485
704
720
837
553
999
754
344
314
909
947
944
36
43
860
469
494
788
239
692
626
344
423
159
807
418
86
200
999
534
299
732
24
5265
871
354
15
337
427
127
496
864
88
1
429
386
610
486
936
566
5
491
117
2495
698
202
886
486
528
301
NA
NA
NA
NA
NA
NA
NA
NA
NA
NA
NA
NA
NA
NA
NA


Summary of computational transaction
Raw Input view raw input (R code)
Raw Outputview raw output of R engine
Computing time1 seconds
R ServerBig Analytics Cloud Computing Center

\begin{tabular}{lllllllll}
\hline
Summary of computational transaction \tabularnewline
Raw Input view raw input (R code)  \tabularnewline
Raw Outputview raw output of R engine  \tabularnewline
Computing time1 seconds \tabularnewline
R ServerBig Analytics Cloud Computing Center \tabularnewline
\hline
\end{tabular}
%Source: https://freestatistics.org/blog/index.php?pk=296799&T=0

[TABLE]
[ROW]
Summary of computational transaction[/C][/ROW] [ROW]Raw Input[/C] view raw input (R code) [/C][/ROW] [ROW]Raw Output[/C]view raw output of R engine [/C][/ROW] [ROW]Computing time[/C]1 seconds[/C][/ROW] [ROW]R Server[/C]Big Analytics Cloud Computing Center[/C][/ROW] [/TABLE] Source: https://freestatistics.org/blog/index.php?pk=296799&T=0

Globally Unique Identifier (entire table): ba.freestatistics.org/blog/index.php?pk=296799&T=0

As an alternative you can also use a QR Code:  

The GUIDs for individual cells are displayed in the table below:

Summary of computational transaction
Raw Input view raw input (R code)
Raw Outputview raw output of R engine
Computing time1 seconds
R ServerBig Analytics Cloud Computing Center


Boxplot statistics
Variablelower whiskerlower hingemedianupper hingeupper whisker
V11168437743999

\begin{tabular}{lllllllll}
\hline
Boxplot statistics \tabularnewline
Variable & lower whisker & lower hinge & median & upper hinge & upper whisker \tabularnewline
V1 & 1 & 168 & 437 & 743 & 999 \tabularnewline
\hline
\end{tabular}
%Source: https://freestatistics.org/blog/index.php?pk=296799&T=1

[TABLE]
[ROW][C]Boxplot statistics[/C][/ROW]
[ROW][C]Variable[/C][C]lower whisker[/C][C]lower hinge[/C][C]median[/C][C]upper hinge[/C][C]upper whisker[/C][/ROW]
[ROW][C]V1[/C][C]1[/C][C]168[/C][C]437[/C][C]743[/C][C]999[/C][/ROW]
[/TABLE]
Source: https://freestatistics.org/blog/index.php?pk=296799&T=1

Globally Unique Identifier (entire table): ba.freestatistics.org/blog/index.php?pk=296799&T=1

As an alternative you can also use a QR Code:  

The GUIDs for individual cells are displayed in the table below:

Boxplot statistics
Variablelower whiskerlower hingemedianupper hingeupper whisker
V11168437743999


Boxplot Notches
Variablelower boundmedianupper bound
V1357.011035160317437516.988964839683

\begin{tabular}{lllllllll}
\hline
Boxplot Notches \tabularnewline
Variable & lower bound & median & upper bound \tabularnewline
V1 & 357.011035160317 & 437 & 516.988964839683 \tabularnewline
\hline
\end{tabular}
%Source: https://freestatistics.org/blog/index.php?pk=296799&T=2

[TABLE]
[ROW][C]Boxplot Notches[/C][/ROW]
[ROW][C]Variable[/C][C]lower bound[/C][C]median[/C][C]upper bound[/C][/ROW]
[ROW][C]V1[/C][C]357.011035160317[/C][C]437[/C][C]516.988964839683[/C][/ROW]
[/TABLE]
Source: https://freestatistics.org/blog/index.php?pk=296799&T=2

Globally Unique Identifier (entire table): ba.freestatistics.org/blog/index.php?pk=296799&T=2

As an alternative you can also use a QR Code:  

The GUIDs for individual cells are displayed in the table below:

Boxplot Notches
Variablelower boundmedianupper bound
V1357.011035160317437516.988964839683


Parameters (Session):
par1 = grey ; par2 = no ;
Parameters (R input):
par1 = grey ; par2 = no ;
R code (references can be found in the software module):
if(par2=='yes') {
z <- na.omit(as.data.frame(t(y)))
} else {
z <- as.data.frame(t(y))
}
bitmap(file='test1.png')
(r<-boxplot(z ,xlab=xlab,ylab=ylab,main=main,notch=TRUE,col=par1))
dev.off()
load(file='createtable')
a<-table.start()
a<-table.row.start(a)
a<-table.element(a,'Boxplot statistics',6,TRUE)
a<-table.row.end(a)
a<-table.row.start(a)
a<-table.element(a,'Variable',1,TRUE)
a<-table.element(a,'lower whisker',1,TRUE)
a<-table.element(a,'lower hinge',1,TRUE)
a<-table.element(a,'median',1,TRUE)
a<-table.element(a,'upper hinge',1,TRUE)
a<-table.element(a,'upper whisker',1,TRUE)
a<-table.row.end(a)
for (i in 1:length(y[,1]))
{
a<-table.row.start(a)
a<-table.element(a,dimnames(t(x))[[2]][i],1,TRUE)
for (j in 1:5)
{
a<-table.element(a,r$stats[j,i])
}
a<-table.row.end(a)
}
a<-table.end(a)
table.save(a,file='mytable.tab')
a<-table.start()
a<-table.row.start(a)
a<-table.element(a,'Boxplot Notches',4,TRUE)
a<-table.row.end(a)
a<-table.row.start(a)
a<-table.element(a,'Variable',1,TRUE)
a<-table.element(a,'lower bound',1,TRUE)
a<-table.element(a,'median',1,TRUE)
a<-table.element(a,'upper bound',1,TRUE)
a<-table.row.end(a)
for (i in 1:length(y[,1]))
{
a<-table.row.start(a)
a<-table.element(a,dimnames(t(x))[[2]][i],1,TRUE)
a<-table.element(a,r$conf[1,i])
a<-table.element(a,r$stats[3,i])
a<-table.element(a,r$conf[2,i])
a<-table.row.end(a)
}
a<-table.end(a)
table.save(a,file='mytable1.tab')