Free Statistics
of Irreproducible Research!
Description of Statistical Computation | ||||||||||||||||||||||||||||||
|---|---|---|---|---|---|---|---|---|---|---|---|---|---|---|---|---|---|---|---|---|---|---|---|---|---|---|---|---|---|---|
| Author's title | ||||||||||||||||||||||||||||||
| Author | *The author of this computation has been verified* | |||||||||||||||||||||||||||||
| R Software Module | rwasp_skewness_kurtosis_plot.wasp | |||||||||||||||||||||||||||||
| Title produced by software | Skewness-Kurtosis Plot | |||||||||||||||||||||||||||||
| Date of computation | Fri, 18 Nov 2016 18:36:45 +0100 | |||||||||||||||||||||||||||||
| Cite this page as follows | Statistical Computations at FreeStatistics.org, Office for Research Development and Education, URL https://freestatistics.org/blog/index.php?v=date/2016/Nov/18/t1479491209h462jvf0al6kgsa.htm/, Retrieved Thu, 02 May 2024 19:11:57 +0000 | |||||||||||||||||||||||||||||
| Statistical Computations at FreeStatistics.org, Office for Research Development and Education, URL https://freestatistics.org/blog/index.php?pk=296832, Retrieved Thu, 02 May 2024 19:11:57 +0000 | ||||||||||||||||||||||||||||||
| QR Codes: | ||||||||||||||||||||||||||||||
|
| ||||||||||||||||||||||||||||||
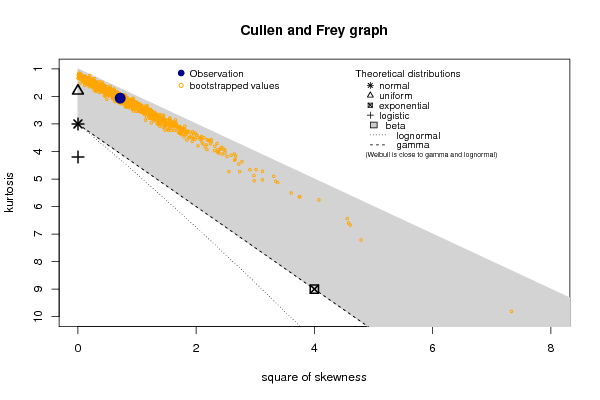
| Original text written by user: | Hier gaan we kijken naar de Cullen and Frey graph. Gamma verdeling= stippellijn= geeft alle mogelijk verdelingen van kurtosis en skewness weer. Normaalverdeling is er maar 1 punt qua skewness en kurtosis mogelijk. Uniforme verdeling is er maar 1 punt qua skewness en kurtosis mogelijk.De vraag is: Welke verdeling hebben onze data? bv is het een normaalverdeling: sterretje valt buiten de puntenwolk. 0nze reeks is dus niet normaal verdeeld hier. uniforme verdeling. Er is minsten 1 oranje punt binnen de driehoek. Er is een zeker kans dat onze reeks een uniforme verdeling is, maar echt overtuigend is het niet. Als het blauwe bolletje (midden punten wolk waar de meeste observaties liggen) en de driehoek samenvalt, heb je eens schot in de roos. Als de driehoek omsingeld wordt door de puntenwolk is het ook al goed. We kunnen nu al uitspraken doen over de waarschijnlijk hoe iets al dan niet verdeeld is. | |||||||||||||||||||||||||||||
| IsPrivate? | No (this computation is public) | |||||||||||||||||||||||||||||
| User-defined keywords | ||||||||||||||||||||||||||||||
| Estimated Impact | 73 | |||||||||||||||||||||||||||||
Tree of Dependent Computations | ||||||||||||||||||||||||||||||
| Family? (F = Feedback message, R = changed R code, M = changed R Module, P = changed Parameters, D = changed Data) | ||||||||||||||||||||||||||||||
| - [Skewness and Kurtosis Test] [F1 competitie n 1...] [2016-11-18 16:59:44] [95b24d8e95676a05c34b365fb6729343] - RM [Skewness-Kurtosis Plot] [Skewness and kurt...] [2016-11-18 17:36:45] [673dd365cbcfe0c4e35658a2fe545652] [Current] | ||||||||||||||||||||||||||||||
| Feedback Forum | ||||||||||||||||||||||||||||||
Post a new message | ||||||||||||||||||||||||||||||
Dataset | ||||||||||||||||||||||||||||||
| Dataseries X: | ||||||||||||||||||||||||||||||
3106.78 3235.94 2998.12 2896.3 2952 3060.24 2988.32 2889 2881.82 2969.22 3026.2 3146.08 3032.48 2719.74 2785.18 2797.28 2783.7 2822.84 2835.8 2823.22 2879.14 3003.5 2910.7 2895.54 2982.36 3087.2 3195.28 3272.72 3390.6 3676.12 4052.18 4431.2 4554.96 4279.7 4391.86 4482.82 4530.68 4580.66 4623.5 4720.14 4811.82 4980.18 5174.28 5181.24 | ||||||||||||||||||||||||||||||
Tables (Output of Computation) | ||||||||||||||||||||||||||||||
| ||||||||||||||||||||||||||||||
Figures (Output of Computation) | ||||||||||||||||||||||||||||||
Input Parameters & R Code | ||||||||||||||||||||||||||||||
| Parameters (Session): | ||||||||||||||||||||||||||||||
| par1 = 8 ; par2 = 0 ; | ||||||||||||||||||||||||||||||
| Parameters (R input): | ||||||||||||||||||||||||||||||
| R code (references can be found in the software module): | ||||||||||||||||||||||||||||||
library(fitdistrplus) | ||||||||||||||||||||||||||||||