Free Statistics

of Irreproducible Research!

Author's title

Author*The author of this computation has been verified*
R Software Modulerwasp_autocorrelation.wasp
Title produced by software(Partial) Autocorrelation Function
Date of computationTue, 22 Nov 2016 12:02:10 +0100
Cite this page as followsStatistical Computations at FreeStatistics.org, Office for Research Development and Education, URL https://freestatistics.org/blog/index.php?v=date/2016/Nov/22/t1479812688y1ntblmnembfklr.htm/, Retrieved Sun, 05 May 2024 14:23:37 +0000
Statistical Computations at FreeStatistics.org, Office for Research Development and Education, URL https://freestatistics.org/blog/index.php?pk=296897, Retrieved Sun, 05 May 2024 14:23:37 +0000
QR Codes:

Original text written by user:
IsPrivate?No (this computation is public)
User-defined keywords
Estimated Impact83
Family? (F = Feedback message, R = changed R code, M = changed R Module, P = changed Parameters, D = changed Data)
-       [(Partial) Autocorrelation Function] [Season kolom B] [2016-11-22 11:02:10] [cedc5386ad7644fa02c81dc221bdf6b7] [Current]
Feedback Forum

Post a new message
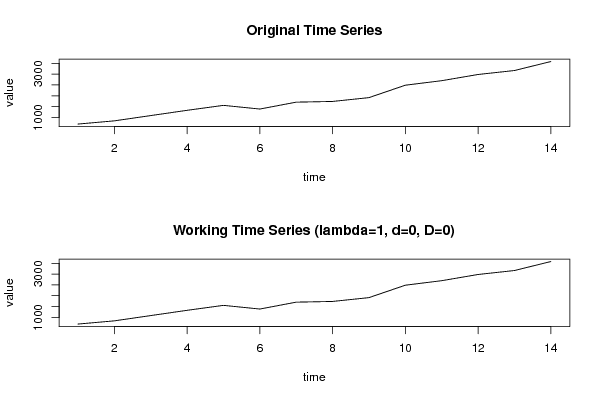
Dataseries X:
691.72
839.86
1083.36
1326.82
1555.92
1385.54
1704.08
1737.16
1913.56
2487.28
2696.24
2982.52
3165.84
3580.66
NA
NA
NA
NA
NA
NA
NA
NA
NA
NA
NA
NA
NA
NA
NA
NA
NA
NA
NA
NA
NA
NA
NA
NA
NA
NA
NA
NA
NA
NA
NA
NA
NA
NA
NA
NA
NA
NA
NA
NA
NA
NA
NA
NA
NA
NA
NA
NA
NA
NA
NA
NA
NA
NA
NA
NA
NA
NA
NA
NA
NA
NA
NA
NA
NA
NA
NA
NA
NA
NA
NA
NA
NA
NA
NA
NA
NA
NA
NA
NA
NA
NA
NA
NA
NA
NA
NA
NA
NA
NA
NA
NA
NA
NA
NA
NA
NA
NA
NA
NA
NA
NA
NA
NA
NA
NA
NA
NA
NA
NA
NA
NA
NA
NA
NA
NA
NA
NA
NA
NA
NA
NA
NA
NA
NA
NA
NA
NA
NA
NA


Summary of computational transaction
Raw Input view raw input (R code)
Raw Outputview raw output of R engine
Computing time1 seconds
R ServerBig Analytics Cloud Computing Center

\begin{tabular}{lllllllll}
\hline
Summary of computational transaction \tabularnewline
Raw Input view raw input (R code)  \tabularnewline
Raw Outputview raw output of R engine  \tabularnewline
Computing time1 seconds \tabularnewline
R ServerBig Analytics Cloud Computing Center \tabularnewline
\hline
\end{tabular}
%Source: https://freestatistics.org/blog/index.php?pk=296897&T=0

[TABLE]
[ROW]
Summary of computational transaction[/C][/ROW] [ROW]Raw Input[/C] view raw input (R code) [/C][/ROW] [ROW]Raw Output[/C]view raw output of R engine [/C][/ROW] [ROW]Computing time[/C]1 seconds[/C][/ROW] [ROW]R Server[/C]Big Analytics Cloud Computing Center[/C][/ROW] [/TABLE] Source: https://freestatistics.org/blog/index.php?pk=296897&T=0

Globally Unique Identifier (entire table): ba.freestatistics.org/blog/index.php?pk=296897&T=0

As an alternative you can also use a QR Code:  

The GUIDs for individual cells are displayed in the table below:

Summary of computational transaction
Raw Input view raw input (R code)
Raw Outputview raw output of R engine
Computing time1 seconds
R ServerBig Analytics Cloud Computing Center


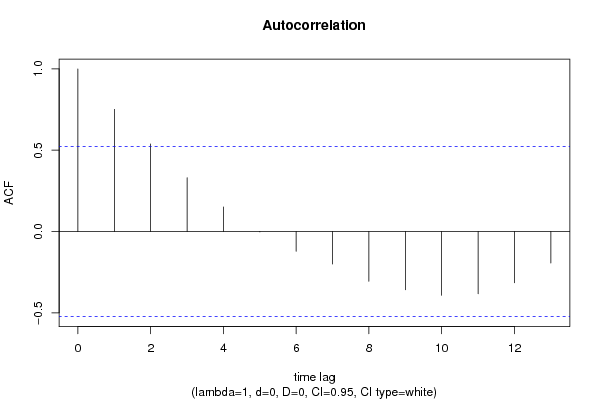
Autocorrelation Function
Time lag kACF(k)T-STATP-value
10.7511852.81070.006943
20.5384682.01480.031776
30.3308191.23780.118072
40.1509560.56480.290565
5-0.002507-0.00940.496324
6-0.121516-0.45470.328157
7-0.200067-0.74860.23325
8-0.305794-1.14420.135868
9-0.35804-1.33970.100848
10-0.391787-1.46590.082383
11-0.383138-1.43360.086825
12-0.315094-1.1790.129029
13-0.193484-0.7240.240509
14NANANA
15NANANA
16NANANA
17NANANA
18NANANA
19NANANA
20NANANA
21NANANA

\begin{tabular}{lllllllll}
\hline
Autocorrelation Function \tabularnewline
Time lag k & ACF(k) & T-STAT & P-value \tabularnewline
1 & 0.751185 & 2.8107 & 0.006943 \tabularnewline
2 & 0.538468 & 2.0148 & 0.031776 \tabularnewline
3 & 0.330819 & 1.2378 & 0.118072 \tabularnewline
4 & 0.150956 & 0.5648 & 0.290565 \tabularnewline
5 & -0.002507 & -0.0094 & 0.496324 \tabularnewline
6 & -0.121516 & -0.4547 & 0.328157 \tabularnewline
7 & -0.200067 & -0.7486 & 0.23325 \tabularnewline
8 & -0.305794 & -1.1442 & 0.135868 \tabularnewline
9 & -0.35804 & -1.3397 & 0.100848 \tabularnewline
10 & -0.391787 & -1.4659 & 0.082383 \tabularnewline
11 & -0.383138 & -1.4336 & 0.086825 \tabularnewline
12 & -0.315094 & -1.179 & 0.129029 \tabularnewline
13 & -0.193484 & -0.724 & 0.240509 \tabularnewline
14 & NA & NA & NA \tabularnewline
15 & NA & NA & NA \tabularnewline
16 & NA & NA & NA \tabularnewline
17 & NA & NA & NA \tabularnewline
18 & NA & NA & NA \tabularnewline
19 & NA & NA & NA \tabularnewline
20 & NA & NA & NA \tabularnewline
21 & NA & NA & NA \tabularnewline
\hline
\end{tabular}
%Source: https://freestatistics.org/blog/index.php?pk=296897&T=1

[TABLE]
[ROW][C]Autocorrelation Function[/C][/ROW]
[ROW][C]Time lag k[/C][C]ACF(k)[/C][C]T-STAT[/C][C]P-value[/C][/ROW]
[ROW][C]1[/C][C]0.751185[/C][C]2.8107[/C][C]0.006943[/C][/ROW]
[ROW][C]2[/C][C]0.538468[/C][C]2.0148[/C][C]0.031776[/C][/ROW]
[ROW][C]3[/C][C]0.330819[/C][C]1.2378[/C][C]0.118072[/C][/ROW]
[ROW][C]4[/C][C]0.150956[/C][C]0.5648[/C][C]0.290565[/C][/ROW]
[ROW][C]5[/C][C]-0.002507[/C][C]-0.0094[/C][C]0.496324[/C][/ROW]
[ROW][C]6[/C][C]-0.121516[/C][C]-0.4547[/C][C]0.328157[/C][/ROW]
[ROW][C]7[/C][C]-0.200067[/C][C]-0.7486[/C][C]0.23325[/C][/ROW]
[ROW][C]8[/C][C]-0.305794[/C][C]-1.1442[/C][C]0.135868[/C][/ROW]
[ROW][C]9[/C][C]-0.35804[/C][C]-1.3397[/C][C]0.100848[/C][/ROW]
[ROW][C]10[/C][C]-0.391787[/C][C]-1.4659[/C][C]0.082383[/C][/ROW]
[ROW][C]11[/C][C]-0.383138[/C][C]-1.4336[/C][C]0.086825[/C][/ROW]
[ROW][C]12[/C][C]-0.315094[/C][C]-1.179[/C][C]0.129029[/C][/ROW]
[ROW][C]13[/C][C]-0.193484[/C][C]-0.724[/C][C]0.240509[/C][/ROW]
[ROW][C]14[/C][C]NA[/C][C]NA[/C][C]NA[/C][/ROW]
[ROW][C]15[/C][C]NA[/C][C]NA[/C][C]NA[/C][/ROW]
[ROW][C]16[/C][C]NA[/C][C]NA[/C][C]NA[/C][/ROW]
[ROW][C]17[/C][C]NA[/C][C]NA[/C][C]NA[/C][/ROW]
[ROW][C]18[/C][C]NA[/C][C]NA[/C][C]NA[/C][/ROW]
[ROW][C]19[/C][C]NA[/C][C]NA[/C][C]NA[/C][/ROW]
[ROW][C]20[/C][C]NA[/C][C]NA[/C][C]NA[/C][/ROW]
[ROW][C]21[/C][C]NA[/C][C]NA[/C][C]NA[/C][/ROW]
[/TABLE]
Source: https://freestatistics.org/blog/index.php?pk=296897&T=1

Globally Unique Identifier (entire table): ba.freestatistics.org/blog/index.php?pk=296897&T=1

As an alternative you can also use a QR Code:  

The GUIDs for individual cells are displayed in the table below:

Autocorrelation Function
Time lag kACF(k)T-STATP-value
10.7511852.81070.006943
20.5384682.01480.031776
30.3308191.23780.118072
40.1509560.56480.290565
5-0.002507-0.00940.496324
6-0.121516-0.45470.328157
7-0.200067-0.74860.23325
8-0.305794-1.14420.135868
9-0.35804-1.33970.100848
10-0.391787-1.46590.082383
11-0.383138-1.43360.086825
12-0.315094-1.1790.129029
13-0.193484-0.7240.240509
14NANANA
15NANANA
16NANANA
17NANANA
18NANANA
19NANANA
20NANANA
21NANANA


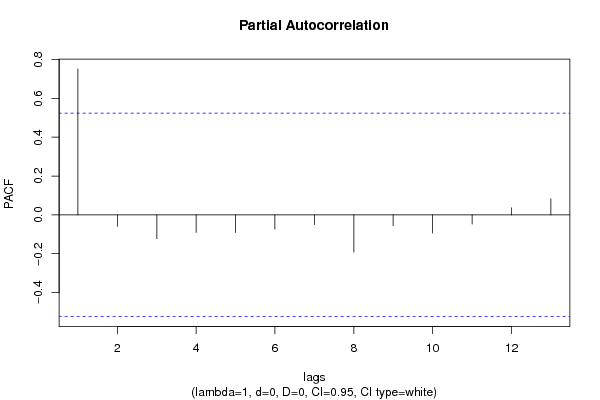
Partial Autocorrelation Function
Time lag kPACF(k)T-STATP-value
10.7511852.81070.006943
2-0.059237-0.22160.413896
3-0.122372-0.45790.327034
4-0.089976-0.33670.370684
5-0.090355-0.33810.370161
6-0.073414-0.27470.393783
7-0.049118-0.18380.428409
8-0.191907-0.7180.242269
9-0.055407-0.20730.419376
10-0.093369-0.34940.366011
11-0.046771-0.1750.431792
120.0361820.13540.447118
130.0822930.30790.381341
14NANANA
15NANANA
16NANANA
17NANANA
18NANANA
19NANANA
20NANANA
21NANANA

\begin{tabular}{lllllllll}
\hline
Partial Autocorrelation Function \tabularnewline
Time lag k & PACF(k) & T-STAT & P-value \tabularnewline
1 & 0.751185 & 2.8107 & 0.006943 \tabularnewline
2 & -0.059237 & -0.2216 & 0.413896 \tabularnewline
3 & -0.122372 & -0.4579 & 0.327034 \tabularnewline
4 & -0.089976 & -0.3367 & 0.370684 \tabularnewline
5 & -0.090355 & -0.3381 & 0.370161 \tabularnewline
6 & -0.073414 & -0.2747 & 0.393783 \tabularnewline
7 & -0.049118 & -0.1838 & 0.428409 \tabularnewline
8 & -0.191907 & -0.718 & 0.242269 \tabularnewline
9 & -0.055407 & -0.2073 & 0.419376 \tabularnewline
10 & -0.093369 & -0.3494 & 0.366011 \tabularnewline
11 & -0.046771 & -0.175 & 0.431792 \tabularnewline
12 & 0.036182 & 0.1354 & 0.447118 \tabularnewline
13 & 0.082293 & 0.3079 & 0.381341 \tabularnewline
14 & NA & NA & NA \tabularnewline
15 & NA & NA & NA \tabularnewline
16 & NA & NA & NA \tabularnewline
17 & NA & NA & NA \tabularnewline
18 & NA & NA & NA \tabularnewline
19 & NA & NA & NA \tabularnewline
20 & NA & NA & NA \tabularnewline
21 & NA & NA & NA \tabularnewline
\hline
\end{tabular}
%Source: https://freestatistics.org/blog/index.php?pk=296897&T=2

[TABLE]
[ROW][C]Partial Autocorrelation Function[/C][/ROW]
[ROW][C]Time lag k[/C][C]PACF(k)[/C][C]T-STAT[/C][C]P-value[/C][/ROW]
[ROW][C]1[/C][C]0.751185[/C][C]2.8107[/C][C]0.006943[/C][/ROW]
[ROW][C]2[/C][C]-0.059237[/C][C]-0.2216[/C][C]0.413896[/C][/ROW]
[ROW][C]3[/C][C]-0.122372[/C][C]-0.4579[/C][C]0.327034[/C][/ROW]
[ROW][C]4[/C][C]-0.089976[/C][C]-0.3367[/C][C]0.370684[/C][/ROW]
[ROW][C]5[/C][C]-0.090355[/C][C]-0.3381[/C][C]0.370161[/C][/ROW]
[ROW][C]6[/C][C]-0.073414[/C][C]-0.2747[/C][C]0.393783[/C][/ROW]
[ROW][C]7[/C][C]-0.049118[/C][C]-0.1838[/C][C]0.428409[/C][/ROW]
[ROW][C]8[/C][C]-0.191907[/C][C]-0.718[/C][C]0.242269[/C][/ROW]
[ROW][C]9[/C][C]-0.055407[/C][C]-0.2073[/C][C]0.419376[/C][/ROW]
[ROW][C]10[/C][C]-0.093369[/C][C]-0.3494[/C][C]0.366011[/C][/ROW]
[ROW][C]11[/C][C]-0.046771[/C][C]-0.175[/C][C]0.431792[/C][/ROW]
[ROW][C]12[/C][C]0.036182[/C][C]0.1354[/C][C]0.447118[/C][/ROW]
[ROW][C]13[/C][C]0.082293[/C][C]0.3079[/C][C]0.381341[/C][/ROW]
[ROW][C]14[/C][C]NA[/C][C]NA[/C][C]NA[/C][/ROW]
[ROW][C]15[/C][C]NA[/C][C]NA[/C][C]NA[/C][/ROW]
[ROW][C]16[/C][C]NA[/C][C]NA[/C][C]NA[/C][/ROW]
[ROW][C]17[/C][C]NA[/C][C]NA[/C][C]NA[/C][/ROW]
[ROW][C]18[/C][C]NA[/C][C]NA[/C][C]NA[/C][/ROW]
[ROW][C]19[/C][C]NA[/C][C]NA[/C][C]NA[/C][/ROW]
[ROW][C]20[/C][C]NA[/C][C]NA[/C][C]NA[/C][/ROW]
[ROW][C]21[/C][C]NA[/C][C]NA[/C][C]NA[/C][/ROW]
[/TABLE]
Source: https://freestatistics.org/blog/index.php?pk=296897&T=2

Globally Unique Identifier (entire table): ba.freestatistics.org/blog/index.php?pk=296897&T=2

As an alternative you can also use a QR Code:  

The GUIDs for individual cells are displayed in the table below:

Partial Autocorrelation Function
Time lag kPACF(k)T-STATP-value
10.7511852.81070.006943
2-0.059237-0.22160.413896
3-0.122372-0.45790.327034
4-0.089976-0.33670.370684
5-0.090355-0.33810.370161
6-0.073414-0.27470.393783
7-0.049118-0.18380.428409
8-0.191907-0.7180.242269
9-0.055407-0.20730.419376
10-0.093369-0.34940.366011
11-0.046771-0.1750.431792
120.0361820.13540.447118
130.0822930.30790.381341
14NANANA
15NANANA
16NANANA
17NANANA
18NANANA
19NANANA
20NANANA
21NANANA


Parameters (Session):
par1 = Default ; par2 = 1 ; par3 = 0 ; par4 = 0 ; par5 = 12 ; par6 = White Noise ; par7 = 0.95 ;
Parameters (R input):
par1 = Default ; par2 = 1 ; par3 = 0 ; par4 = 0 ; par5 = 12 ; par6 = White Noise ; par7 = 0.95 ; par8 = ;
R code (references can be found in the software module):
if (par1 == 'Default') {
par1 = 10*log10(length(x))
} else {
par1 <- as.numeric(par1)
}
par2 <- as.numeric(par2)
par3 <- as.numeric(par3)
par4 <- as.numeric(par4)
par5 <- as.numeric(par5)
if (par6 == 'White Noise') par6 <- 'white' else par6 <- 'ma'
par7 <- as.numeric(par7)
if (par8 != '') par8 <- as.numeric(par8)
x <- na.omit(x)
ox <- x
if (par8 == '') {
if (par2 == 0) {
x <- log(x)
} else {
x <- (x ^ par2 - 1) / par2
}
} else {
x <- log(x,base=par8)
}
if (par3 > 0) x <- diff(x,lag=1,difference=par3)
if (par4 > 0) x <- diff(x,lag=par5,difference=par4)
bitmap(file='picts.png')
op <- par(mfrow=c(2,1))
plot(ox,type='l',main='Original Time Series',xlab='time',ylab='value')
if (par8=='') {
mytitle <- paste('Working Time Series (lambda=',par2,', d=',par3,', D=',par4,')',sep='')
mysub <- paste('(lambda=',par2,', d=',par3,', D=',par4,', CI=', par7, ', CI type=',par6,')',sep='')
} else {
mytitle <- paste('Working Time Series (base=',par8,', d=',par3,', D=',par4,')',sep='')
mysub <- paste('(base=',par8,', d=',par3,', D=',par4,', CI=', par7, ', CI type=',par6,')',sep='')
}
plot(x,type='l', main=mytitle,xlab='time',ylab='value')
par(op)
dev.off()
bitmap(file='pic1.png')
racf <- acf(x, par1, main='Autocorrelation', xlab='time lag', ylab='ACF', ci.type=par6, ci=par7, sub=mysub)
dev.off()
bitmap(file='pic2.png')
rpacf <- pacf(x,par1,main='Partial Autocorrelation',xlab='lags',ylab='PACF',sub=mysub)
dev.off()
(myacf <- c(racf$acf))
(mypacf <- c(rpacf$acf))
lengthx <- length(x)
sqrtn <- sqrt(lengthx)
load(file='createtable')
a<-table.start()
a<-table.row.start(a)
a<-table.element(a,'Autocorrelation Function',4,TRUE)
a<-table.row.end(a)
a<-table.row.start(a)
a<-table.element(a,'Time lag k',header=TRUE)
a<-table.element(a,'ACF(k)',header=TRUE)
a<-table.element(a,'T-STAT',header=TRUE)
a<-table.element(a,'P-value',header=TRUE)
a<-table.row.end(a)
for (i in 2:(par1+1)) {
a<-table.row.start(a)
a<-table.element(a,i-1,header=TRUE)
a<-table.element(a,round(myacf[i],6))
mytstat <- myacf[i]*sqrtn
a<-table.element(a,round(mytstat,4))
a<-table.element(a,round(1-pt(abs(mytstat),lengthx),6))
a<-table.row.end(a)
}
a<-table.end(a)
table.save(a,file='mytable.tab')
a<-table.start()
a<-table.row.start(a)
a<-table.element(a,'Partial Autocorrelation Function',4,TRUE)
a<-table.row.end(a)
a<-table.row.start(a)
a<-table.element(a,'Time lag k',header=TRUE)
a<-table.element(a,'PACF(k)',header=TRUE)
a<-table.element(a,'T-STAT',header=TRUE)
a<-table.element(a,'P-value',header=TRUE)
a<-table.row.end(a)
for (i in 1:par1) {
a<-table.row.start(a)
a<-table.element(a,i,header=TRUE)
a<-table.element(a,round(mypacf[i],6))
mytstat <- mypacf[i]*sqrtn
a<-table.element(a,round(mytstat,4))
a<-table.element(a,round(1-pt(abs(mytstat),lengthx),6))
a<-table.row.end(a)
}
a<-table.end(a)
table.save(a,file='mytable1.tab')