Free Statistics

of Irreproducible Research!

Author's title

Author*The author of this computation has been verified*
R Software Modulerwasp_autocorrelation.wasp
Title produced by software(Partial) Autocorrelation Function
Date of computationTue, 22 Nov 2016 12:31:36 +0100
Cite this page as followsStatistical Computations at FreeStatistics.org, Office for Research Development and Education, URL https://freestatistics.org/blog/index.php?v=date/2016/Nov/22/t1479814510rwcvh327e2kbd9p.htm/, Retrieved Sun, 05 May 2024 11:03:34 +0000
Statistical Computations at FreeStatistics.org, Office for Research Development and Education, URL https://freestatistics.org/blog/index.php?pk=296903, Retrieved Sun, 05 May 2024 11:03:34 +0000
QR Codes:

Original text written by user:
IsPrivate?No (this computation is public)
User-defined keywords
Estimated Impact83
Family? (F = Feedback message, R = changed R code, M = changed R Module, P = changed Parameters, D = changed Data)
-       [(Partial) Autocorrelation Function] [Partial auto corr...] [2016-11-22 11:31:36] [67fe698233d7575d27222b521501ef35] [Current]
Feedback Forum

Post a new message
Dataseries X:
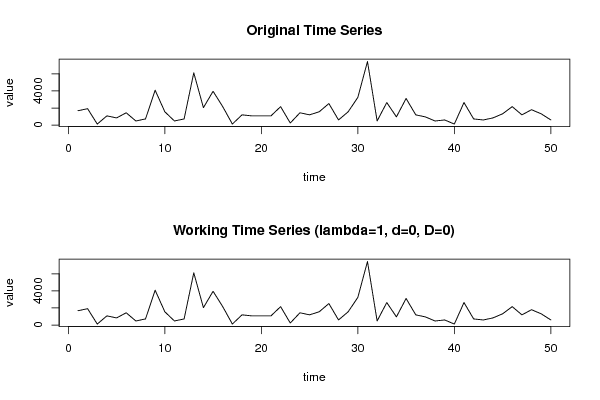
1680
1920
120
1080
840
1440
480
720
4080
1560
480
720
6120
2040
3960
2160
120
1200
1080
1080
1080
2160
240
1440
1200
1560
2520
600
1560
3240
7440
480
2640
960
3120
1200
960
480
600
120
2640
720
600
840
1320
2160
1200
1800
1320
600


Summary of computational transaction
Raw Input view raw input (R code)
Raw Outputview raw output of R engine
Computing time1 seconds
R ServerBig Analytics Cloud Computing Center

\begin{tabular}{lllllllll}
\hline
Summary of computational transaction \tabularnewline
Raw Input view raw input (R code)  \tabularnewline
Raw Outputview raw output of R engine  \tabularnewline
Computing time1 seconds \tabularnewline
R ServerBig Analytics Cloud Computing Center \tabularnewline
\hline
\end{tabular}
%Source: https://freestatistics.org/blog/index.php?pk=296903&T=0

[TABLE]
[ROW]
Summary of computational transaction[/C][/ROW] [ROW]Raw Input[/C] view raw input (R code) [/C][/ROW] [ROW]Raw Output[/C]view raw output of R engine [/C][/ROW] [ROW]Computing time[/C]1 seconds[/C][/ROW] [ROW]R Server[/C]Big Analytics Cloud Computing Center[/C][/ROW] [/TABLE] Source: https://freestatistics.org/blog/index.php?pk=296903&T=0

Globally Unique Identifier (entire table): ba.freestatistics.org/blog/index.php?pk=296903&T=0

As an alternative you can also use a QR Code:  

The GUIDs for individual cells are displayed in the table below:

Summary of computational transaction
Raw Input view raw input (R code)
Raw Outputview raw output of R engine
Computing time1 seconds
R ServerBig Analytics Cloud Computing Center


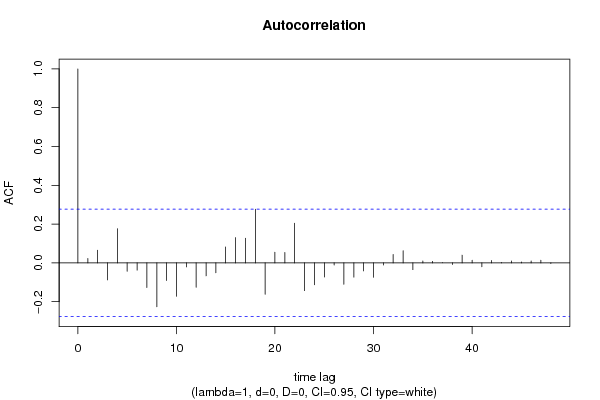
Autocorrelation Function
Time lag kACF(k)T-STATP-value
10.0227920.16120.436306
20.0656370.46410.322287
3-0.087464-0.61850.269538
40.1763881.24730.109058
5-0.042965-0.30380.381267
6-0.037438-0.26470.396154
7-0.127318-0.90030.186146
8-0.22576-1.59640.058354
9-0.090662-0.64110.262201
10-0.172019-1.21640.11478
11-0.020491-0.14490.44269
12-0.12561-0.88820.189345
13-0.066823-0.47250.319308
14-0.051201-0.3620.359422
150.0824230.58280.281316
160.1304580.92250.180355
170.1271430.8990.186471
180.2765761.95570.028051
19-0.161404-1.14130.129591
200.0552140.39040.34894
210.0532870.37680.353959
220.204131.44340.077569
23-0.143093-1.01180.158248
24-0.112341-0.79440.215366
25-0.072562-0.51310.305073
26-0.011303-0.07990.468308
27-0.110303-0.780.219545
28-0.073351-0.51870.303139
29-0.041229-0.29150.385924
30-0.07378-0.52170.302089
31-0.010715-0.07580.469952
320.0430260.30420.381104
330.0624160.44130.330431
34-0.034802-0.24610.403312
350.0101850.0720.471437
360.0079620.05630.477664
370.0003630.00260.498982
38-0.008049-0.05690.477419
390.0399510.28250.389366
400.0139770.09880.460833
41-0.019921-0.14090.444273
420.0122770.08680.465585
430.0020770.01470.494171
440.0100190.07080.471902
450.0050960.0360.485699
460.0095430.06750.473234
470.0140370.09930.460666
48-0.003507-0.02480.490157

\begin{tabular}{lllllllll}
\hline
Autocorrelation Function \tabularnewline
Time lag k & ACF(k) & T-STAT & P-value \tabularnewline
1 & 0.022792 & 0.1612 & 0.436306 \tabularnewline
2 & 0.065637 & 0.4641 & 0.322287 \tabularnewline
3 & -0.087464 & -0.6185 & 0.269538 \tabularnewline
4 & 0.176388 & 1.2473 & 0.109058 \tabularnewline
5 & -0.042965 & -0.3038 & 0.381267 \tabularnewline
6 & -0.037438 & -0.2647 & 0.396154 \tabularnewline
7 & -0.127318 & -0.9003 & 0.186146 \tabularnewline
8 & -0.22576 & -1.5964 & 0.058354 \tabularnewline
9 & -0.090662 & -0.6411 & 0.262201 \tabularnewline
10 & -0.172019 & -1.2164 & 0.11478 \tabularnewline
11 & -0.020491 & -0.1449 & 0.44269 \tabularnewline
12 & -0.12561 & -0.8882 & 0.189345 \tabularnewline
13 & -0.066823 & -0.4725 & 0.319308 \tabularnewline
14 & -0.051201 & -0.362 & 0.359422 \tabularnewline
15 & 0.082423 & 0.5828 & 0.281316 \tabularnewline
16 & 0.130458 & 0.9225 & 0.180355 \tabularnewline
17 & 0.127143 & 0.899 & 0.186471 \tabularnewline
18 & 0.276576 & 1.9557 & 0.028051 \tabularnewline
19 & -0.161404 & -1.1413 & 0.129591 \tabularnewline
20 & 0.055214 & 0.3904 & 0.34894 \tabularnewline
21 & 0.053287 & 0.3768 & 0.353959 \tabularnewline
22 & 0.20413 & 1.4434 & 0.077569 \tabularnewline
23 & -0.143093 & -1.0118 & 0.158248 \tabularnewline
24 & -0.112341 & -0.7944 & 0.215366 \tabularnewline
25 & -0.072562 & -0.5131 & 0.305073 \tabularnewline
26 & -0.011303 & -0.0799 & 0.468308 \tabularnewline
27 & -0.110303 & -0.78 & 0.219545 \tabularnewline
28 & -0.073351 & -0.5187 & 0.303139 \tabularnewline
29 & -0.041229 & -0.2915 & 0.385924 \tabularnewline
30 & -0.07378 & -0.5217 & 0.302089 \tabularnewline
31 & -0.010715 & -0.0758 & 0.469952 \tabularnewline
32 & 0.043026 & 0.3042 & 0.381104 \tabularnewline
33 & 0.062416 & 0.4413 & 0.330431 \tabularnewline
34 & -0.034802 & -0.2461 & 0.403312 \tabularnewline
35 & 0.010185 & 0.072 & 0.471437 \tabularnewline
36 & 0.007962 & 0.0563 & 0.477664 \tabularnewline
37 & 0.000363 & 0.0026 & 0.498982 \tabularnewline
38 & -0.008049 & -0.0569 & 0.477419 \tabularnewline
39 & 0.039951 & 0.2825 & 0.389366 \tabularnewline
40 & 0.013977 & 0.0988 & 0.460833 \tabularnewline
41 & -0.019921 & -0.1409 & 0.444273 \tabularnewline
42 & 0.012277 & 0.0868 & 0.465585 \tabularnewline
43 & 0.002077 & 0.0147 & 0.494171 \tabularnewline
44 & 0.010019 & 0.0708 & 0.471902 \tabularnewline
45 & 0.005096 & 0.036 & 0.485699 \tabularnewline
46 & 0.009543 & 0.0675 & 0.473234 \tabularnewline
47 & 0.014037 & 0.0993 & 0.460666 \tabularnewline
48 & -0.003507 & -0.0248 & 0.490157 \tabularnewline
\hline
\end{tabular}
%Source: https://freestatistics.org/blog/index.php?pk=296903&T=1

[TABLE]
[ROW][C]Autocorrelation Function[/C][/ROW]
[ROW][C]Time lag k[/C][C]ACF(k)[/C][C]T-STAT[/C][C]P-value[/C][/ROW]
[ROW][C]1[/C][C]0.022792[/C][C]0.1612[/C][C]0.436306[/C][/ROW]
[ROW][C]2[/C][C]0.065637[/C][C]0.4641[/C][C]0.322287[/C][/ROW]
[ROW][C]3[/C][C]-0.087464[/C][C]-0.6185[/C][C]0.269538[/C][/ROW]
[ROW][C]4[/C][C]0.176388[/C][C]1.2473[/C][C]0.109058[/C][/ROW]
[ROW][C]5[/C][C]-0.042965[/C][C]-0.3038[/C][C]0.381267[/C][/ROW]
[ROW][C]6[/C][C]-0.037438[/C][C]-0.2647[/C][C]0.396154[/C][/ROW]
[ROW][C]7[/C][C]-0.127318[/C][C]-0.9003[/C][C]0.186146[/C][/ROW]
[ROW][C]8[/C][C]-0.22576[/C][C]-1.5964[/C][C]0.058354[/C][/ROW]
[ROW][C]9[/C][C]-0.090662[/C][C]-0.6411[/C][C]0.262201[/C][/ROW]
[ROW][C]10[/C][C]-0.172019[/C][C]-1.2164[/C][C]0.11478[/C][/ROW]
[ROW][C]11[/C][C]-0.020491[/C][C]-0.1449[/C][C]0.44269[/C][/ROW]
[ROW][C]12[/C][C]-0.12561[/C][C]-0.8882[/C][C]0.189345[/C][/ROW]
[ROW][C]13[/C][C]-0.066823[/C][C]-0.4725[/C][C]0.319308[/C][/ROW]
[ROW][C]14[/C][C]-0.051201[/C][C]-0.362[/C][C]0.359422[/C][/ROW]
[ROW][C]15[/C][C]0.082423[/C][C]0.5828[/C][C]0.281316[/C][/ROW]
[ROW][C]16[/C][C]0.130458[/C][C]0.9225[/C][C]0.180355[/C][/ROW]
[ROW][C]17[/C][C]0.127143[/C][C]0.899[/C][C]0.186471[/C][/ROW]
[ROW][C]18[/C][C]0.276576[/C][C]1.9557[/C][C]0.028051[/C][/ROW]
[ROW][C]19[/C][C]-0.161404[/C][C]-1.1413[/C][C]0.129591[/C][/ROW]
[ROW][C]20[/C][C]0.055214[/C][C]0.3904[/C][C]0.34894[/C][/ROW]
[ROW][C]21[/C][C]0.053287[/C][C]0.3768[/C][C]0.353959[/C][/ROW]
[ROW][C]22[/C][C]0.20413[/C][C]1.4434[/C][C]0.077569[/C][/ROW]
[ROW][C]23[/C][C]-0.143093[/C][C]-1.0118[/C][C]0.158248[/C][/ROW]
[ROW][C]24[/C][C]-0.112341[/C][C]-0.7944[/C][C]0.215366[/C][/ROW]
[ROW][C]25[/C][C]-0.072562[/C][C]-0.5131[/C][C]0.305073[/C][/ROW]
[ROW][C]26[/C][C]-0.011303[/C][C]-0.0799[/C][C]0.468308[/C][/ROW]
[ROW][C]27[/C][C]-0.110303[/C][C]-0.78[/C][C]0.219545[/C][/ROW]
[ROW][C]28[/C][C]-0.073351[/C][C]-0.5187[/C][C]0.303139[/C][/ROW]
[ROW][C]29[/C][C]-0.041229[/C][C]-0.2915[/C][C]0.385924[/C][/ROW]
[ROW][C]30[/C][C]-0.07378[/C][C]-0.5217[/C][C]0.302089[/C][/ROW]
[ROW][C]31[/C][C]-0.010715[/C][C]-0.0758[/C][C]0.469952[/C][/ROW]
[ROW][C]32[/C][C]0.043026[/C][C]0.3042[/C][C]0.381104[/C][/ROW]
[ROW][C]33[/C][C]0.062416[/C][C]0.4413[/C][C]0.330431[/C][/ROW]
[ROW][C]34[/C][C]-0.034802[/C][C]-0.2461[/C][C]0.403312[/C][/ROW]
[ROW][C]35[/C][C]0.010185[/C][C]0.072[/C][C]0.471437[/C][/ROW]
[ROW][C]36[/C][C]0.007962[/C][C]0.0563[/C][C]0.477664[/C][/ROW]
[ROW][C]37[/C][C]0.000363[/C][C]0.0026[/C][C]0.498982[/C][/ROW]
[ROW][C]38[/C][C]-0.008049[/C][C]-0.0569[/C][C]0.477419[/C][/ROW]
[ROW][C]39[/C][C]0.039951[/C][C]0.2825[/C][C]0.389366[/C][/ROW]
[ROW][C]40[/C][C]0.013977[/C][C]0.0988[/C][C]0.460833[/C][/ROW]
[ROW][C]41[/C][C]-0.019921[/C][C]-0.1409[/C][C]0.444273[/C][/ROW]
[ROW][C]42[/C][C]0.012277[/C][C]0.0868[/C][C]0.465585[/C][/ROW]
[ROW][C]43[/C][C]0.002077[/C][C]0.0147[/C][C]0.494171[/C][/ROW]
[ROW][C]44[/C][C]0.010019[/C][C]0.0708[/C][C]0.471902[/C][/ROW]
[ROW][C]45[/C][C]0.005096[/C][C]0.036[/C][C]0.485699[/C][/ROW]
[ROW][C]46[/C][C]0.009543[/C][C]0.0675[/C][C]0.473234[/C][/ROW]
[ROW][C]47[/C][C]0.014037[/C][C]0.0993[/C][C]0.460666[/C][/ROW]
[ROW][C]48[/C][C]-0.003507[/C][C]-0.0248[/C][C]0.490157[/C][/ROW]
[/TABLE]
Source: https://freestatistics.org/blog/index.php?pk=296903&T=1

Globally Unique Identifier (entire table): ba.freestatistics.org/blog/index.php?pk=296903&T=1

As an alternative you can also use a QR Code:  

The GUIDs for individual cells are displayed in the table below:

Autocorrelation Function
Time lag kACF(k)T-STATP-value
10.0227920.16120.436306
20.0656370.46410.322287
3-0.087464-0.61850.269538
40.1763881.24730.109058
5-0.042965-0.30380.381267
6-0.037438-0.26470.396154
7-0.127318-0.90030.186146
8-0.22576-1.59640.058354
9-0.090662-0.64110.262201
10-0.172019-1.21640.11478
11-0.020491-0.14490.44269
12-0.12561-0.88820.189345
13-0.066823-0.47250.319308
14-0.051201-0.3620.359422
150.0824230.58280.281316
160.1304580.92250.180355
170.1271430.8990.186471
180.2765761.95570.028051
19-0.161404-1.14130.129591
200.0552140.39040.34894
210.0532870.37680.353959
220.204131.44340.077569
23-0.143093-1.01180.158248
24-0.112341-0.79440.215366
25-0.072562-0.51310.305073
26-0.011303-0.07990.468308
27-0.110303-0.780.219545
28-0.073351-0.51870.303139
29-0.041229-0.29150.385924
30-0.07378-0.52170.302089
31-0.010715-0.07580.469952
320.0430260.30420.381104
330.0624160.44130.330431
34-0.034802-0.24610.403312
350.0101850.0720.471437
360.0079620.05630.477664
370.0003630.00260.498982
38-0.008049-0.05690.477419
390.0399510.28250.389366
400.0139770.09880.460833
41-0.019921-0.14090.444273
420.0122770.08680.465585
430.0020770.01470.494171
440.0100190.07080.471902
450.0050960.0360.485699
460.0095430.06750.473234
470.0140370.09930.460666
48-0.003507-0.02480.490157


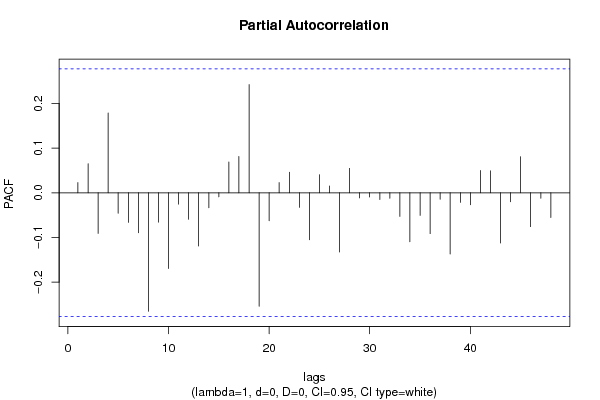
Partial Autocorrelation Function
Time lag kPACF(k)T-STATP-value
10.0227920.16120.436306
20.0651510.46070.32351
3-0.09078-0.64190.261931
40.1787521.2640.106051
5-0.045637-0.32270.374132
6-0.066215-0.46820.320833
7-0.08944-0.63240.264992
8-0.265139-1.87480.033333
9-0.065621-0.4640.322327
10-0.169641-1.19950.117985
11-0.025367-0.17940.429186
12-0.05938-0.41990.338186
13-0.119124-0.84230.201806
14-0.033321-0.23560.407348
15-0.009054-0.0640.474605
160.0691310.48880.31355
170.081120.57360.284403
180.2421721.71240.046508
19-0.254058-1.79650.039232
20-0.062583-0.44250.330009
210.0227790.16110.436343
220.0459130.32470.373397
23-0.032604-0.23050.409304
24-0.105041-0.74280.230553
250.040470.28620.387965
260.0151690.10730.457506
27-0.132664-0.93810.176358
280.054690.38670.350304
29-0.011399-0.08060.46804
30-0.009311-0.06580.473884
31-0.014847-0.1050.458405
32-0.012117-0.08570.466032
33-0.052722-0.37280.355436
34-0.109512-0.77440.221179
35-0.050585-0.35770.36104
36-0.091362-0.6460.260607
37-0.014508-0.10260.45935
38-0.137164-0.96990.168384
39-0.021415-0.15140.440125
40-0.026738-0.18910.425404
410.049860.35260.362949
420.0491330.34740.364866
43-0.112442-0.79510.215161
44-0.019984-0.14130.444098
450.0806790.57050.28545
46-0.075685-0.53520.297451
47-0.012217-0.08640.465751
48-0.055141-0.38990.349131

\begin{tabular}{lllllllll}
\hline
Partial Autocorrelation Function \tabularnewline
Time lag k & PACF(k) & T-STAT & P-value \tabularnewline
1 & 0.022792 & 0.1612 & 0.436306 \tabularnewline
2 & 0.065151 & 0.4607 & 0.32351 \tabularnewline
3 & -0.09078 & -0.6419 & 0.261931 \tabularnewline
4 & 0.178752 & 1.264 & 0.106051 \tabularnewline
5 & -0.045637 & -0.3227 & 0.374132 \tabularnewline
6 & -0.066215 & -0.4682 & 0.320833 \tabularnewline
7 & -0.08944 & -0.6324 & 0.264992 \tabularnewline
8 & -0.265139 & -1.8748 & 0.033333 \tabularnewline
9 & -0.065621 & -0.464 & 0.322327 \tabularnewline
10 & -0.169641 & -1.1995 & 0.117985 \tabularnewline
11 & -0.025367 & -0.1794 & 0.429186 \tabularnewline
12 & -0.05938 & -0.4199 & 0.338186 \tabularnewline
13 & -0.119124 & -0.8423 & 0.201806 \tabularnewline
14 & -0.033321 & -0.2356 & 0.407348 \tabularnewline
15 & -0.009054 & -0.064 & 0.474605 \tabularnewline
16 & 0.069131 & 0.4888 & 0.31355 \tabularnewline
17 & 0.08112 & 0.5736 & 0.284403 \tabularnewline
18 & 0.242172 & 1.7124 & 0.046508 \tabularnewline
19 & -0.254058 & -1.7965 & 0.039232 \tabularnewline
20 & -0.062583 & -0.4425 & 0.330009 \tabularnewline
21 & 0.022779 & 0.1611 & 0.436343 \tabularnewline
22 & 0.045913 & 0.3247 & 0.373397 \tabularnewline
23 & -0.032604 & -0.2305 & 0.409304 \tabularnewline
24 & -0.105041 & -0.7428 & 0.230553 \tabularnewline
25 & 0.04047 & 0.2862 & 0.387965 \tabularnewline
26 & 0.015169 & 0.1073 & 0.457506 \tabularnewline
27 & -0.132664 & -0.9381 & 0.176358 \tabularnewline
28 & 0.05469 & 0.3867 & 0.350304 \tabularnewline
29 & -0.011399 & -0.0806 & 0.46804 \tabularnewline
30 & -0.009311 & -0.0658 & 0.473884 \tabularnewline
31 & -0.014847 & -0.105 & 0.458405 \tabularnewline
32 & -0.012117 & -0.0857 & 0.466032 \tabularnewline
33 & -0.052722 & -0.3728 & 0.355436 \tabularnewline
34 & -0.109512 & -0.7744 & 0.221179 \tabularnewline
35 & -0.050585 & -0.3577 & 0.36104 \tabularnewline
36 & -0.091362 & -0.646 & 0.260607 \tabularnewline
37 & -0.014508 & -0.1026 & 0.45935 \tabularnewline
38 & -0.137164 & -0.9699 & 0.168384 \tabularnewline
39 & -0.021415 & -0.1514 & 0.440125 \tabularnewline
40 & -0.026738 & -0.1891 & 0.425404 \tabularnewline
41 & 0.04986 & 0.3526 & 0.362949 \tabularnewline
42 & 0.049133 & 0.3474 & 0.364866 \tabularnewline
43 & -0.112442 & -0.7951 & 0.215161 \tabularnewline
44 & -0.019984 & -0.1413 & 0.444098 \tabularnewline
45 & 0.080679 & 0.5705 & 0.28545 \tabularnewline
46 & -0.075685 & -0.5352 & 0.297451 \tabularnewline
47 & -0.012217 & -0.0864 & 0.465751 \tabularnewline
48 & -0.055141 & -0.3899 & 0.349131 \tabularnewline
\hline
\end{tabular}
%Source: https://freestatistics.org/blog/index.php?pk=296903&T=2

[TABLE]
[ROW][C]Partial Autocorrelation Function[/C][/ROW]
[ROW][C]Time lag k[/C][C]PACF(k)[/C][C]T-STAT[/C][C]P-value[/C][/ROW]
[ROW][C]1[/C][C]0.022792[/C][C]0.1612[/C][C]0.436306[/C][/ROW]
[ROW][C]2[/C][C]0.065151[/C][C]0.4607[/C][C]0.32351[/C][/ROW]
[ROW][C]3[/C][C]-0.09078[/C][C]-0.6419[/C][C]0.261931[/C][/ROW]
[ROW][C]4[/C][C]0.178752[/C][C]1.264[/C][C]0.106051[/C][/ROW]
[ROW][C]5[/C][C]-0.045637[/C][C]-0.3227[/C][C]0.374132[/C][/ROW]
[ROW][C]6[/C][C]-0.066215[/C][C]-0.4682[/C][C]0.320833[/C][/ROW]
[ROW][C]7[/C][C]-0.08944[/C][C]-0.6324[/C][C]0.264992[/C][/ROW]
[ROW][C]8[/C][C]-0.265139[/C][C]-1.8748[/C][C]0.033333[/C][/ROW]
[ROW][C]9[/C][C]-0.065621[/C][C]-0.464[/C][C]0.322327[/C][/ROW]
[ROW][C]10[/C][C]-0.169641[/C][C]-1.1995[/C][C]0.117985[/C][/ROW]
[ROW][C]11[/C][C]-0.025367[/C][C]-0.1794[/C][C]0.429186[/C][/ROW]
[ROW][C]12[/C][C]-0.05938[/C][C]-0.4199[/C][C]0.338186[/C][/ROW]
[ROW][C]13[/C][C]-0.119124[/C][C]-0.8423[/C][C]0.201806[/C][/ROW]
[ROW][C]14[/C][C]-0.033321[/C][C]-0.2356[/C][C]0.407348[/C][/ROW]
[ROW][C]15[/C][C]-0.009054[/C][C]-0.064[/C][C]0.474605[/C][/ROW]
[ROW][C]16[/C][C]0.069131[/C][C]0.4888[/C][C]0.31355[/C][/ROW]
[ROW][C]17[/C][C]0.08112[/C][C]0.5736[/C][C]0.284403[/C][/ROW]
[ROW][C]18[/C][C]0.242172[/C][C]1.7124[/C][C]0.046508[/C][/ROW]
[ROW][C]19[/C][C]-0.254058[/C][C]-1.7965[/C][C]0.039232[/C][/ROW]
[ROW][C]20[/C][C]-0.062583[/C][C]-0.4425[/C][C]0.330009[/C][/ROW]
[ROW][C]21[/C][C]0.022779[/C][C]0.1611[/C][C]0.436343[/C][/ROW]
[ROW][C]22[/C][C]0.045913[/C][C]0.3247[/C][C]0.373397[/C][/ROW]
[ROW][C]23[/C][C]-0.032604[/C][C]-0.2305[/C][C]0.409304[/C][/ROW]
[ROW][C]24[/C][C]-0.105041[/C][C]-0.7428[/C][C]0.230553[/C][/ROW]
[ROW][C]25[/C][C]0.04047[/C][C]0.2862[/C][C]0.387965[/C][/ROW]
[ROW][C]26[/C][C]0.015169[/C][C]0.1073[/C][C]0.457506[/C][/ROW]
[ROW][C]27[/C][C]-0.132664[/C][C]-0.9381[/C][C]0.176358[/C][/ROW]
[ROW][C]28[/C][C]0.05469[/C][C]0.3867[/C][C]0.350304[/C][/ROW]
[ROW][C]29[/C][C]-0.011399[/C][C]-0.0806[/C][C]0.46804[/C][/ROW]
[ROW][C]30[/C][C]-0.009311[/C][C]-0.0658[/C][C]0.473884[/C][/ROW]
[ROW][C]31[/C][C]-0.014847[/C][C]-0.105[/C][C]0.458405[/C][/ROW]
[ROW][C]32[/C][C]-0.012117[/C][C]-0.0857[/C][C]0.466032[/C][/ROW]
[ROW][C]33[/C][C]-0.052722[/C][C]-0.3728[/C][C]0.355436[/C][/ROW]
[ROW][C]34[/C][C]-0.109512[/C][C]-0.7744[/C][C]0.221179[/C][/ROW]
[ROW][C]35[/C][C]-0.050585[/C][C]-0.3577[/C][C]0.36104[/C][/ROW]
[ROW][C]36[/C][C]-0.091362[/C][C]-0.646[/C][C]0.260607[/C][/ROW]
[ROW][C]37[/C][C]-0.014508[/C][C]-0.1026[/C][C]0.45935[/C][/ROW]
[ROW][C]38[/C][C]-0.137164[/C][C]-0.9699[/C][C]0.168384[/C][/ROW]
[ROW][C]39[/C][C]-0.021415[/C][C]-0.1514[/C][C]0.440125[/C][/ROW]
[ROW][C]40[/C][C]-0.026738[/C][C]-0.1891[/C][C]0.425404[/C][/ROW]
[ROW][C]41[/C][C]0.04986[/C][C]0.3526[/C][C]0.362949[/C][/ROW]
[ROW][C]42[/C][C]0.049133[/C][C]0.3474[/C][C]0.364866[/C][/ROW]
[ROW][C]43[/C][C]-0.112442[/C][C]-0.7951[/C][C]0.215161[/C][/ROW]
[ROW][C]44[/C][C]-0.019984[/C][C]-0.1413[/C][C]0.444098[/C][/ROW]
[ROW][C]45[/C][C]0.080679[/C][C]0.5705[/C][C]0.28545[/C][/ROW]
[ROW][C]46[/C][C]-0.075685[/C][C]-0.5352[/C][C]0.297451[/C][/ROW]
[ROW][C]47[/C][C]-0.012217[/C][C]-0.0864[/C][C]0.465751[/C][/ROW]
[ROW][C]48[/C][C]-0.055141[/C][C]-0.3899[/C][C]0.349131[/C][/ROW]
[/TABLE]
Source: https://freestatistics.org/blog/index.php?pk=296903&T=2

Globally Unique Identifier (entire table): ba.freestatistics.org/blog/index.php?pk=296903&T=2

As an alternative you can also use a QR Code:  

The GUIDs for individual cells are displayed in the table below:

Partial Autocorrelation Function
Time lag kPACF(k)T-STATP-value
10.0227920.16120.436306
20.0651510.46070.32351
3-0.09078-0.64190.261931
40.1787521.2640.106051
5-0.045637-0.32270.374132
6-0.066215-0.46820.320833
7-0.08944-0.63240.264992
8-0.265139-1.87480.033333
9-0.065621-0.4640.322327
10-0.169641-1.19950.117985
11-0.025367-0.17940.429186
12-0.05938-0.41990.338186
13-0.119124-0.84230.201806
14-0.033321-0.23560.407348
15-0.009054-0.0640.474605
160.0691310.48880.31355
170.081120.57360.284403
180.2421721.71240.046508
19-0.254058-1.79650.039232
20-0.062583-0.44250.330009
210.0227790.16110.436343
220.0459130.32470.373397
23-0.032604-0.23050.409304
24-0.105041-0.74280.230553
250.040470.28620.387965
260.0151690.10730.457506
27-0.132664-0.93810.176358
280.054690.38670.350304
29-0.011399-0.08060.46804
30-0.009311-0.06580.473884
31-0.014847-0.1050.458405
32-0.012117-0.08570.466032
33-0.052722-0.37280.355436
34-0.109512-0.77440.221179
35-0.050585-0.35770.36104
36-0.091362-0.6460.260607
37-0.014508-0.10260.45935
38-0.137164-0.96990.168384
39-0.021415-0.15140.440125
40-0.026738-0.18910.425404
410.049860.35260.362949
420.0491330.34740.364866
43-0.112442-0.79510.215161
44-0.019984-0.14130.444098
450.0806790.57050.28545
46-0.075685-0.53520.297451
47-0.012217-0.08640.465751
48-0.055141-0.38990.349131


Parameters (Session):
Parameters (R input):
par1 = 48 ; par2 = 1 ; par3 = 0 ; par4 = 0 ; par5 = 12 ; par6 = White Noise ; par7 = 0.95 ; par8 = ;
R code (references can be found in the software module):
par8 <- ''
par7 <- '0.95'
par6 <- 'White Noise'
par5 <- '12'
par4 <- '0'
par3 <- '1'
par2 <- '1'
par1 <- '48'
if (par1 == 'Default') {
par1 = 10*log10(length(x))
} else {
par1 <- as.numeric(par1)
}
par2 <- as.numeric(par2)
par3 <- as.numeric(par3)
par4 <- as.numeric(par4)
par5 <- as.numeric(par5)
if (par6 == 'White Noise') par6 <- 'white' else par6 <- 'ma'
par7 <- as.numeric(par7)
if (par8 != '') par8 <- as.numeric(par8)
x <- na.omit(x)
ox <- x
if (par8 == '') {
if (par2 == 0) {
x <- log(x)
} else {
x <- (x ^ par2 - 1) / par2
}
} else {
x <- log(x,base=par8)
}
if (par3 > 0) x <- diff(x,lag=1,difference=par3)
if (par4 > 0) x <- diff(x,lag=par5,difference=par4)
bitmap(file='picts.png')
op <- par(mfrow=c(2,1))
plot(ox,type='l',main='Original Time Series',xlab='time',ylab='value')
if (par8=='') {
mytitle <- paste('Working Time Series (lambda=',par2,', d=',par3,', D=',par4,')',sep='')
mysub <- paste('(lambda=',par2,', d=',par3,', D=',par4,', CI=', par7, ', CI type=',par6,')',sep='')
} else {
mytitle <- paste('Working Time Series (base=',par8,', d=',par3,', D=',par4,')',sep='')
mysub <- paste('(base=',par8,', d=',par3,', D=',par4,', CI=', par7, ', CI type=',par6,')',sep='')
}
plot(x,type='l', main=mytitle,xlab='time',ylab='value')
par(op)
dev.off()
bitmap(file='pic1.png')
racf <- acf(x, par1, main='Autocorrelation', xlab='time lag', ylab='ACF', ci.type=par6, ci=par7, sub=mysub)
dev.off()
bitmap(file='pic2.png')
rpacf <- pacf(x,par1,main='Partial Autocorrelation',xlab='lags',ylab='PACF',sub=mysub)
dev.off()
(myacf <- c(racf$acf))
(mypacf <- c(rpacf$acf))
lengthx <- length(x)
sqrtn <- sqrt(lengthx)
load(file='createtable')
a<-table.start()
a<-table.row.start(a)
a<-table.element(a,'Autocorrelation Function',4,TRUE)
a<-table.row.end(a)
a<-table.row.start(a)
a<-table.element(a,'Time lag k',header=TRUE)
a<-table.element(a,'ACF(k)',header=TRUE)
a<-table.element(a,'T-STAT',header=TRUE)
a<-table.element(a,'P-value',header=TRUE)
a<-table.row.end(a)
for (i in 2:(par1+1)) {
a<-table.row.start(a)
a<-table.element(a,i-1,header=TRUE)
a<-table.element(a,round(myacf[i],6))
mytstat <- myacf[i]*sqrtn
a<-table.element(a,round(mytstat,4))
a<-table.element(a,round(1-pt(abs(mytstat),lengthx),6))
a<-table.row.end(a)
}
a<-table.end(a)
table.save(a,file='mytable.tab')
a<-table.start()
a<-table.row.start(a)
a<-table.element(a,'Partial Autocorrelation Function',4,TRUE)
a<-table.row.end(a)
a<-table.row.start(a)
a<-table.element(a,'Time lag k',header=TRUE)
a<-table.element(a,'PACF(k)',header=TRUE)
a<-table.element(a,'T-STAT',header=TRUE)
a<-table.element(a,'P-value',header=TRUE)
a<-table.row.end(a)
for (i in 1:par1) {
a<-table.row.start(a)
a<-table.element(a,i,header=TRUE)
a<-table.element(a,round(mypacf[i],6))
mytstat <- mypacf[i]*sqrtn
a<-table.element(a,round(mytstat,4))
a<-table.element(a,round(1-pt(abs(mytstat),lengthx),6))
a<-table.row.end(a)
}
a<-table.end(a)
table.save(a,file='mytable1.tab')