Free Statistics

of Irreproducible Research!

Author's title

Author*Unverified author*
R Software Modulerwasp_decompose.wasp
Title produced by softwareClassical Decomposition
Date of computationThu, 24 Nov 2016 15:30:59 +0000
Cite this page as followsStatistical Computations at FreeStatistics.org, Office for Research Development and Education, URL https://freestatistics.org/blog/index.php?v=date/2016/Nov/24/t14800014680oztsc2i93v6qcv.htm/, Retrieved Wed, 08 May 2024 00:54:00 +0200
Statistical Computations at FreeStatistics.org, Office for Research Development and Education, URL https://freestatistics.org/blog/index.php?pk=, Retrieved Wed, 08 May 2024 00:54:00 +0200
QR Codes:

Original text written by user:
IsPrivate?No (this computation is public)
User-defined keywords
Estimated Impact0
Dataseries X:
70
65
62
58
55
67
64
60
71
71
73
69
81
84
84
80
76
87
83
78
87
85
81
78
87
89
88
84
82
91
93
90
100
98
95
89
99
100
99
94
86
90
86
82
86
84
82
80
86
80
79
78
73
80
79
74
82
81
76
69


Summary of computational transaction
Raw Inputview raw input (R code)
Raw Outputview raw output of R engine
Computing time2 seconds
R Server'Herman Ole Andreas Wold' @ wold.wessa.net

\begin{tabular}{lllllllll}
\hline
Summary of computational transaction \tabularnewline
Raw Input & view raw input (R code)  \tabularnewline
Raw Output & view raw output of R engine  \tabularnewline
Computing time & 2 seconds \tabularnewline
R Server & 'Herman Ole Andreas Wold' @ wold.wessa.net \tabularnewline
\hline
\end{tabular}
%Source: https://freestatistics.org/blog/index.php?pk=&T=0

[TABLE]
[ROW][C]Summary of computational transaction[/C][/ROW]
[ROW][C]Raw Input[/C][C]view raw input (R code) [/C][/ROW]
[ROW][C]Raw Output[/C][C]view raw output of R engine [/C][/ROW]
[ROW][C]Computing time[/C][C]2 seconds[/C][/ROW]
[ROW][C]R Server[/C][C]'Herman Ole Andreas Wold' @ wold.wessa.net[/C][/ROW]
[/TABLE]
Source: https://freestatistics.org/blog/index.php?pk=&T=0

Globally Unique Identifier (entire table): ba.freestatistics.org/blog/index.php?pk=&T=0

As an alternative you can also use a QR Code:  

The GUIDs for individual cells are displayed in the table below:

Summary of computational transaction
Raw Inputview raw input (R code)
Raw Outputview raw output of R engine
Computing time2 seconds
R Server'Herman Ole Andreas Wold' @ wold.wessa.net


Classical Decomposition by Moving Averages
tObservationsFitTrendSeasonalRandom
170NANA4.15972NA
265NANA3.85764NA
362NANA2.84722NA
458NANA-0.871528NA
555NANA-5.75694NA
667NANA1.96181NA
76465.336865.875-0.538194-1.33681
86062.263967.125-4.86111-2.26389
97172.138968.83333.30556-1.13889
107172.086870.66671.42014-1.08681
117371.732672.4583-0.7256941.26736
126969.368174.1667-4.79861-0.368056
138179.951475.79174.159721.04861
148481.19177.33333.857642.80903
158481.597278.752.847222.40278
168079.128580-0.8715280.871528
177675.159780.9167-5.756940.840278
188783.586881.6251.961813.41319
198381.711882.25-0.5381941.28819
207877.847282.7083-4.861110.152778
218786.388983.08333.305560.611111
228584.836883.41671.420140.163194
238183.107683.8333-0.725694-2.10764
247879.451484.25-4.79861-1.45139
258788.993184.83334.15972-1.99306
268989.607685.753.85764-0.607639
278889.638986.79172.84722-1.63889
288487.003587.875-0.871528-3.00347
298283.243189-5.75694-1.24306
309192.003590.04171.96181-1.00347
319390.461891-0.5381942.53819
329087.097291.9583-4.861112.90278
3310096.180692.8753.305563.81944
349895.170193.751.420142.82986
359593.607694.3333-0.7256941.39236
368989.659794.4583-4.79861-0.659722
379998.284794.1254.159720.715278
3810097.357693.53.857642.64236
399995.430692.58332.847223.56944
409490.545191.4167-0.8715283.45486
418684.534790.2917-5.756941.46528
429091.336889.3751.96181-1.33681
438687.920188.4583-0.538194-1.92014
448282.222287.0833-4.86111-0.222222
458688.722285.41673.30556-2.72222
468485.336883.91671.42014-1.33681
478281.982682.7083-0.7256940.0173611
488076.951481.75-4.798613.04861
498685.201481.04174.159720.798611
508084.274380.41673.85764-4.27431
517982.763979.91672.84722-3.76389
527878.753579.625-0.871528-0.753472
537373.493179.25-5.75694-0.493056
548080.503578.54171.96181-0.503472
5579NANA-0.538194NA
5674NANA-4.86111NA
5782NANA3.30556NA
5881NANA1.42014NA
5976NANA-0.725694NA
6069NANA-4.79861NA

\begin{tabular}{lllllllll}
\hline
Classical Decomposition by Moving Averages \tabularnewline
t & Observations & Fit & Trend & Seasonal & Random \tabularnewline
1 & 70 & NA & NA & 4.15972 & NA \tabularnewline
2 & 65 & NA & NA & 3.85764 & NA \tabularnewline
3 & 62 & NA & NA & 2.84722 & NA \tabularnewline
4 & 58 & NA & NA & -0.871528 & NA \tabularnewline
5 & 55 & NA & NA & -5.75694 & NA \tabularnewline
6 & 67 & NA & NA & 1.96181 & NA \tabularnewline
7 & 64 & 65.3368 & 65.875 & -0.538194 & -1.33681 \tabularnewline
8 & 60 & 62.2639 & 67.125 & -4.86111 & -2.26389 \tabularnewline
9 & 71 & 72.1389 & 68.8333 & 3.30556 & -1.13889 \tabularnewline
10 & 71 & 72.0868 & 70.6667 & 1.42014 & -1.08681 \tabularnewline
11 & 73 & 71.7326 & 72.4583 & -0.725694 & 1.26736 \tabularnewline
12 & 69 & 69.3681 & 74.1667 & -4.79861 & -0.368056 \tabularnewline
13 & 81 & 79.9514 & 75.7917 & 4.15972 & 1.04861 \tabularnewline
14 & 84 & 81.191 & 77.3333 & 3.85764 & 2.80903 \tabularnewline
15 & 84 & 81.5972 & 78.75 & 2.84722 & 2.40278 \tabularnewline
16 & 80 & 79.1285 & 80 & -0.871528 & 0.871528 \tabularnewline
17 & 76 & 75.1597 & 80.9167 & -5.75694 & 0.840278 \tabularnewline
18 & 87 & 83.5868 & 81.625 & 1.96181 & 3.41319 \tabularnewline
19 & 83 & 81.7118 & 82.25 & -0.538194 & 1.28819 \tabularnewline
20 & 78 & 77.8472 & 82.7083 & -4.86111 & 0.152778 \tabularnewline
21 & 87 & 86.3889 & 83.0833 & 3.30556 & 0.611111 \tabularnewline
22 & 85 & 84.8368 & 83.4167 & 1.42014 & 0.163194 \tabularnewline
23 & 81 & 83.1076 & 83.8333 & -0.725694 & -2.10764 \tabularnewline
24 & 78 & 79.4514 & 84.25 & -4.79861 & -1.45139 \tabularnewline
25 & 87 & 88.9931 & 84.8333 & 4.15972 & -1.99306 \tabularnewline
26 & 89 & 89.6076 & 85.75 & 3.85764 & -0.607639 \tabularnewline
27 & 88 & 89.6389 & 86.7917 & 2.84722 & -1.63889 \tabularnewline
28 & 84 & 87.0035 & 87.875 & -0.871528 & -3.00347 \tabularnewline
29 & 82 & 83.2431 & 89 & -5.75694 & -1.24306 \tabularnewline
30 & 91 & 92.0035 & 90.0417 & 1.96181 & -1.00347 \tabularnewline
31 & 93 & 90.4618 & 91 & -0.538194 & 2.53819 \tabularnewline
32 & 90 & 87.0972 & 91.9583 & -4.86111 & 2.90278 \tabularnewline
33 & 100 & 96.1806 & 92.875 & 3.30556 & 3.81944 \tabularnewline
34 & 98 & 95.1701 & 93.75 & 1.42014 & 2.82986 \tabularnewline
35 & 95 & 93.6076 & 94.3333 & -0.725694 & 1.39236 \tabularnewline
36 & 89 & 89.6597 & 94.4583 & -4.79861 & -0.659722 \tabularnewline
37 & 99 & 98.2847 & 94.125 & 4.15972 & 0.715278 \tabularnewline
38 & 100 & 97.3576 & 93.5 & 3.85764 & 2.64236 \tabularnewline
39 & 99 & 95.4306 & 92.5833 & 2.84722 & 3.56944 \tabularnewline
40 & 94 & 90.5451 & 91.4167 & -0.871528 & 3.45486 \tabularnewline
41 & 86 & 84.5347 & 90.2917 & -5.75694 & 1.46528 \tabularnewline
42 & 90 & 91.3368 & 89.375 & 1.96181 & -1.33681 \tabularnewline
43 & 86 & 87.9201 & 88.4583 & -0.538194 & -1.92014 \tabularnewline
44 & 82 & 82.2222 & 87.0833 & -4.86111 & -0.222222 \tabularnewline
45 & 86 & 88.7222 & 85.4167 & 3.30556 & -2.72222 \tabularnewline
46 & 84 & 85.3368 & 83.9167 & 1.42014 & -1.33681 \tabularnewline
47 & 82 & 81.9826 & 82.7083 & -0.725694 & 0.0173611 \tabularnewline
48 & 80 & 76.9514 & 81.75 & -4.79861 & 3.04861 \tabularnewline
49 & 86 & 85.2014 & 81.0417 & 4.15972 & 0.798611 \tabularnewline
50 & 80 & 84.2743 & 80.4167 & 3.85764 & -4.27431 \tabularnewline
51 & 79 & 82.7639 & 79.9167 & 2.84722 & -3.76389 \tabularnewline
52 & 78 & 78.7535 & 79.625 & -0.871528 & -0.753472 \tabularnewline
53 & 73 & 73.4931 & 79.25 & -5.75694 & -0.493056 \tabularnewline
54 & 80 & 80.5035 & 78.5417 & 1.96181 & -0.503472 \tabularnewline
55 & 79 & NA & NA & -0.538194 & NA \tabularnewline
56 & 74 & NA & NA & -4.86111 & NA \tabularnewline
57 & 82 & NA & NA & 3.30556 & NA \tabularnewline
58 & 81 & NA & NA & 1.42014 & NA \tabularnewline
59 & 76 & NA & NA & -0.725694 & NA \tabularnewline
60 & 69 & NA & NA & -4.79861 & NA \tabularnewline
\hline
\end{tabular}
%Source: https://freestatistics.org/blog/index.php?pk=&T=1

[TABLE]
[ROW][C]Classical Decomposition by Moving Averages[/C][/ROW]
[ROW][C]t[/C][C]Observations[/C][C]Fit[/C][C]Trend[/C][C]Seasonal[/C][C]Random[/C][/ROW]
[ROW][C]1[/C][C]70[/C][C]NA[/C][C]NA[/C][C]4.15972[/C][C]NA[/C][/ROW]
[ROW][C]2[/C][C]65[/C][C]NA[/C][C]NA[/C][C]3.85764[/C][C]NA[/C][/ROW]
[ROW][C]3[/C][C]62[/C][C]NA[/C][C]NA[/C][C]2.84722[/C][C]NA[/C][/ROW]
[ROW][C]4[/C][C]58[/C][C]NA[/C][C]NA[/C][C]-0.871528[/C][C]NA[/C][/ROW]
[ROW][C]5[/C][C]55[/C][C]NA[/C][C]NA[/C][C]-5.75694[/C][C]NA[/C][/ROW]
[ROW][C]6[/C][C]67[/C][C]NA[/C][C]NA[/C][C]1.96181[/C][C]NA[/C][/ROW]
[ROW][C]7[/C][C]64[/C][C]65.3368[/C][C]65.875[/C][C]-0.538194[/C][C]-1.33681[/C][/ROW]
[ROW][C]8[/C][C]60[/C][C]62.2639[/C][C]67.125[/C][C]-4.86111[/C][C]-2.26389[/C][/ROW]
[ROW][C]9[/C][C]71[/C][C]72.1389[/C][C]68.8333[/C][C]3.30556[/C][C]-1.13889[/C][/ROW]
[ROW][C]10[/C][C]71[/C][C]72.0868[/C][C]70.6667[/C][C]1.42014[/C][C]-1.08681[/C][/ROW]
[ROW][C]11[/C][C]73[/C][C]71.7326[/C][C]72.4583[/C][C]-0.725694[/C][C]1.26736[/C][/ROW]
[ROW][C]12[/C][C]69[/C][C]69.3681[/C][C]74.1667[/C][C]-4.79861[/C][C]-0.368056[/C][/ROW]
[ROW][C]13[/C][C]81[/C][C]79.9514[/C][C]75.7917[/C][C]4.15972[/C][C]1.04861[/C][/ROW]
[ROW][C]14[/C][C]84[/C][C]81.191[/C][C]77.3333[/C][C]3.85764[/C][C]2.80903[/C][/ROW]
[ROW][C]15[/C][C]84[/C][C]81.5972[/C][C]78.75[/C][C]2.84722[/C][C]2.40278[/C][/ROW]
[ROW][C]16[/C][C]80[/C][C]79.1285[/C][C]80[/C][C]-0.871528[/C][C]0.871528[/C][/ROW]
[ROW][C]17[/C][C]76[/C][C]75.1597[/C][C]80.9167[/C][C]-5.75694[/C][C]0.840278[/C][/ROW]
[ROW][C]18[/C][C]87[/C][C]83.5868[/C][C]81.625[/C][C]1.96181[/C][C]3.41319[/C][/ROW]
[ROW][C]19[/C][C]83[/C][C]81.7118[/C][C]82.25[/C][C]-0.538194[/C][C]1.28819[/C][/ROW]
[ROW][C]20[/C][C]78[/C][C]77.8472[/C][C]82.7083[/C][C]-4.86111[/C][C]0.152778[/C][/ROW]
[ROW][C]21[/C][C]87[/C][C]86.3889[/C][C]83.0833[/C][C]3.30556[/C][C]0.611111[/C][/ROW]
[ROW][C]22[/C][C]85[/C][C]84.8368[/C][C]83.4167[/C][C]1.42014[/C][C]0.163194[/C][/ROW]
[ROW][C]23[/C][C]81[/C][C]83.1076[/C][C]83.8333[/C][C]-0.725694[/C][C]-2.10764[/C][/ROW]
[ROW][C]24[/C][C]78[/C][C]79.4514[/C][C]84.25[/C][C]-4.79861[/C][C]-1.45139[/C][/ROW]
[ROW][C]25[/C][C]87[/C][C]88.9931[/C][C]84.8333[/C][C]4.15972[/C][C]-1.99306[/C][/ROW]
[ROW][C]26[/C][C]89[/C][C]89.6076[/C][C]85.75[/C][C]3.85764[/C][C]-0.607639[/C][/ROW]
[ROW][C]27[/C][C]88[/C][C]89.6389[/C][C]86.7917[/C][C]2.84722[/C][C]-1.63889[/C][/ROW]
[ROW][C]28[/C][C]84[/C][C]87.0035[/C][C]87.875[/C][C]-0.871528[/C][C]-3.00347[/C][/ROW]
[ROW][C]29[/C][C]82[/C][C]83.2431[/C][C]89[/C][C]-5.75694[/C][C]-1.24306[/C][/ROW]
[ROW][C]30[/C][C]91[/C][C]92.0035[/C][C]90.0417[/C][C]1.96181[/C][C]-1.00347[/C][/ROW]
[ROW][C]31[/C][C]93[/C][C]90.4618[/C][C]91[/C][C]-0.538194[/C][C]2.53819[/C][/ROW]
[ROW][C]32[/C][C]90[/C][C]87.0972[/C][C]91.9583[/C][C]-4.86111[/C][C]2.90278[/C][/ROW]
[ROW][C]33[/C][C]100[/C][C]96.1806[/C][C]92.875[/C][C]3.30556[/C][C]3.81944[/C][/ROW]
[ROW][C]34[/C][C]98[/C][C]95.1701[/C][C]93.75[/C][C]1.42014[/C][C]2.82986[/C][/ROW]
[ROW][C]35[/C][C]95[/C][C]93.6076[/C][C]94.3333[/C][C]-0.725694[/C][C]1.39236[/C][/ROW]
[ROW][C]36[/C][C]89[/C][C]89.6597[/C][C]94.4583[/C][C]-4.79861[/C][C]-0.659722[/C][/ROW]
[ROW][C]37[/C][C]99[/C][C]98.2847[/C][C]94.125[/C][C]4.15972[/C][C]0.715278[/C][/ROW]
[ROW][C]38[/C][C]100[/C][C]97.3576[/C][C]93.5[/C][C]3.85764[/C][C]2.64236[/C][/ROW]
[ROW][C]39[/C][C]99[/C][C]95.4306[/C][C]92.5833[/C][C]2.84722[/C][C]3.56944[/C][/ROW]
[ROW][C]40[/C][C]94[/C][C]90.5451[/C][C]91.4167[/C][C]-0.871528[/C][C]3.45486[/C][/ROW]
[ROW][C]41[/C][C]86[/C][C]84.5347[/C][C]90.2917[/C][C]-5.75694[/C][C]1.46528[/C][/ROW]
[ROW][C]42[/C][C]90[/C][C]91.3368[/C][C]89.375[/C][C]1.96181[/C][C]-1.33681[/C][/ROW]
[ROW][C]43[/C][C]86[/C][C]87.9201[/C][C]88.4583[/C][C]-0.538194[/C][C]-1.92014[/C][/ROW]
[ROW][C]44[/C][C]82[/C][C]82.2222[/C][C]87.0833[/C][C]-4.86111[/C][C]-0.222222[/C][/ROW]
[ROW][C]45[/C][C]86[/C][C]88.7222[/C][C]85.4167[/C][C]3.30556[/C][C]-2.72222[/C][/ROW]
[ROW][C]46[/C][C]84[/C][C]85.3368[/C][C]83.9167[/C][C]1.42014[/C][C]-1.33681[/C][/ROW]
[ROW][C]47[/C][C]82[/C][C]81.9826[/C][C]82.7083[/C][C]-0.725694[/C][C]0.0173611[/C][/ROW]
[ROW][C]48[/C][C]80[/C][C]76.9514[/C][C]81.75[/C][C]-4.79861[/C][C]3.04861[/C][/ROW]
[ROW][C]49[/C][C]86[/C][C]85.2014[/C][C]81.0417[/C][C]4.15972[/C][C]0.798611[/C][/ROW]
[ROW][C]50[/C][C]80[/C][C]84.2743[/C][C]80.4167[/C][C]3.85764[/C][C]-4.27431[/C][/ROW]
[ROW][C]51[/C][C]79[/C][C]82.7639[/C][C]79.9167[/C][C]2.84722[/C][C]-3.76389[/C][/ROW]
[ROW][C]52[/C][C]78[/C][C]78.7535[/C][C]79.625[/C][C]-0.871528[/C][C]-0.753472[/C][/ROW]
[ROW][C]53[/C][C]73[/C][C]73.4931[/C][C]79.25[/C][C]-5.75694[/C][C]-0.493056[/C][/ROW]
[ROW][C]54[/C][C]80[/C][C]80.5035[/C][C]78.5417[/C][C]1.96181[/C][C]-0.503472[/C][/ROW]
[ROW][C]55[/C][C]79[/C][C]NA[/C][C]NA[/C][C]-0.538194[/C][C]NA[/C][/ROW]
[ROW][C]56[/C][C]74[/C][C]NA[/C][C]NA[/C][C]-4.86111[/C][C]NA[/C][/ROW]
[ROW][C]57[/C][C]82[/C][C]NA[/C][C]NA[/C][C]3.30556[/C][C]NA[/C][/ROW]
[ROW][C]58[/C][C]81[/C][C]NA[/C][C]NA[/C][C]1.42014[/C][C]NA[/C][/ROW]
[ROW][C]59[/C][C]76[/C][C]NA[/C][C]NA[/C][C]-0.725694[/C][C]NA[/C][/ROW]
[ROW][C]60[/C][C]69[/C][C]NA[/C][C]NA[/C][C]-4.79861[/C][C]NA[/C][/ROW]
[/TABLE]
Source: https://freestatistics.org/blog/index.php?pk=&T=1

Globally Unique Identifier (entire table): ba.freestatistics.org/blog/index.php?pk=&T=1

As an alternative you can also use a QR Code:  

The GUIDs for individual cells are displayed in the table below:

Classical Decomposition by Moving Averages
tObservationsFitTrendSeasonalRandom
170NANA4.15972NA
265NANA3.85764NA
362NANA2.84722NA
458NANA-0.871528NA
555NANA-5.75694NA
667NANA1.96181NA
76465.336865.875-0.538194-1.33681
86062.263967.125-4.86111-2.26389
97172.138968.83333.30556-1.13889
107172.086870.66671.42014-1.08681
117371.732672.4583-0.7256941.26736
126969.368174.1667-4.79861-0.368056
138179.951475.79174.159721.04861
148481.19177.33333.857642.80903
158481.597278.752.847222.40278
168079.128580-0.8715280.871528
177675.159780.9167-5.756940.840278
188783.586881.6251.961813.41319
198381.711882.25-0.5381941.28819
207877.847282.7083-4.861110.152778
218786.388983.08333.305560.611111
228584.836883.41671.420140.163194
238183.107683.8333-0.725694-2.10764
247879.451484.25-4.79861-1.45139
258788.993184.83334.15972-1.99306
268989.607685.753.85764-0.607639
278889.638986.79172.84722-1.63889
288487.003587.875-0.871528-3.00347
298283.243189-5.75694-1.24306
309192.003590.04171.96181-1.00347
319390.461891-0.5381942.53819
329087.097291.9583-4.861112.90278
3310096.180692.8753.305563.81944
349895.170193.751.420142.82986
359593.607694.3333-0.7256941.39236
368989.659794.4583-4.79861-0.659722
379998.284794.1254.159720.715278
3810097.357693.53.857642.64236
399995.430692.58332.847223.56944
409490.545191.4167-0.8715283.45486
418684.534790.2917-5.756941.46528
429091.336889.3751.96181-1.33681
438687.920188.4583-0.538194-1.92014
448282.222287.0833-4.86111-0.222222
458688.722285.41673.30556-2.72222
468485.336883.91671.42014-1.33681
478281.982682.7083-0.7256940.0173611
488076.951481.75-4.798613.04861
498685.201481.04174.159720.798611
508084.274380.41673.85764-4.27431
517982.763979.91672.84722-3.76389
527878.753579.625-0.871528-0.753472
537373.493179.25-5.75694-0.493056
548080.503578.54171.96181-0.503472
5579NANA-0.538194NA
5674NANA-4.86111NA
5782NANA3.30556NA
5881NANA1.42014NA
5976NANA-0.725694NA
6069NANA-4.79861NA


Parameters (Session):
par1 = additive ; par2 = 12 ;
Parameters (R input):
par1 = additive ; par2 = 12 ;
R code (references can be found in the software module):
par2 <- '12'
par1 <- 'multiplicative'
par2 <- as.numeric(par2)
x <- ts(x,freq=par2)
m <- decompose(x,type=par1)
m$figure
bitmap(file='test1.png')
plot(m)
dev.off()
mylagmax <- length(x)/2
bitmap(file='test2.png')
op <- par(mfrow = c(2,2))
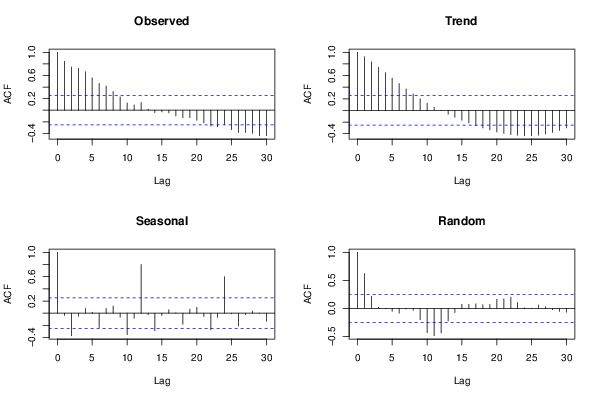
acf(as.numeric(x),lag.max = mylagmax,main='Observed')
acf(as.numeric(m$trend),na.action=na.pass,lag.max = mylagmax,main='Trend')
acf(as.numeric(m$seasonal),na.action=na.pass,lag.max = mylagmax,main='Seasonal')
acf(as.numeric(m$random),na.action=na.pass,lag.max = mylagmax,main='Random')
par(op)
dev.off()
bitmap(file='test3.png')
op <- par(mfrow = c(2,2))
spectrum(as.numeric(x),main='Observed')
spectrum(as.numeric(m$trend[!is.na(m$trend)]),main='Trend')
spectrum(as.numeric(m$seasonal[!is.na(m$seasonal)]),main='Seasonal')
spectrum(as.numeric(m$random[!is.na(m$random)]),main='Random')
par(op)
dev.off()
bitmap(file='test4.png')
op <- par(mfrow = c(2,2))
cpgram(as.numeric(x),main='Observed')
cpgram(as.numeric(m$trend[!is.na(m$trend)]),main='Trend')
cpgram(as.numeric(m$seasonal[!is.na(m$seasonal)]),main='Seasonal')
cpgram(as.numeric(m$random[!is.na(m$random)]),main='Random')
par(op)
dev.off()
load(file='createtable')
a<-table.start()
a<-table.row.start(a)
a<-table.element(a,'Classical Decomposition by Moving Averages',6,TRUE)
a<-table.row.end(a)
a<-table.row.start(a)
a<-table.element(a,'t',header=TRUE)
a<-table.element(a,'Observations',header=TRUE)
a<-table.element(a,'Fit',header=TRUE)
a<-table.element(a,'Trend',header=TRUE)
a<-table.element(a,'Seasonal',header=TRUE)
a<-table.element(a,'Random',header=TRUE)
a<-table.row.end(a)
for (i in 1:length(m$trend)) {
a<-table.row.start(a)
a<-table.element(a,i,header=TRUE)
a<-table.element(a,x[i])
if (par1 == 'additive') a<-table.element(a,signif(m$trend[i]+m$seasonal[i],6)) else a<-table.element(a,signif(m$trend[i]*m$seasonal[i],6))
a<-table.element(a,signif(m$trend[i],6))
a<-table.element(a,signif(m$seasonal[i],6))
a<-table.element(a,signif(m$random[i],6))
a<-table.row.end(a)
}
a<-table.end(a)
table.save(a,file='mytable.tab')