Free Statistics

of Irreproducible Research!

Author's title

Author*Unverified author*
R Software Modulerwasp_decompose.wasp
Title produced by softwareClassical Decomposition
Date of computationThu, 24 Nov 2016 17:29:13 +0000
Cite this page as followsStatistical Computations at FreeStatistics.org, Office for Research Development and Education, URL https://freestatistics.org/blog/index.php?v=date/2016/Nov/24/t1480008644f1fgp28mgevfn1z.htm/, Retrieved Wed, 08 May 2024 01:56:31 +0200
Statistical Computations at FreeStatistics.org, Office for Research Development and Education, URL https://freestatistics.org/blog/index.php?pk=, Retrieved Wed, 08 May 2024 01:56:31 +0200
QR Codes:

Original text written by user:
IsPrivate?No (this computation is public)
User-defined keywords
Estimated Impact0
Dataseries X:
99.6
96.1
109
99.5
104.6
99.9
94.1
105.3
110.4
110.5
110
108.5
101.5
99
106.2
97.6
103.7
103.4
99.9
105
103.4
117.8
110.6
102
105.1
98.5
104.4
103.9
105.8
100.3
106.3
101.4
104.3
114.6
105
103.4
102.9
96.4
102.6
104.7
100.8
102.1
101.1
98.1
109.2
114.4
104
107.2
101.3
98.1
109.6
105.9
99.5
109.9
105.3
102.5
111.9
118
112.1
113.8


Summary of computational transaction
Raw Inputview raw input (R code)
Raw Outputview raw output of R engine
Computing time2 seconds
R Server'Gertrude Mary Cox' @ cox.wessa.net

\begin{tabular}{lllllllll}
\hline
Summary of computational transaction \tabularnewline
Raw Input & view raw input (R code)  \tabularnewline
Raw Output & view raw output of R engine  \tabularnewline
Computing time & 2 seconds \tabularnewline
R Server & 'Gertrude Mary Cox' @ cox.wessa.net \tabularnewline
\hline
\end{tabular}
%Source: https://freestatistics.org/blog/index.php?pk=&T=0

[TABLE]
[ROW][C]Summary of computational transaction[/C][/ROW]
[ROW][C]Raw Input[/C][C]view raw input (R code) [/C][/ROW]
[ROW][C]Raw Output[/C][C]view raw output of R engine [/C][/ROW]
[ROW][C]Computing time[/C][C]2 seconds[/C][/ROW]
[ROW][C]R Server[/C][C]'Gertrude Mary Cox' @ cox.wessa.net[/C][/ROW]
[/TABLE]
Source: https://freestatistics.org/blog/index.php?pk=&T=0

Globally Unique Identifier (entire table): ba.freestatistics.org/blog/index.php?pk=&T=0

As an alternative you can also use a QR Code:  

The GUIDs for individual cells are displayed in the table below:

Summary of computational transaction
Raw Inputview raw input (R code)
Raw Outputview raw output of R engine
Computing time2 seconds
R Server'Gertrude Mary Cox' @ cox.wessa.net


Classical Decomposition by Moving Averages
tObservationsFitTrendSeasonalRandom
199.6NANA-1.75243NA
296.1NANA-6.53993NA
3109NANA1.17361NA
499.5NANA-1.59514NA
5104.6NANA-2.27014NA
699.9NANA-0.872222NA
794.1100.359104.038-3.67847-6.25903
8105.3102.62104.238-1.617012.67951
9110.4106.973104.2422.73093.42743
10110.5114.204104.04610.158-3.70382
11110107.149103.9293.219442.85139
12108.5105.081104.0381.04343.4191
13101.5102.673104.425-1.75243-1.17257
149998.1142104.654-6.539930.885764
15106.2105.524104.351.173610.676389
1697.6102.767104.363-1.59514-5.16736
17103.7102.422104.692-2.270141.27847
18103.4103.574104.446-0.872222-0.173611
1999.9100.647104.325-3.67847-0.746528
20105102.837104.454-1.617012.16285
21103.4107.089104.3582.7309-3.68924
22117.8114.704104.54610.1583.09618
23110.6108.115104.8963.219442.48472
24102105.898104.8541.0434-3.89757
25105.1103.239104.992-1.752431.86076
2698.598.5684105.108-6.53993-0.0684028
27104.4106.169104.9961.17361-1.76944
28103.9103.305104.9-1.595140.595139
29105.8102.263104.533-2.270143.53681
30100.3103.486104.358-0.872222-3.18611
31106.3100.647104.325-3.678475.65347
32101.4102.529104.146-1.61701-1.12882
33104.3106.714103.9832.7309-2.41424
34114.6114.1103.94210.1580.500347
35105106.986103.7673.21944-1.98611
36103.4104.677103.6331.0434-1.27674
37102.9101.739103.492-1.752431.16076
3896.496.5976103.137-6.53993-0.197569
39102.6104.378103.2041.17361-1.77778
40104.7101.805103.4-1.595142.89514
41100.8101.08103.35-2.27014-0.279861
42102.1102.594103.467-0.872222-0.494444
43101.199.8799103.558-3.678471.22014
4498.1101.945103.562-1.61701-3.84549
45109.2106.656103.9252.73092.5441
46114.4114.425104.26710.158-0.0246528
47104107.482104.2623.21944-3.48194
48107.2105.577104.5331.04341.62326
49101.3103.281105.033-1.75243-1.9809
5098.198.8517105.392-6.53993-0.751736
51109.6106.861105.6881.173612.73889
52105.9104.355105.95-1.595141.54514
5399.5104.167106.437-2.27014-4.66736
54109.9106.178107.05-0.8722223.72222
55105.3NANA-3.67847NA
56102.5NANA-1.61701NA
57111.9NANA2.7309NA
58118NANA10.158NA
59112.1NANA3.21944NA
60113.8NANA1.0434NA

\begin{tabular}{lllllllll}
\hline
Classical Decomposition by Moving Averages \tabularnewline
t & Observations & Fit & Trend & Seasonal & Random \tabularnewline
1 & 99.6 & NA & NA & -1.75243 & NA \tabularnewline
2 & 96.1 & NA & NA & -6.53993 & NA \tabularnewline
3 & 109 & NA & NA & 1.17361 & NA \tabularnewline
4 & 99.5 & NA & NA & -1.59514 & NA \tabularnewline
5 & 104.6 & NA & NA & -2.27014 & NA \tabularnewline
6 & 99.9 & NA & NA & -0.872222 & NA \tabularnewline
7 & 94.1 & 100.359 & 104.038 & -3.67847 & -6.25903 \tabularnewline
8 & 105.3 & 102.62 & 104.238 & -1.61701 & 2.67951 \tabularnewline
9 & 110.4 & 106.973 & 104.242 & 2.7309 & 3.42743 \tabularnewline
10 & 110.5 & 114.204 & 104.046 & 10.158 & -3.70382 \tabularnewline
11 & 110 & 107.149 & 103.929 & 3.21944 & 2.85139 \tabularnewline
12 & 108.5 & 105.081 & 104.038 & 1.0434 & 3.4191 \tabularnewline
13 & 101.5 & 102.673 & 104.425 & -1.75243 & -1.17257 \tabularnewline
14 & 99 & 98.1142 & 104.654 & -6.53993 & 0.885764 \tabularnewline
15 & 106.2 & 105.524 & 104.35 & 1.17361 & 0.676389 \tabularnewline
16 & 97.6 & 102.767 & 104.363 & -1.59514 & -5.16736 \tabularnewline
17 & 103.7 & 102.422 & 104.692 & -2.27014 & 1.27847 \tabularnewline
18 & 103.4 & 103.574 & 104.446 & -0.872222 & -0.173611 \tabularnewline
19 & 99.9 & 100.647 & 104.325 & -3.67847 & -0.746528 \tabularnewline
20 & 105 & 102.837 & 104.454 & -1.61701 & 2.16285 \tabularnewline
21 & 103.4 & 107.089 & 104.358 & 2.7309 & -3.68924 \tabularnewline
22 & 117.8 & 114.704 & 104.546 & 10.158 & 3.09618 \tabularnewline
23 & 110.6 & 108.115 & 104.896 & 3.21944 & 2.48472 \tabularnewline
24 & 102 & 105.898 & 104.854 & 1.0434 & -3.89757 \tabularnewline
25 & 105.1 & 103.239 & 104.992 & -1.75243 & 1.86076 \tabularnewline
26 & 98.5 & 98.5684 & 105.108 & -6.53993 & -0.0684028 \tabularnewline
27 & 104.4 & 106.169 & 104.996 & 1.17361 & -1.76944 \tabularnewline
28 & 103.9 & 103.305 & 104.9 & -1.59514 & 0.595139 \tabularnewline
29 & 105.8 & 102.263 & 104.533 & -2.27014 & 3.53681 \tabularnewline
30 & 100.3 & 103.486 & 104.358 & -0.872222 & -3.18611 \tabularnewline
31 & 106.3 & 100.647 & 104.325 & -3.67847 & 5.65347 \tabularnewline
32 & 101.4 & 102.529 & 104.146 & -1.61701 & -1.12882 \tabularnewline
33 & 104.3 & 106.714 & 103.983 & 2.7309 & -2.41424 \tabularnewline
34 & 114.6 & 114.1 & 103.942 & 10.158 & 0.500347 \tabularnewline
35 & 105 & 106.986 & 103.767 & 3.21944 & -1.98611 \tabularnewline
36 & 103.4 & 104.677 & 103.633 & 1.0434 & -1.27674 \tabularnewline
37 & 102.9 & 101.739 & 103.492 & -1.75243 & 1.16076 \tabularnewline
38 & 96.4 & 96.5976 & 103.137 & -6.53993 & -0.197569 \tabularnewline
39 & 102.6 & 104.378 & 103.204 & 1.17361 & -1.77778 \tabularnewline
40 & 104.7 & 101.805 & 103.4 & -1.59514 & 2.89514 \tabularnewline
41 & 100.8 & 101.08 & 103.35 & -2.27014 & -0.279861 \tabularnewline
42 & 102.1 & 102.594 & 103.467 & -0.872222 & -0.494444 \tabularnewline
43 & 101.1 & 99.8799 & 103.558 & -3.67847 & 1.22014 \tabularnewline
44 & 98.1 & 101.945 & 103.562 & -1.61701 & -3.84549 \tabularnewline
45 & 109.2 & 106.656 & 103.925 & 2.7309 & 2.5441 \tabularnewline
46 & 114.4 & 114.425 & 104.267 & 10.158 & -0.0246528 \tabularnewline
47 & 104 & 107.482 & 104.262 & 3.21944 & -3.48194 \tabularnewline
48 & 107.2 & 105.577 & 104.533 & 1.0434 & 1.62326 \tabularnewline
49 & 101.3 & 103.281 & 105.033 & -1.75243 & -1.9809 \tabularnewline
50 & 98.1 & 98.8517 & 105.392 & -6.53993 & -0.751736 \tabularnewline
51 & 109.6 & 106.861 & 105.688 & 1.17361 & 2.73889 \tabularnewline
52 & 105.9 & 104.355 & 105.95 & -1.59514 & 1.54514 \tabularnewline
53 & 99.5 & 104.167 & 106.437 & -2.27014 & -4.66736 \tabularnewline
54 & 109.9 & 106.178 & 107.05 & -0.872222 & 3.72222 \tabularnewline
55 & 105.3 & NA & NA & -3.67847 & NA \tabularnewline
56 & 102.5 & NA & NA & -1.61701 & NA \tabularnewline
57 & 111.9 & NA & NA & 2.7309 & NA \tabularnewline
58 & 118 & NA & NA & 10.158 & NA \tabularnewline
59 & 112.1 & NA & NA & 3.21944 & NA \tabularnewline
60 & 113.8 & NA & NA & 1.0434 & NA \tabularnewline
\hline
\end{tabular}
%Source: https://freestatistics.org/blog/index.php?pk=&T=1

[TABLE]
[ROW][C]Classical Decomposition by Moving Averages[/C][/ROW]
[ROW][C]t[/C][C]Observations[/C][C]Fit[/C][C]Trend[/C][C]Seasonal[/C][C]Random[/C][/ROW]
[ROW][C]1[/C][C]99.6[/C][C]NA[/C][C]NA[/C][C]-1.75243[/C][C]NA[/C][/ROW]
[ROW][C]2[/C][C]96.1[/C][C]NA[/C][C]NA[/C][C]-6.53993[/C][C]NA[/C][/ROW]
[ROW][C]3[/C][C]109[/C][C]NA[/C][C]NA[/C][C]1.17361[/C][C]NA[/C][/ROW]
[ROW][C]4[/C][C]99.5[/C][C]NA[/C][C]NA[/C][C]-1.59514[/C][C]NA[/C][/ROW]
[ROW][C]5[/C][C]104.6[/C][C]NA[/C][C]NA[/C][C]-2.27014[/C][C]NA[/C][/ROW]
[ROW][C]6[/C][C]99.9[/C][C]NA[/C][C]NA[/C][C]-0.872222[/C][C]NA[/C][/ROW]
[ROW][C]7[/C][C]94.1[/C][C]100.359[/C][C]104.038[/C][C]-3.67847[/C][C]-6.25903[/C][/ROW]
[ROW][C]8[/C][C]105.3[/C][C]102.62[/C][C]104.238[/C][C]-1.61701[/C][C]2.67951[/C][/ROW]
[ROW][C]9[/C][C]110.4[/C][C]106.973[/C][C]104.242[/C][C]2.7309[/C][C]3.42743[/C][/ROW]
[ROW][C]10[/C][C]110.5[/C][C]114.204[/C][C]104.046[/C][C]10.158[/C][C]-3.70382[/C][/ROW]
[ROW][C]11[/C][C]110[/C][C]107.149[/C][C]103.929[/C][C]3.21944[/C][C]2.85139[/C][/ROW]
[ROW][C]12[/C][C]108.5[/C][C]105.081[/C][C]104.038[/C][C]1.0434[/C][C]3.4191[/C][/ROW]
[ROW][C]13[/C][C]101.5[/C][C]102.673[/C][C]104.425[/C][C]-1.75243[/C][C]-1.17257[/C][/ROW]
[ROW][C]14[/C][C]99[/C][C]98.1142[/C][C]104.654[/C][C]-6.53993[/C][C]0.885764[/C][/ROW]
[ROW][C]15[/C][C]106.2[/C][C]105.524[/C][C]104.35[/C][C]1.17361[/C][C]0.676389[/C][/ROW]
[ROW][C]16[/C][C]97.6[/C][C]102.767[/C][C]104.363[/C][C]-1.59514[/C][C]-5.16736[/C][/ROW]
[ROW][C]17[/C][C]103.7[/C][C]102.422[/C][C]104.692[/C][C]-2.27014[/C][C]1.27847[/C][/ROW]
[ROW][C]18[/C][C]103.4[/C][C]103.574[/C][C]104.446[/C][C]-0.872222[/C][C]-0.173611[/C][/ROW]
[ROW][C]19[/C][C]99.9[/C][C]100.647[/C][C]104.325[/C][C]-3.67847[/C][C]-0.746528[/C][/ROW]
[ROW][C]20[/C][C]105[/C][C]102.837[/C][C]104.454[/C][C]-1.61701[/C][C]2.16285[/C][/ROW]
[ROW][C]21[/C][C]103.4[/C][C]107.089[/C][C]104.358[/C][C]2.7309[/C][C]-3.68924[/C][/ROW]
[ROW][C]22[/C][C]117.8[/C][C]114.704[/C][C]104.546[/C][C]10.158[/C][C]3.09618[/C][/ROW]
[ROW][C]23[/C][C]110.6[/C][C]108.115[/C][C]104.896[/C][C]3.21944[/C][C]2.48472[/C][/ROW]
[ROW][C]24[/C][C]102[/C][C]105.898[/C][C]104.854[/C][C]1.0434[/C][C]-3.89757[/C][/ROW]
[ROW][C]25[/C][C]105.1[/C][C]103.239[/C][C]104.992[/C][C]-1.75243[/C][C]1.86076[/C][/ROW]
[ROW][C]26[/C][C]98.5[/C][C]98.5684[/C][C]105.108[/C][C]-6.53993[/C][C]-0.0684028[/C][/ROW]
[ROW][C]27[/C][C]104.4[/C][C]106.169[/C][C]104.996[/C][C]1.17361[/C][C]-1.76944[/C][/ROW]
[ROW][C]28[/C][C]103.9[/C][C]103.305[/C][C]104.9[/C][C]-1.59514[/C][C]0.595139[/C][/ROW]
[ROW][C]29[/C][C]105.8[/C][C]102.263[/C][C]104.533[/C][C]-2.27014[/C][C]3.53681[/C][/ROW]
[ROW][C]30[/C][C]100.3[/C][C]103.486[/C][C]104.358[/C][C]-0.872222[/C][C]-3.18611[/C][/ROW]
[ROW][C]31[/C][C]106.3[/C][C]100.647[/C][C]104.325[/C][C]-3.67847[/C][C]5.65347[/C][/ROW]
[ROW][C]32[/C][C]101.4[/C][C]102.529[/C][C]104.146[/C][C]-1.61701[/C][C]-1.12882[/C][/ROW]
[ROW][C]33[/C][C]104.3[/C][C]106.714[/C][C]103.983[/C][C]2.7309[/C][C]-2.41424[/C][/ROW]
[ROW][C]34[/C][C]114.6[/C][C]114.1[/C][C]103.942[/C][C]10.158[/C][C]0.500347[/C][/ROW]
[ROW][C]35[/C][C]105[/C][C]106.986[/C][C]103.767[/C][C]3.21944[/C][C]-1.98611[/C][/ROW]
[ROW][C]36[/C][C]103.4[/C][C]104.677[/C][C]103.633[/C][C]1.0434[/C][C]-1.27674[/C][/ROW]
[ROW][C]37[/C][C]102.9[/C][C]101.739[/C][C]103.492[/C][C]-1.75243[/C][C]1.16076[/C][/ROW]
[ROW][C]38[/C][C]96.4[/C][C]96.5976[/C][C]103.137[/C][C]-6.53993[/C][C]-0.197569[/C][/ROW]
[ROW][C]39[/C][C]102.6[/C][C]104.378[/C][C]103.204[/C][C]1.17361[/C][C]-1.77778[/C][/ROW]
[ROW][C]40[/C][C]104.7[/C][C]101.805[/C][C]103.4[/C][C]-1.59514[/C][C]2.89514[/C][/ROW]
[ROW][C]41[/C][C]100.8[/C][C]101.08[/C][C]103.35[/C][C]-2.27014[/C][C]-0.279861[/C][/ROW]
[ROW][C]42[/C][C]102.1[/C][C]102.594[/C][C]103.467[/C][C]-0.872222[/C][C]-0.494444[/C][/ROW]
[ROW][C]43[/C][C]101.1[/C][C]99.8799[/C][C]103.558[/C][C]-3.67847[/C][C]1.22014[/C][/ROW]
[ROW][C]44[/C][C]98.1[/C][C]101.945[/C][C]103.562[/C][C]-1.61701[/C][C]-3.84549[/C][/ROW]
[ROW][C]45[/C][C]109.2[/C][C]106.656[/C][C]103.925[/C][C]2.7309[/C][C]2.5441[/C][/ROW]
[ROW][C]46[/C][C]114.4[/C][C]114.425[/C][C]104.267[/C][C]10.158[/C][C]-0.0246528[/C][/ROW]
[ROW][C]47[/C][C]104[/C][C]107.482[/C][C]104.262[/C][C]3.21944[/C][C]-3.48194[/C][/ROW]
[ROW][C]48[/C][C]107.2[/C][C]105.577[/C][C]104.533[/C][C]1.0434[/C][C]1.62326[/C][/ROW]
[ROW][C]49[/C][C]101.3[/C][C]103.281[/C][C]105.033[/C][C]-1.75243[/C][C]-1.9809[/C][/ROW]
[ROW][C]50[/C][C]98.1[/C][C]98.8517[/C][C]105.392[/C][C]-6.53993[/C][C]-0.751736[/C][/ROW]
[ROW][C]51[/C][C]109.6[/C][C]106.861[/C][C]105.688[/C][C]1.17361[/C][C]2.73889[/C][/ROW]
[ROW][C]52[/C][C]105.9[/C][C]104.355[/C][C]105.95[/C][C]-1.59514[/C][C]1.54514[/C][/ROW]
[ROW][C]53[/C][C]99.5[/C][C]104.167[/C][C]106.437[/C][C]-2.27014[/C][C]-4.66736[/C][/ROW]
[ROW][C]54[/C][C]109.9[/C][C]106.178[/C][C]107.05[/C][C]-0.872222[/C][C]3.72222[/C][/ROW]
[ROW][C]55[/C][C]105.3[/C][C]NA[/C][C]NA[/C][C]-3.67847[/C][C]NA[/C][/ROW]
[ROW][C]56[/C][C]102.5[/C][C]NA[/C][C]NA[/C][C]-1.61701[/C][C]NA[/C][/ROW]
[ROW][C]57[/C][C]111.9[/C][C]NA[/C][C]NA[/C][C]2.7309[/C][C]NA[/C][/ROW]
[ROW][C]58[/C][C]118[/C][C]NA[/C][C]NA[/C][C]10.158[/C][C]NA[/C][/ROW]
[ROW][C]59[/C][C]112.1[/C][C]NA[/C][C]NA[/C][C]3.21944[/C][C]NA[/C][/ROW]
[ROW][C]60[/C][C]113.8[/C][C]NA[/C][C]NA[/C][C]1.0434[/C][C]NA[/C][/ROW]
[/TABLE]
Source: https://freestatistics.org/blog/index.php?pk=&T=1

Globally Unique Identifier (entire table): ba.freestatistics.org/blog/index.php?pk=&T=1

As an alternative you can also use a QR Code:  

The GUIDs for individual cells are displayed in the table below:

Classical Decomposition by Moving Averages
tObservationsFitTrendSeasonalRandom
199.6NANA-1.75243NA
296.1NANA-6.53993NA
3109NANA1.17361NA
499.5NANA-1.59514NA
5104.6NANA-2.27014NA
699.9NANA-0.872222NA
794.1100.359104.038-3.67847-6.25903
8105.3102.62104.238-1.617012.67951
9110.4106.973104.2422.73093.42743
10110.5114.204104.04610.158-3.70382
11110107.149103.9293.219442.85139
12108.5105.081104.0381.04343.4191
13101.5102.673104.425-1.75243-1.17257
149998.1142104.654-6.539930.885764
15106.2105.524104.351.173610.676389
1697.6102.767104.363-1.59514-5.16736
17103.7102.422104.692-2.270141.27847
18103.4103.574104.446-0.872222-0.173611
1999.9100.647104.325-3.67847-0.746528
20105102.837104.454-1.617012.16285
21103.4107.089104.3582.7309-3.68924
22117.8114.704104.54610.1583.09618
23110.6108.115104.8963.219442.48472
24102105.898104.8541.0434-3.89757
25105.1103.239104.992-1.752431.86076
2698.598.5684105.108-6.53993-0.0684028
27104.4106.169104.9961.17361-1.76944
28103.9103.305104.9-1.595140.595139
29105.8102.263104.533-2.270143.53681
30100.3103.486104.358-0.872222-3.18611
31106.3100.647104.325-3.678475.65347
32101.4102.529104.146-1.61701-1.12882
33104.3106.714103.9832.7309-2.41424
34114.6114.1103.94210.1580.500347
35105106.986103.7673.21944-1.98611
36103.4104.677103.6331.0434-1.27674
37102.9101.739103.492-1.752431.16076
3896.496.5976103.137-6.53993-0.197569
39102.6104.378103.2041.17361-1.77778
40104.7101.805103.4-1.595142.89514
41100.8101.08103.35-2.27014-0.279861
42102.1102.594103.467-0.872222-0.494444
43101.199.8799103.558-3.678471.22014
4498.1101.945103.562-1.61701-3.84549
45109.2106.656103.9252.73092.5441
46114.4114.425104.26710.158-0.0246528
47104107.482104.2623.21944-3.48194
48107.2105.577104.5331.04341.62326
49101.3103.281105.033-1.75243-1.9809
5098.198.8517105.392-6.53993-0.751736
51109.6106.861105.6881.173612.73889
52105.9104.355105.95-1.595141.54514
5399.5104.167106.437-2.27014-4.66736
54109.9106.178107.05-0.8722223.72222
55105.3NANA-3.67847NA
56102.5NANA-1.61701NA
57111.9NANA2.7309NA
58118NANA10.158NA
59112.1NANA3.21944NA
60113.8NANA1.0434NA


Parameters (Session):
par1 = additive ; par2 = 12 ;
Parameters (R input):
par1 = additive ; par2 = 12 ;
R code (references can be found in the software module):
par2 <- as.numeric(par2)
x <- ts(x,freq=par2)
m <- decompose(x,type=par1)
m$figure
bitmap(file='test1.png')
plot(m)
dev.off()
mylagmax <- length(x)/2
bitmap(file='test2.png')
op <- par(mfrow = c(2,2))
acf(as.numeric(x),lag.max = mylagmax,main='Observed')
acf(as.numeric(m$trend),na.action=na.pass,lag.max = mylagmax,main='Trend')
acf(as.numeric(m$seasonal),na.action=na.pass,lag.max = mylagmax,main='Seasonal')
acf(as.numeric(m$random),na.action=na.pass,lag.max = mylagmax,main='Random')
par(op)
dev.off()
bitmap(file='test3.png')
op <- par(mfrow = c(2,2))
spectrum(as.numeric(x),main='Observed')
spectrum(as.numeric(m$trend[!is.na(m$trend)]),main='Trend')
spectrum(as.numeric(m$seasonal[!is.na(m$seasonal)]),main='Seasonal')
spectrum(as.numeric(m$random[!is.na(m$random)]),main='Random')
par(op)
dev.off()
bitmap(file='test4.png')
op <- par(mfrow = c(2,2))
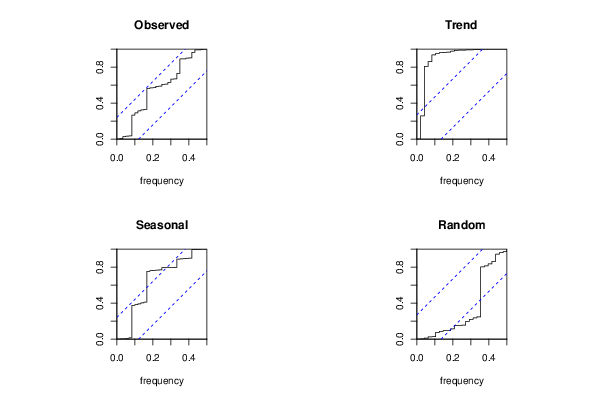
cpgram(as.numeric(x),main='Observed')
cpgram(as.numeric(m$trend[!is.na(m$trend)]),main='Trend')
cpgram(as.numeric(m$seasonal[!is.na(m$seasonal)]),main='Seasonal')
cpgram(as.numeric(m$random[!is.na(m$random)]),main='Random')
par(op)
dev.off()
load(file='createtable')
a<-table.start()
a<-table.row.start(a)
a<-table.element(a,'Classical Decomposition by Moving Averages',6,TRUE)
a<-table.row.end(a)
a<-table.row.start(a)
a<-table.element(a,'t',header=TRUE)
a<-table.element(a,'Observations',header=TRUE)
a<-table.element(a,'Fit',header=TRUE)
a<-table.element(a,'Trend',header=TRUE)
a<-table.element(a,'Seasonal',header=TRUE)
a<-table.element(a,'Random',header=TRUE)
a<-table.row.end(a)
for (i in 1:length(m$trend)) {
a<-table.row.start(a)
a<-table.element(a,i,header=TRUE)
a<-table.element(a,x[i])
if (par1 == 'additive') a<-table.element(a,signif(m$trend[i]+m$seasonal[i],6)) else a<-table.element(a,signif(m$trend[i]*m$seasonal[i],6))
a<-table.element(a,signif(m$trend[i],6))
a<-table.element(a,signif(m$seasonal[i],6))
a<-table.element(a,signif(m$random[i],6))
a<-table.row.end(a)
}
a<-table.end(a)
table.save(a,file='mytable.tab')