Free Statistics

of Irreproducible Research!

Author's title

Author*Unverified author*
R Software Modulerwasp_exponentialsmoothing.wasp
Title produced by softwareExponential Smoothing
Date of computationSat, 26 Nov 2016 10:35:42 +0000
Cite this page as followsStatistical Computations at FreeStatistics.org, Office for Research Development and Education, URL https://freestatistics.org/blog/index.php?v=date/2016/Nov/26/t14801565693dzn61f6888e5gf.htm/, Retrieved Fri, 03 May 2024 22:37:13 +0200
Statistical Computations at FreeStatistics.org, Office for Research Development and Education, URL https://freestatistics.org/blog/index.php?pk=, Retrieved Fri, 03 May 2024 22:37:13 +0200
QR Codes:

Original text written by user:
IsPrivate?No (this computation is public)
User-defined keywords
Estimated Impact0
Dataseries X:
2322
2347
2963
1900
2723
2555
2176
2444
1944
2089
1978
2081
2435
2246
2641
1966
2398
2334
2333
2421
1531
2215
1927
1698
2482
1974
2369
2097
2264
1938
2360
2176
1478
2158
1690
1886
2450
1811
2196
1997
2199
1970
2239
1937
1311
2149
1673
2378
2770
1764
2310
1971
1899
2554
1948
2138
1469
2059
1771
1761


Summary of computational transaction
Raw Inputview raw input (R code)
Raw Outputview raw output of R engine
Computing time2 seconds
R Server'Gwilym Jenkins' @ jenkins.wessa.net

\begin{tabular}{lllllllll}
\hline
Summary of computational transaction \tabularnewline
Raw Input & view raw input (R code)  \tabularnewline
Raw Output & view raw output of R engine  \tabularnewline
Computing time & 2 seconds \tabularnewline
R Server & 'Gwilym Jenkins' @ jenkins.wessa.net \tabularnewline
\hline
\end{tabular}
%Source: https://freestatistics.org/blog/index.php?pk=&T=0

[TABLE]
[ROW][C]Summary of computational transaction[/C][/ROW]
[ROW][C]Raw Input[/C][C]view raw input (R code) [/C][/ROW]
[ROW][C]Raw Output[/C][C]view raw output of R engine [/C][/ROW]
[ROW][C]Computing time[/C][C]2 seconds[/C][/ROW]
[ROW][C]R Server[/C][C]'Gwilym Jenkins' @ jenkins.wessa.net[/C][/ROW]
[/TABLE]
Source: https://freestatistics.org/blog/index.php?pk=&T=0

Globally Unique Identifier (entire table): ba.freestatistics.org/blog/index.php?pk=&T=0

As an alternative you can also use a QR Code:  

The GUIDs for individual cells are displayed in the table below:

Summary of computational transaction
Raw Inputview raw input (R code)
Raw Outputview raw output of R engine
Computing time2 seconds
R Server'Gwilym Jenkins' @ jenkins.wessa.net


Estimated Parameters of Exponential Smoothing
ParameterValue
alpha0.0751015740101936
beta0
gamma0.578274271203508

\begin{tabular}{lllllllll}
\hline
Estimated Parameters of Exponential Smoothing \tabularnewline
Parameter & Value \tabularnewline
alpha & 0.0751015740101936 \tabularnewline
beta & 0 \tabularnewline
gamma & 0.578274271203508 \tabularnewline
\hline
\end{tabular}
%Source: https://freestatistics.org/blog/index.php?pk=&T=1

[TABLE]
[ROW][C]Estimated Parameters of Exponential Smoothing[/C][/ROW]
[ROW][C]Parameter[/C][C]Value[/C][/ROW]
[ROW][C]alpha[/C][C]0.0751015740101936[/C][/ROW]
[ROW][C]beta[/C][C]0[/C][/ROW]
[ROW][C]gamma[/C][C]0.578274271203508[/C][/ROW]
[/TABLE]
Source: https://freestatistics.org/blog/index.php?pk=&T=1

Globally Unique Identifier (entire table): ba.freestatistics.org/blog/index.php?pk=&T=1

As an alternative you can also use a QR Code:  

The GUIDs for individual cells are displayed in the table below:

Estimated Parameters of Exponential Smoothing
ParameterValue
alpha0.0751015740101936
beta0
gamma0.578274271203508


Interpolation Forecasts of Exponential Smoothing
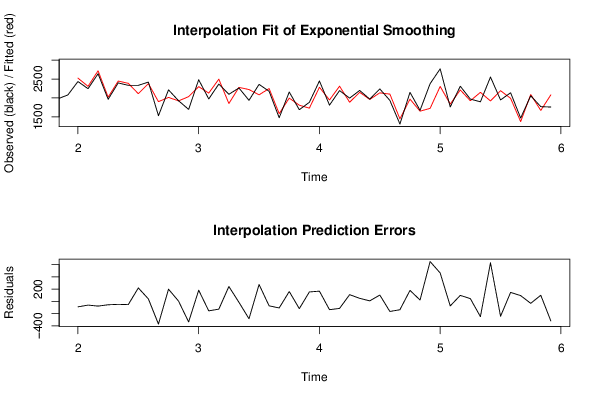
tObservedFittedResiduals
1324352525.04008416018-90.0400841601818
1422462307.41970131212-61.4197013121156
1526412718.55425950743-77.5542595074271
1619662021.80399548131-55.8039954813078
1723982447.09962760237-49.0996276023657
1823342387.61000699045-53.610006990451
1923332113.08082153811219.919178461887
2024212381.1788931569139.8211068430878
2115311902.90036556597-371.900365565967
2222152015.47484338432199.525156615676
2319271923.368171069133.63182893087219
2416982035.48321867652-337.483218676518
2524822299.61897798792182.381022012076
2619742129.51637005521-155.516370055213
2723692496.83740556464-127.837405564639
2820971854.10202289417242.897977105828
2922642279.63594184415-15.6359418441489
3019382222.9643055296-284.964305529599
3123602083.96796689748276.032033102518
3221762249.43245543146-73.4324554314626
3314781586.29802082978-108.29802082978
3421581996.95244496102161.047555038981
3516901809.38168377988-119.381683779877
3618861731.74867001151154.25132998849
3724502283.03749961872166.962500381278
3818111947.6136187689-136.613618768902
3921962311.55211258703-115.552112587027
4019971887.24167428886109.758325711144
4121992149.6058994799249.3941005200768
4219701962.147493827727.85250617228257
4322392135.66948559442103.330514405577
4419372102.71380447817-165.713804478171
4513111448.43747558748-137.43747558748
4621491969.54252055328179.457479446716
4716731651.3520664479721.6479335520332
4823781725.99194669329652.008053306711
4927702305.45079034689464.549209653112
5017641838.99699137626-74.9969913762579
5123102212.0291178199297.9708821800796
5219711926.774008805844.2259911942037
5318992149.02354636762-250.023546367621
5425541921.49034444112632.509655558883
5519482193.0357907806-245.035790780599
5621381991.41292804686146.587071953137
5714691374.943502110994.0564978890984
5820592091.32941080316-32.3294108031596
5917711670.87598081657100.124019183433
6017612082.34865614248-321.348656142477

\begin{tabular}{lllllllll}
\hline
Interpolation Forecasts of Exponential Smoothing \tabularnewline
t & Observed & Fitted & Residuals \tabularnewline
13 & 2435 & 2525.04008416018 & -90.0400841601818 \tabularnewline
14 & 2246 & 2307.41970131212 & -61.4197013121156 \tabularnewline
15 & 2641 & 2718.55425950743 & -77.5542595074271 \tabularnewline
16 & 1966 & 2021.80399548131 & -55.8039954813078 \tabularnewline
17 & 2398 & 2447.09962760237 & -49.0996276023657 \tabularnewline
18 & 2334 & 2387.61000699045 & -53.610006990451 \tabularnewline
19 & 2333 & 2113.08082153811 & 219.919178461887 \tabularnewline
20 & 2421 & 2381.17889315691 & 39.8211068430878 \tabularnewline
21 & 1531 & 1902.90036556597 & -371.900365565967 \tabularnewline
22 & 2215 & 2015.47484338432 & 199.525156615676 \tabularnewline
23 & 1927 & 1923.36817106913 & 3.63182893087219 \tabularnewline
24 & 1698 & 2035.48321867652 & -337.483218676518 \tabularnewline
25 & 2482 & 2299.61897798792 & 182.381022012076 \tabularnewline
26 & 1974 & 2129.51637005521 & -155.516370055213 \tabularnewline
27 & 2369 & 2496.83740556464 & -127.837405564639 \tabularnewline
28 & 2097 & 1854.10202289417 & 242.897977105828 \tabularnewline
29 & 2264 & 2279.63594184415 & -15.6359418441489 \tabularnewline
30 & 1938 & 2222.9643055296 & -284.964305529599 \tabularnewline
31 & 2360 & 2083.96796689748 & 276.032033102518 \tabularnewline
32 & 2176 & 2249.43245543146 & -73.4324554314626 \tabularnewline
33 & 1478 & 1586.29802082978 & -108.29802082978 \tabularnewline
34 & 2158 & 1996.95244496102 & 161.047555038981 \tabularnewline
35 & 1690 & 1809.38168377988 & -119.381683779877 \tabularnewline
36 & 1886 & 1731.74867001151 & 154.25132998849 \tabularnewline
37 & 2450 & 2283.03749961872 & 166.962500381278 \tabularnewline
38 & 1811 & 1947.6136187689 & -136.613618768902 \tabularnewline
39 & 2196 & 2311.55211258703 & -115.552112587027 \tabularnewline
40 & 1997 & 1887.24167428886 & 109.758325711144 \tabularnewline
41 & 2199 & 2149.60589947992 & 49.3941005200768 \tabularnewline
42 & 1970 & 1962.14749382772 & 7.85250617228257 \tabularnewline
43 & 2239 & 2135.66948559442 & 103.330514405577 \tabularnewline
44 & 1937 & 2102.71380447817 & -165.713804478171 \tabularnewline
45 & 1311 & 1448.43747558748 & -137.43747558748 \tabularnewline
46 & 2149 & 1969.54252055328 & 179.457479446716 \tabularnewline
47 & 1673 & 1651.35206644797 & 21.6479335520332 \tabularnewline
48 & 2378 & 1725.99194669329 & 652.008053306711 \tabularnewline
49 & 2770 & 2305.45079034689 & 464.549209653112 \tabularnewline
50 & 1764 & 1838.99699137626 & -74.9969913762579 \tabularnewline
51 & 2310 & 2212.02911781992 & 97.9708821800796 \tabularnewline
52 & 1971 & 1926.7740088058 & 44.2259911942037 \tabularnewline
53 & 1899 & 2149.02354636762 & -250.023546367621 \tabularnewline
54 & 2554 & 1921.49034444112 & 632.509655558883 \tabularnewline
55 & 1948 & 2193.0357907806 & -245.035790780599 \tabularnewline
56 & 2138 & 1991.41292804686 & 146.587071953137 \tabularnewline
57 & 1469 & 1374.9435021109 & 94.0564978890984 \tabularnewline
58 & 2059 & 2091.32941080316 & -32.3294108031596 \tabularnewline
59 & 1771 & 1670.87598081657 & 100.124019183433 \tabularnewline
60 & 1761 & 2082.34865614248 & -321.348656142477 \tabularnewline
\hline
\end{tabular}
%Source: https://freestatistics.org/blog/index.php?pk=&T=2

[TABLE]
[ROW][C]Interpolation Forecasts of Exponential Smoothing[/C][/ROW]
[ROW][C]t[/C][C]Observed[/C][C]Fitted[/C][C]Residuals[/C][/ROW]
[ROW][C]13[/C][C]2435[/C][C]2525.04008416018[/C][C]-90.0400841601818[/C][/ROW]
[ROW][C]14[/C][C]2246[/C][C]2307.41970131212[/C][C]-61.4197013121156[/C][/ROW]
[ROW][C]15[/C][C]2641[/C][C]2718.55425950743[/C][C]-77.5542595074271[/C][/ROW]
[ROW][C]16[/C][C]1966[/C][C]2021.80399548131[/C][C]-55.8039954813078[/C][/ROW]
[ROW][C]17[/C][C]2398[/C][C]2447.09962760237[/C][C]-49.0996276023657[/C][/ROW]
[ROW][C]18[/C][C]2334[/C][C]2387.61000699045[/C][C]-53.610006990451[/C][/ROW]
[ROW][C]19[/C][C]2333[/C][C]2113.08082153811[/C][C]219.919178461887[/C][/ROW]
[ROW][C]20[/C][C]2421[/C][C]2381.17889315691[/C][C]39.8211068430878[/C][/ROW]
[ROW][C]21[/C][C]1531[/C][C]1902.90036556597[/C][C]-371.900365565967[/C][/ROW]
[ROW][C]22[/C][C]2215[/C][C]2015.47484338432[/C][C]199.525156615676[/C][/ROW]
[ROW][C]23[/C][C]1927[/C][C]1923.36817106913[/C][C]3.63182893087219[/C][/ROW]
[ROW][C]24[/C][C]1698[/C][C]2035.48321867652[/C][C]-337.483218676518[/C][/ROW]
[ROW][C]25[/C][C]2482[/C][C]2299.61897798792[/C][C]182.381022012076[/C][/ROW]
[ROW][C]26[/C][C]1974[/C][C]2129.51637005521[/C][C]-155.516370055213[/C][/ROW]
[ROW][C]27[/C][C]2369[/C][C]2496.83740556464[/C][C]-127.837405564639[/C][/ROW]
[ROW][C]28[/C][C]2097[/C][C]1854.10202289417[/C][C]242.897977105828[/C][/ROW]
[ROW][C]29[/C][C]2264[/C][C]2279.63594184415[/C][C]-15.6359418441489[/C][/ROW]
[ROW][C]30[/C][C]1938[/C][C]2222.9643055296[/C][C]-284.964305529599[/C][/ROW]
[ROW][C]31[/C][C]2360[/C][C]2083.96796689748[/C][C]276.032033102518[/C][/ROW]
[ROW][C]32[/C][C]2176[/C][C]2249.43245543146[/C][C]-73.4324554314626[/C][/ROW]
[ROW][C]33[/C][C]1478[/C][C]1586.29802082978[/C][C]-108.29802082978[/C][/ROW]
[ROW][C]34[/C][C]2158[/C][C]1996.95244496102[/C][C]161.047555038981[/C][/ROW]
[ROW][C]35[/C][C]1690[/C][C]1809.38168377988[/C][C]-119.381683779877[/C][/ROW]
[ROW][C]36[/C][C]1886[/C][C]1731.74867001151[/C][C]154.25132998849[/C][/ROW]
[ROW][C]37[/C][C]2450[/C][C]2283.03749961872[/C][C]166.962500381278[/C][/ROW]
[ROW][C]38[/C][C]1811[/C][C]1947.6136187689[/C][C]-136.613618768902[/C][/ROW]
[ROW][C]39[/C][C]2196[/C][C]2311.55211258703[/C][C]-115.552112587027[/C][/ROW]
[ROW][C]40[/C][C]1997[/C][C]1887.24167428886[/C][C]109.758325711144[/C][/ROW]
[ROW][C]41[/C][C]2199[/C][C]2149.60589947992[/C][C]49.3941005200768[/C][/ROW]
[ROW][C]42[/C][C]1970[/C][C]1962.14749382772[/C][C]7.85250617228257[/C][/ROW]
[ROW][C]43[/C][C]2239[/C][C]2135.66948559442[/C][C]103.330514405577[/C][/ROW]
[ROW][C]44[/C][C]1937[/C][C]2102.71380447817[/C][C]-165.713804478171[/C][/ROW]
[ROW][C]45[/C][C]1311[/C][C]1448.43747558748[/C][C]-137.43747558748[/C][/ROW]
[ROW][C]46[/C][C]2149[/C][C]1969.54252055328[/C][C]179.457479446716[/C][/ROW]
[ROW][C]47[/C][C]1673[/C][C]1651.35206644797[/C][C]21.6479335520332[/C][/ROW]
[ROW][C]48[/C][C]2378[/C][C]1725.99194669329[/C][C]652.008053306711[/C][/ROW]
[ROW][C]49[/C][C]2770[/C][C]2305.45079034689[/C][C]464.549209653112[/C][/ROW]
[ROW][C]50[/C][C]1764[/C][C]1838.99699137626[/C][C]-74.9969913762579[/C][/ROW]
[ROW][C]51[/C][C]2310[/C][C]2212.02911781992[/C][C]97.9708821800796[/C][/ROW]
[ROW][C]52[/C][C]1971[/C][C]1926.7740088058[/C][C]44.2259911942037[/C][/ROW]
[ROW][C]53[/C][C]1899[/C][C]2149.02354636762[/C][C]-250.023546367621[/C][/ROW]
[ROW][C]54[/C][C]2554[/C][C]1921.49034444112[/C][C]632.509655558883[/C][/ROW]
[ROW][C]55[/C][C]1948[/C][C]2193.0357907806[/C][C]-245.035790780599[/C][/ROW]
[ROW][C]56[/C][C]2138[/C][C]1991.41292804686[/C][C]146.587071953137[/C][/ROW]
[ROW][C]57[/C][C]1469[/C][C]1374.9435021109[/C][C]94.0564978890984[/C][/ROW]
[ROW][C]58[/C][C]2059[/C][C]2091.32941080316[/C][C]-32.3294108031596[/C][/ROW]
[ROW][C]59[/C][C]1771[/C][C]1670.87598081657[/C][C]100.124019183433[/C][/ROW]
[ROW][C]60[/C][C]1761[/C][C]2082.34865614248[/C][C]-321.348656142477[/C][/ROW]
[/TABLE]
Source: https://freestatistics.org/blog/index.php?pk=&T=2

Globally Unique Identifier (entire table): ba.freestatistics.org/blog/index.php?pk=&T=2

As an alternative you can also use a QR Code:  

The GUIDs for individual cells are displayed in the table below:

Interpolation Forecasts of Exponential Smoothing
tObservedFittedResiduals
1324352525.04008416018-90.0400841601818
1422462307.41970131212-61.4197013121156
1526412718.55425950743-77.5542595074271
1619662021.80399548131-55.8039954813078
1723982447.09962760237-49.0996276023657
1823342387.61000699045-53.610006990451
1923332113.08082153811219.919178461887
2024212381.1788931569139.8211068430878
2115311902.90036556597-371.900365565967
2222152015.47484338432199.525156615676
2319271923.368171069133.63182893087219
2416982035.48321867652-337.483218676518
2524822299.61897798792182.381022012076
2619742129.51637005521-155.516370055213
2723692496.83740556464-127.837405564639
2820971854.10202289417242.897977105828
2922642279.63594184415-15.6359418441489
3019382222.9643055296-284.964305529599
3123602083.96796689748276.032033102518
3221762249.43245543146-73.4324554314626
3314781586.29802082978-108.29802082978
3421581996.95244496102161.047555038981
3516901809.38168377988-119.381683779877
3618861731.74867001151154.25132998849
3724502283.03749961872166.962500381278
3818111947.6136187689-136.613618768902
3921962311.55211258703-115.552112587027
4019971887.24167428886109.758325711144
4121992149.6058994799249.3941005200768
4219701962.147493827727.85250617228257
4322392135.66948559442103.330514405577
4419372102.71380447817-165.713804478171
4513111448.43747558748-137.43747558748
4621491969.54252055328179.457479446716
4716731651.3520664479721.6479335520332
4823781725.99194669329652.008053306711
4927702305.45079034689464.549209653112
5017641838.99699137626-74.9969913762579
5123102212.0291178199297.9708821800796
5219711926.774008805844.2259911942037
5318992149.02354636762-250.023546367621
5425541921.49034444112632.509655558883
5519482193.0357907806-245.035790780599
5621381991.41292804686146.587071953137
5714691374.943502110994.0564978890984
5820592091.32941080316-32.3294108031596
5917711670.87598081657100.124019183433
6017612082.34865614248-321.348656142477


Extrapolation Forecasts of Exponential Smoothing
tForecast95% Lower Bound95% Upper Bound
612471.214910475422211.815098082542730.6147228683
621716.671499962611456.315092243421977.02790768179
632167.095217656361903.029736310162431.16069900255
641860.075729600011595.756052388182124.39540681183
651917.087346971591650.352157857172183.82253608601
662161.60104148631890.390478463152432.81160450945
671930.120128928741659.643257747982200.5970001095
681953.935934821851681.132499915942226.73936972777
691337.675426590781070.937137440481604.41371574107
701936.316543548931657.708512711762214.9245743861
711611.033576317071336.751881971471885.31527066268
721774.575605616461666.388092501991882.76311873094

\begin{tabular}{lllllllll}
\hline
Extrapolation Forecasts of Exponential Smoothing \tabularnewline
t & Forecast & 95% Lower Bound & 95% Upper Bound \tabularnewline
61 & 2471.21491047542 & 2211.81509808254 & 2730.6147228683 \tabularnewline
62 & 1716.67149996261 & 1456.31509224342 & 1977.02790768179 \tabularnewline
63 & 2167.09521765636 & 1903.02973631016 & 2431.16069900255 \tabularnewline
64 & 1860.07572960001 & 1595.75605238818 & 2124.39540681183 \tabularnewline
65 & 1917.08734697159 & 1650.35215785717 & 2183.82253608601 \tabularnewline
66 & 2161.6010414863 & 1890.39047846315 & 2432.81160450945 \tabularnewline
67 & 1930.12012892874 & 1659.64325774798 & 2200.5970001095 \tabularnewline
68 & 1953.93593482185 & 1681.13249991594 & 2226.73936972777 \tabularnewline
69 & 1337.67542659078 & 1070.93713744048 & 1604.41371574107 \tabularnewline
70 & 1936.31654354893 & 1657.70851271176 & 2214.9245743861 \tabularnewline
71 & 1611.03357631707 & 1336.75188197147 & 1885.31527066268 \tabularnewline
72 & 1774.57560561646 & 1666.38809250199 & 1882.76311873094 \tabularnewline
\hline
\end{tabular}
%Source: https://freestatistics.org/blog/index.php?pk=&T=3

[TABLE]
[ROW][C]Extrapolation Forecasts of Exponential Smoothing[/C][/ROW]
[ROW][C]t[/C][C]Forecast[/C][C]95% Lower Bound[/C][C]95% Upper Bound[/C][/ROW]
[ROW][C]61[/C][C]2471.21491047542[/C][C]2211.81509808254[/C][C]2730.6147228683[/C][/ROW]
[ROW][C]62[/C][C]1716.67149996261[/C][C]1456.31509224342[/C][C]1977.02790768179[/C][/ROW]
[ROW][C]63[/C][C]2167.09521765636[/C][C]1903.02973631016[/C][C]2431.16069900255[/C][/ROW]
[ROW][C]64[/C][C]1860.07572960001[/C][C]1595.75605238818[/C][C]2124.39540681183[/C][/ROW]
[ROW][C]65[/C][C]1917.08734697159[/C][C]1650.35215785717[/C][C]2183.82253608601[/C][/ROW]
[ROW][C]66[/C][C]2161.6010414863[/C][C]1890.39047846315[/C][C]2432.81160450945[/C][/ROW]
[ROW][C]67[/C][C]1930.12012892874[/C][C]1659.64325774798[/C][C]2200.5970001095[/C][/ROW]
[ROW][C]68[/C][C]1953.93593482185[/C][C]1681.13249991594[/C][C]2226.73936972777[/C][/ROW]
[ROW][C]69[/C][C]1337.67542659078[/C][C]1070.93713744048[/C][C]1604.41371574107[/C][/ROW]
[ROW][C]70[/C][C]1936.31654354893[/C][C]1657.70851271176[/C][C]2214.9245743861[/C][/ROW]
[ROW][C]71[/C][C]1611.03357631707[/C][C]1336.75188197147[/C][C]1885.31527066268[/C][/ROW]
[ROW][C]72[/C][C]1774.57560561646[/C][C]1666.38809250199[/C][C]1882.76311873094[/C][/ROW]
[/TABLE]
Source: https://freestatistics.org/blog/index.php?pk=&T=3

Globally Unique Identifier (entire table): ba.freestatistics.org/blog/index.php?pk=&T=3

As an alternative you can also use a QR Code:  

The GUIDs for individual cells are displayed in the table below:

Extrapolation Forecasts of Exponential Smoothing
tForecast95% Lower Bound95% Upper Bound
612471.214910475422211.815098082542730.6147228683
621716.671499962611456.315092243421977.02790768179
632167.095217656361903.029736310162431.16069900255
641860.075729600011595.756052388182124.39540681183
651917.087346971591650.352157857172183.82253608601
662161.60104148631890.390478463152432.81160450945
671930.120128928741659.643257747982200.5970001095
681953.935934821851681.132499915942226.73936972777
691337.675426590781070.937137440481604.41371574107
701936.316543548931657.708512711762214.9245743861
711611.033576317071336.751881971471885.31527066268
721774.575605616461666.388092501991882.76311873094


Parameters (Session):
par1 = 12 ; par2 = Triple ; par3 = multiplicative ;
Parameters (R input):
par1 = 12 ; par2 = Triple ; par3 = multiplicative ;
R code (references can be found in the software module):
par1 <- as.numeric(par1)
if (par2 == 'Single') K <- 1
if (par2 == 'Double') K <- 2
if (par2 == 'Triple') K <- par1
nx <- length(x)
nxmK <- nx - K
x <- ts(x, frequency = par1)
if (par2 == 'Single') fit <- HoltWinters(x, gamma=F, beta=F)
if (par2 == 'Double') fit <- HoltWinters(x, gamma=F)
if (par2 == 'Triple') fit <- HoltWinters(x, seasonal=par3)
fit
myresid <- x - fit$fitted[,'xhat']
bitmap(file='test1.png')
op <- par(mfrow=c(2,1))
plot(fit,ylab='Observed (black) / Fitted (red)',main='Interpolation Fit of Exponential Smoothing')
plot(myresid,ylab='Residuals',main='Interpolation Prediction Errors')
par(op)
dev.off()
bitmap(file='test2.png')
p <- predict(fit, par1, prediction.interval=TRUE)
np <- length(p[,1])
plot(fit,p,ylab='Observed (black) / Fitted (red)',main='Extrapolation Fit of Exponential Smoothing')
dev.off()
bitmap(file='test3.png')
op <- par(mfrow = c(2,2))
acf(as.numeric(myresid),lag.max = nx/2,main='Residual ACF')
spectrum(myresid,main='Residals Periodogram')
cpgram(myresid,main='Residal Cumulative Periodogram')
qqnorm(myresid,main='Residual Normal QQ Plot')
qqline(myresid)
par(op)
dev.off()
load(file='createtable')
a<-table.start()
a<-table.row.start(a)
a<-table.element(a,'Estimated Parameters of Exponential Smoothing',2,TRUE)
a<-table.row.end(a)
a<-table.row.start(a)
a<-table.element(a,'Parameter',header=TRUE)
a<-table.element(a,'Value',header=TRUE)
a<-table.row.end(a)
a<-table.row.start(a)
a<-table.element(a,'alpha',header=TRUE)
a<-table.element(a,fit$alpha)
a<-table.row.end(a)
a<-table.row.start(a)
a<-table.element(a,'beta',header=TRUE)
a<-table.element(a,fit$beta)
a<-table.row.end(a)
a<-table.row.start(a)
a<-table.element(a,'gamma',header=TRUE)
a<-table.element(a,fit$gamma)
a<-table.row.end(a)
a<-table.end(a)
table.save(a,file='mytable.tab')
a<-table.start()
a<-table.row.start(a)
a<-table.element(a,'Interpolation Forecasts of Exponential Smoothing',4,TRUE)
a<-table.row.end(a)
a<-table.row.start(a)
a<-table.element(a,'t',header=TRUE)
a<-table.element(a,'Observed',header=TRUE)
a<-table.element(a,'Fitted',header=TRUE)
a<-table.element(a,'Residuals',header=TRUE)
a<-table.row.end(a)
for (i in 1:nxmK) {
a<-table.row.start(a)
a<-table.element(a,i+K,header=TRUE)
a<-table.element(a,x[i+K])
a<-table.element(a,fit$fitted[i,'xhat'])
a<-table.element(a,myresid[i])
a<-table.row.end(a)
}
a<-table.end(a)
table.save(a,file='mytable1.tab')
a<-table.start()
a<-table.row.start(a)
a<-table.element(a,'Extrapolation Forecasts of Exponential Smoothing',4,TRUE)
a<-table.row.end(a)
a<-table.row.start(a)
a<-table.element(a,'t',header=TRUE)
a<-table.element(a,'Forecast',header=TRUE)
a<-table.element(a,'95% Lower Bound',header=TRUE)
a<-table.element(a,'95% Upper Bound',header=TRUE)
a<-table.row.end(a)
for (i in 1:np) {
a<-table.row.start(a)
a<-table.element(a,nx+i,header=TRUE)
a<-table.element(a,p[i,'fit'])
a<-table.element(a,p[i,'lwr'])
a<-table.element(a,p[i,'upr'])
a<-table.row.end(a)
}
a<-table.end(a)
table.save(a,file='mytable2.tab')