Free Statistics

of Irreproducible Research!

Author's title

Author*Unverified author*
R Software Modulerwasp_exponentialsmoothing.wasp
Title produced by softwareExponential Smoothing
Date of computationSun, 27 Nov 2016 10:16:23 +0000
Cite this page as followsStatistical Computations at FreeStatistics.org, Office for Research Development and Education, URL https://freestatistics.org/blog/index.php?v=date/2016/Nov/27/t14802419060lx8daud06efaen.htm/, Retrieved Mon, 29 Apr 2024 20:47:44 +0200
Statistical Computations at FreeStatistics.org, Office for Research Development and Education, URL https://freestatistics.org/blog/index.php?pk=, Retrieved Mon, 29 Apr 2024 20:47:44 +0200
QR Codes:

Original text written by user:
IsPrivate?No (this computation is public)
User-defined keywords
Estimated Impact0
Dataseries X:
86,37
86,84
86,73
90,99
92,61
93,83
94,2
94,01
93,47
93,27
94,3
94,53
94,59
94,69
94,67
96,55
97,14
97,32
97,97
98,49
99,11
99,09
98,76
99,2
99,61
99,54
99,68
100,75
100,38
100,79
100,39
100,39
100,12
100
99,17
99,17
99,59
99,96
99,68
101,03
100,99
101,38
101,84
101,52
101,37
101,22
101,45
101,99
104,05
104,61
105,06
105,4
104,71
104,8
104,83
104,81
104,49
104,59
104,5
104,61


Summary of computational transaction
Raw Inputview raw input (R code)
Raw Outputview raw output of R engine
Computing time1 seconds
R Server'Herman Ole Andreas Wold' @ wold.wessa.net

\begin{tabular}{lllllllll}
\hline
Summary of computational transaction \tabularnewline
Raw Input & view raw input (R code)  \tabularnewline
Raw Output & view raw output of R engine  \tabularnewline
Computing time & 1 seconds \tabularnewline
R Server & 'Herman Ole Andreas Wold' @ wold.wessa.net \tabularnewline
\hline
\end{tabular}
%Source: https://freestatistics.org/blog/index.php?pk=&T=0

[TABLE]
[ROW][C]Summary of computational transaction[/C][/ROW]
[ROW][C]Raw Input[/C][C]view raw input (R code) [/C][/ROW]
[ROW][C]Raw Output[/C][C]view raw output of R engine [/C][/ROW]
[ROW][C]Computing time[/C][C]1 seconds[/C][/ROW]
[ROW][C]R Server[/C][C]'Herman Ole Andreas Wold' @ wold.wessa.net[/C][/ROW]
[/TABLE]
Source: https://freestatistics.org/blog/index.php?pk=&T=0

Globally Unique Identifier (entire table): ba.freestatistics.org/blog/index.php?pk=&T=0

As an alternative you can also use a QR Code:  

The GUIDs for individual cells are displayed in the table below:

Summary of computational transaction
Raw Inputview raw input (R code)
Raw Outputview raw output of R engine
Computing time1 seconds
R Server'Herman Ole Andreas Wold' @ wold.wessa.net


Estimated Parameters of Exponential Smoothing
ParameterValue
alpha0.999927492131497
betaFALSE
gammaFALSE

\begin{tabular}{lllllllll}
\hline
Estimated Parameters of Exponential Smoothing \tabularnewline
Parameter & Value \tabularnewline
alpha & 0.999927492131497 \tabularnewline
beta & FALSE \tabularnewline
gamma & FALSE \tabularnewline
\hline
\end{tabular}
%Source: https://freestatistics.org/blog/index.php?pk=&T=1

[TABLE]
[ROW][C]Estimated Parameters of Exponential Smoothing[/C][/ROW]
[ROW][C]Parameter[/C][C]Value[/C][/ROW]
[ROW][C]alpha[/C][C]0.999927492131497[/C][/ROW]
[ROW][C]beta[/C][C]FALSE[/C][/ROW]
[ROW][C]gamma[/C][C]FALSE[/C][/ROW]
[/TABLE]
Source: https://freestatistics.org/blog/index.php?pk=&T=1

Globally Unique Identifier (entire table): ba.freestatistics.org/blog/index.php?pk=&T=1

As an alternative you can also use a QR Code:  

The GUIDs for individual cells are displayed in the table below:

Estimated Parameters of Exponential Smoothing
ParameterValue
alpha0.999927492131497
betaFALSE
gammaFALSE


Interpolation Forecasts of Exponential Smoothing
tObservedFittedResiduals
286.8486.370.469999999999999
386.7386.8399659213018-0.109965921301807
490.9986.73000797339464.25999202660543
592.6190.98969111705831.6203088829417
693.8392.60988251485661.22011748514342
794.293.82991153188180.370088468118183
894.0194.199973165674-0.189973165674019
993.4794.0100137745493-0.540013774549323
1093.2793.4700391552477-0.200039155247751
1194.393.27001450441281.02998549558724
1294.5394.29992531794710.230074682052873
1394.5994.52998331777520.0600166822247843
1494.6994.58999564831830.10000435168169
1594.6794.6899927488976-0.0199927488976215
1696.5594.67000144963161.87999855036838
1797.1496.54986368531230.590136314687683
1897.3297.13995721047370.180042789526297
1997.9797.31998694548110.650013054518922
2098.4997.96995286893890.520047131061077
2199.1198.4899622924910.620037707508999
2299.0999.1099550423874-0.0199550423874371
2398.7699.0900014468976-0.330001446897597
2499.298.76002392770150.439976072298478
2599.6199.19996809827280.410031901727194
2699.5499.6099702694608-0.0699702694607822
2799.6899.54000507339510.139994926604913
28100.7599.67998984926631.07001015073372
29100.38100.749922415845-0.369922415844698
30100.79100.3800268222860.409973177714122
31100.39100.789970273719-0.399970273718736
32100.39100.390029000992-2.90009920149714e-05
33100.12100.390000002103-0.27000000210279
34100100.120019577125-0.120019577124651
3599.17100.000008702364-0.830008702363713
3699.1799.1700601821619-6.01821618602116e-05
3799.5999.17000000436370.419999995636317
3899.9699.58996954669560.370030453304437
3999.6899.9599731698805-0.279973169880535
40101.0399.68002030025781.34997969974221
41100.99101.029902115849-0.0399021158494435
42101.38100.9900028932170.38999710678263
43101.84101.3799717221410.460028277858939
44101.52101.83996664433-0.319966644330123
45101.37101.520023200099-0.150023200099369
46101.22101.370010877862-0.150010877862471
47101.45101.2200108769690.22998912303099
48101.99101.4499833239790.540016676021068
49104.05101.9899608445422.06003915545813
50104.61104.0498506309520.56014936904819
51105.06104.6099593847630.450040615236787
52105.4105.0599673685140.340032631485741
53104.71105.399975344959-0.689975344958683
54104.8104.7100500286420.089949971358422
55104.83104.7999934779190.0300065220806971
56104.81104.829997824291-0.019997824291039
57104.49104.81000145-0.320001449999623
58104.59104.4900232026230.0999767973769536
59104.5104.589992750896-0.0899927508955329
60104.61104.5000065251830.109993474817458

\begin{tabular}{lllllllll}
\hline
Interpolation Forecasts of Exponential Smoothing \tabularnewline
t & Observed & Fitted & Residuals \tabularnewline
2 & 86.84 & 86.37 & 0.469999999999999 \tabularnewline
3 & 86.73 & 86.8399659213018 & -0.109965921301807 \tabularnewline
4 & 90.99 & 86.7300079733946 & 4.25999202660543 \tabularnewline
5 & 92.61 & 90.9896911170583 & 1.6203088829417 \tabularnewline
6 & 93.83 & 92.6098825148566 & 1.22011748514342 \tabularnewline
7 & 94.2 & 93.8299115318818 & 0.370088468118183 \tabularnewline
8 & 94.01 & 94.199973165674 & -0.189973165674019 \tabularnewline
9 & 93.47 & 94.0100137745493 & -0.540013774549323 \tabularnewline
10 & 93.27 & 93.4700391552477 & -0.200039155247751 \tabularnewline
11 & 94.3 & 93.2700145044128 & 1.02998549558724 \tabularnewline
12 & 94.53 & 94.2999253179471 & 0.230074682052873 \tabularnewline
13 & 94.59 & 94.5299833177752 & 0.0600166822247843 \tabularnewline
14 & 94.69 & 94.5899956483183 & 0.10000435168169 \tabularnewline
15 & 94.67 & 94.6899927488976 & -0.0199927488976215 \tabularnewline
16 & 96.55 & 94.6700014496316 & 1.87999855036838 \tabularnewline
17 & 97.14 & 96.5498636853123 & 0.590136314687683 \tabularnewline
18 & 97.32 & 97.1399572104737 & 0.180042789526297 \tabularnewline
19 & 97.97 & 97.3199869454811 & 0.650013054518922 \tabularnewline
20 & 98.49 & 97.9699528689389 & 0.520047131061077 \tabularnewline
21 & 99.11 & 98.489962292491 & 0.620037707508999 \tabularnewline
22 & 99.09 & 99.1099550423874 & -0.0199550423874371 \tabularnewline
23 & 98.76 & 99.0900014468976 & -0.330001446897597 \tabularnewline
24 & 99.2 & 98.7600239277015 & 0.439976072298478 \tabularnewline
25 & 99.61 & 99.1999680982728 & 0.410031901727194 \tabularnewline
26 & 99.54 & 99.6099702694608 & -0.0699702694607822 \tabularnewline
27 & 99.68 & 99.5400050733951 & 0.139994926604913 \tabularnewline
28 & 100.75 & 99.6799898492663 & 1.07001015073372 \tabularnewline
29 & 100.38 & 100.749922415845 & -0.369922415844698 \tabularnewline
30 & 100.79 & 100.380026822286 & 0.409973177714122 \tabularnewline
31 & 100.39 & 100.789970273719 & -0.399970273718736 \tabularnewline
32 & 100.39 & 100.390029000992 & -2.90009920149714e-05 \tabularnewline
33 & 100.12 & 100.390000002103 & -0.27000000210279 \tabularnewline
34 & 100 & 100.120019577125 & -0.120019577124651 \tabularnewline
35 & 99.17 & 100.000008702364 & -0.830008702363713 \tabularnewline
36 & 99.17 & 99.1700601821619 & -6.01821618602116e-05 \tabularnewline
37 & 99.59 & 99.1700000043637 & 0.419999995636317 \tabularnewline
38 & 99.96 & 99.5899695466956 & 0.370030453304437 \tabularnewline
39 & 99.68 & 99.9599731698805 & -0.279973169880535 \tabularnewline
40 & 101.03 & 99.6800203002578 & 1.34997969974221 \tabularnewline
41 & 100.99 & 101.029902115849 & -0.0399021158494435 \tabularnewline
42 & 101.38 & 100.990002893217 & 0.38999710678263 \tabularnewline
43 & 101.84 & 101.379971722141 & 0.460028277858939 \tabularnewline
44 & 101.52 & 101.83996664433 & -0.319966644330123 \tabularnewline
45 & 101.37 & 101.520023200099 & -0.150023200099369 \tabularnewline
46 & 101.22 & 101.370010877862 & -0.150010877862471 \tabularnewline
47 & 101.45 & 101.220010876969 & 0.22998912303099 \tabularnewline
48 & 101.99 & 101.449983323979 & 0.540016676021068 \tabularnewline
49 & 104.05 & 101.989960844542 & 2.06003915545813 \tabularnewline
50 & 104.61 & 104.049850630952 & 0.56014936904819 \tabularnewline
51 & 105.06 & 104.609959384763 & 0.450040615236787 \tabularnewline
52 & 105.4 & 105.059967368514 & 0.340032631485741 \tabularnewline
53 & 104.71 & 105.399975344959 & -0.689975344958683 \tabularnewline
54 & 104.8 & 104.710050028642 & 0.089949971358422 \tabularnewline
55 & 104.83 & 104.799993477919 & 0.0300065220806971 \tabularnewline
56 & 104.81 & 104.829997824291 & -0.019997824291039 \tabularnewline
57 & 104.49 & 104.81000145 & -0.320001449999623 \tabularnewline
58 & 104.59 & 104.490023202623 & 0.0999767973769536 \tabularnewline
59 & 104.5 & 104.589992750896 & -0.0899927508955329 \tabularnewline
60 & 104.61 & 104.500006525183 & 0.109993474817458 \tabularnewline
\hline
\end{tabular}
%Source: https://freestatistics.org/blog/index.php?pk=&T=2

[TABLE]
[ROW][C]Interpolation Forecasts of Exponential Smoothing[/C][/ROW]
[ROW][C]t[/C][C]Observed[/C][C]Fitted[/C][C]Residuals[/C][/ROW]
[ROW][C]2[/C][C]86.84[/C][C]86.37[/C][C]0.469999999999999[/C][/ROW]
[ROW][C]3[/C][C]86.73[/C][C]86.8399659213018[/C][C]-0.109965921301807[/C][/ROW]
[ROW][C]4[/C][C]90.99[/C][C]86.7300079733946[/C][C]4.25999202660543[/C][/ROW]
[ROW][C]5[/C][C]92.61[/C][C]90.9896911170583[/C][C]1.6203088829417[/C][/ROW]
[ROW][C]6[/C][C]93.83[/C][C]92.6098825148566[/C][C]1.22011748514342[/C][/ROW]
[ROW][C]7[/C][C]94.2[/C][C]93.8299115318818[/C][C]0.370088468118183[/C][/ROW]
[ROW][C]8[/C][C]94.01[/C][C]94.199973165674[/C][C]-0.189973165674019[/C][/ROW]
[ROW][C]9[/C][C]93.47[/C][C]94.0100137745493[/C][C]-0.540013774549323[/C][/ROW]
[ROW][C]10[/C][C]93.27[/C][C]93.4700391552477[/C][C]-0.200039155247751[/C][/ROW]
[ROW][C]11[/C][C]94.3[/C][C]93.2700145044128[/C][C]1.02998549558724[/C][/ROW]
[ROW][C]12[/C][C]94.53[/C][C]94.2999253179471[/C][C]0.230074682052873[/C][/ROW]
[ROW][C]13[/C][C]94.59[/C][C]94.5299833177752[/C][C]0.0600166822247843[/C][/ROW]
[ROW][C]14[/C][C]94.69[/C][C]94.5899956483183[/C][C]0.10000435168169[/C][/ROW]
[ROW][C]15[/C][C]94.67[/C][C]94.6899927488976[/C][C]-0.0199927488976215[/C][/ROW]
[ROW][C]16[/C][C]96.55[/C][C]94.6700014496316[/C][C]1.87999855036838[/C][/ROW]
[ROW][C]17[/C][C]97.14[/C][C]96.5498636853123[/C][C]0.590136314687683[/C][/ROW]
[ROW][C]18[/C][C]97.32[/C][C]97.1399572104737[/C][C]0.180042789526297[/C][/ROW]
[ROW][C]19[/C][C]97.97[/C][C]97.3199869454811[/C][C]0.650013054518922[/C][/ROW]
[ROW][C]20[/C][C]98.49[/C][C]97.9699528689389[/C][C]0.520047131061077[/C][/ROW]
[ROW][C]21[/C][C]99.11[/C][C]98.489962292491[/C][C]0.620037707508999[/C][/ROW]
[ROW][C]22[/C][C]99.09[/C][C]99.1099550423874[/C][C]-0.0199550423874371[/C][/ROW]
[ROW][C]23[/C][C]98.76[/C][C]99.0900014468976[/C][C]-0.330001446897597[/C][/ROW]
[ROW][C]24[/C][C]99.2[/C][C]98.7600239277015[/C][C]0.439976072298478[/C][/ROW]
[ROW][C]25[/C][C]99.61[/C][C]99.1999680982728[/C][C]0.410031901727194[/C][/ROW]
[ROW][C]26[/C][C]99.54[/C][C]99.6099702694608[/C][C]-0.0699702694607822[/C][/ROW]
[ROW][C]27[/C][C]99.68[/C][C]99.5400050733951[/C][C]0.139994926604913[/C][/ROW]
[ROW][C]28[/C][C]100.75[/C][C]99.6799898492663[/C][C]1.07001015073372[/C][/ROW]
[ROW][C]29[/C][C]100.38[/C][C]100.749922415845[/C][C]-0.369922415844698[/C][/ROW]
[ROW][C]30[/C][C]100.79[/C][C]100.380026822286[/C][C]0.409973177714122[/C][/ROW]
[ROW][C]31[/C][C]100.39[/C][C]100.789970273719[/C][C]-0.399970273718736[/C][/ROW]
[ROW][C]32[/C][C]100.39[/C][C]100.390029000992[/C][C]-2.90009920149714e-05[/C][/ROW]
[ROW][C]33[/C][C]100.12[/C][C]100.390000002103[/C][C]-0.27000000210279[/C][/ROW]
[ROW][C]34[/C][C]100[/C][C]100.120019577125[/C][C]-0.120019577124651[/C][/ROW]
[ROW][C]35[/C][C]99.17[/C][C]100.000008702364[/C][C]-0.830008702363713[/C][/ROW]
[ROW][C]36[/C][C]99.17[/C][C]99.1700601821619[/C][C]-6.01821618602116e-05[/C][/ROW]
[ROW][C]37[/C][C]99.59[/C][C]99.1700000043637[/C][C]0.419999995636317[/C][/ROW]
[ROW][C]38[/C][C]99.96[/C][C]99.5899695466956[/C][C]0.370030453304437[/C][/ROW]
[ROW][C]39[/C][C]99.68[/C][C]99.9599731698805[/C][C]-0.279973169880535[/C][/ROW]
[ROW][C]40[/C][C]101.03[/C][C]99.6800203002578[/C][C]1.34997969974221[/C][/ROW]
[ROW][C]41[/C][C]100.99[/C][C]101.029902115849[/C][C]-0.0399021158494435[/C][/ROW]
[ROW][C]42[/C][C]101.38[/C][C]100.990002893217[/C][C]0.38999710678263[/C][/ROW]
[ROW][C]43[/C][C]101.84[/C][C]101.379971722141[/C][C]0.460028277858939[/C][/ROW]
[ROW][C]44[/C][C]101.52[/C][C]101.83996664433[/C][C]-0.319966644330123[/C][/ROW]
[ROW][C]45[/C][C]101.37[/C][C]101.520023200099[/C][C]-0.150023200099369[/C][/ROW]
[ROW][C]46[/C][C]101.22[/C][C]101.370010877862[/C][C]-0.150010877862471[/C][/ROW]
[ROW][C]47[/C][C]101.45[/C][C]101.220010876969[/C][C]0.22998912303099[/C][/ROW]
[ROW][C]48[/C][C]101.99[/C][C]101.449983323979[/C][C]0.540016676021068[/C][/ROW]
[ROW][C]49[/C][C]104.05[/C][C]101.989960844542[/C][C]2.06003915545813[/C][/ROW]
[ROW][C]50[/C][C]104.61[/C][C]104.049850630952[/C][C]0.56014936904819[/C][/ROW]
[ROW][C]51[/C][C]105.06[/C][C]104.609959384763[/C][C]0.450040615236787[/C][/ROW]
[ROW][C]52[/C][C]105.4[/C][C]105.059967368514[/C][C]0.340032631485741[/C][/ROW]
[ROW][C]53[/C][C]104.71[/C][C]105.399975344959[/C][C]-0.689975344958683[/C][/ROW]
[ROW][C]54[/C][C]104.8[/C][C]104.710050028642[/C][C]0.089949971358422[/C][/ROW]
[ROW][C]55[/C][C]104.83[/C][C]104.799993477919[/C][C]0.0300065220806971[/C][/ROW]
[ROW][C]56[/C][C]104.81[/C][C]104.829997824291[/C][C]-0.019997824291039[/C][/ROW]
[ROW][C]57[/C][C]104.49[/C][C]104.81000145[/C][C]-0.320001449999623[/C][/ROW]
[ROW][C]58[/C][C]104.59[/C][C]104.490023202623[/C][C]0.0999767973769536[/C][/ROW]
[ROW][C]59[/C][C]104.5[/C][C]104.589992750896[/C][C]-0.0899927508955329[/C][/ROW]
[ROW][C]60[/C][C]104.61[/C][C]104.500006525183[/C][C]0.109993474817458[/C][/ROW]
[/TABLE]
Source: https://freestatistics.org/blog/index.php?pk=&T=2

Globally Unique Identifier (entire table): ba.freestatistics.org/blog/index.php?pk=&T=2

As an alternative you can also use a QR Code:  

The GUIDs for individual cells are displayed in the table below:

Interpolation Forecasts of Exponential Smoothing
tObservedFittedResiduals
286.8486.370.469999999999999
386.7386.8399659213018-0.109965921301807
490.9986.73000797339464.25999202660543
592.6190.98969111705831.6203088829417
693.8392.60988251485661.22011748514342
794.293.82991153188180.370088468118183
894.0194.199973165674-0.189973165674019
993.4794.0100137745493-0.540013774549323
1093.2793.4700391552477-0.200039155247751
1194.393.27001450441281.02998549558724
1294.5394.29992531794710.230074682052873
1394.5994.52998331777520.0600166822247843
1494.6994.58999564831830.10000435168169
1594.6794.6899927488976-0.0199927488976215
1696.5594.67000144963161.87999855036838
1797.1496.54986368531230.590136314687683
1897.3297.13995721047370.180042789526297
1997.9797.31998694548110.650013054518922
2098.4997.96995286893890.520047131061077
2199.1198.4899622924910.620037707508999
2299.0999.1099550423874-0.0199550423874371
2398.7699.0900014468976-0.330001446897597
2499.298.76002392770150.439976072298478
2599.6199.19996809827280.410031901727194
2699.5499.6099702694608-0.0699702694607822
2799.6899.54000507339510.139994926604913
28100.7599.67998984926631.07001015073372
29100.38100.749922415845-0.369922415844698
30100.79100.3800268222860.409973177714122
31100.39100.789970273719-0.399970273718736
32100.39100.390029000992-2.90009920149714e-05
33100.12100.390000002103-0.27000000210279
34100100.120019577125-0.120019577124651
3599.17100.000008702364-0.830008702363713
3699.1799.1700601821619-6.01821618602116e-05
3799.5999.17000000436370.419999995636317
3899.9699.58996954669560.370030453304437
3999.6899.9599731698805-0.279973169880535
40101.0399.68002030025781.34997969974221
41100.99101.029902115849-0.0399021158494435
42101.38100.9900028932170.38999710678263
43101.84101.3799717221410.460028277858939
44101.52101.83996664433-0.319966644330123
45101.37101.520023200099-0.150023200099369
46101.22101.370010877862-0.150010877862471
47101.45101.2200108769690.22998912303099
48101.99101.4499833239790.540016676021068
49104.05101.9899608445422.06003915545813
50104.61104.0498506309520.56014936904819
51105.06104.6099593847630.450040615236787
52105.4105.0599673685140.340032631485741
53104.71105.399975344959-0.689975344958683
54104.8104.7100500286420.089949971358422
55104.83104.7999934779190.0300065220806971
56104.81104.829997824291-0.019997824291039
57104.49104.81000145-0.320001449999623
58104.59104.4900232026230.0999767973769536
59104.5104.589992750896-0.0899927508955329
60104.61104.5000065251830.109993474817458


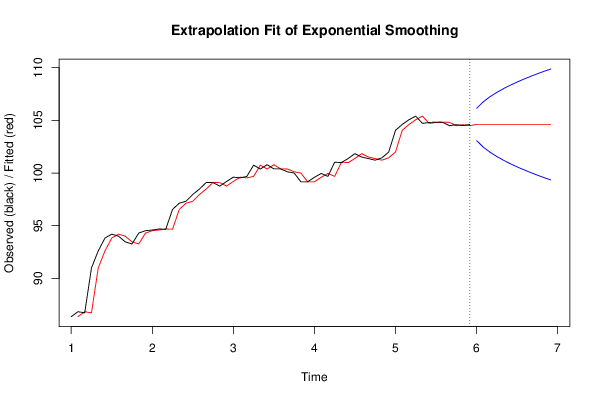
Extrapolation Forecasts of Exponential Smoothing
tForecast95% Lower Bound95% Upper Bound
61104.609992024608103.089054084635106.130929964581
62104.609992024608102.45913894067106.760845108545
63104.609992024608101.975777576215107.244206473
64104.609992024608101.568281563115107.651702486101
65104.609992024608101.209268674643108.010715374572
66104.609992024608100.884695247916108.335288801299
67104.609992024608100.586218566041108.633765483174
68104.609992024608100.308402827892108.911581221323
69104.609992024608100.047472283419109.172511765796
70104.60999202460899.8006778156824109.419306233533
71104.60999202460899.5659440538201109.654039995395
72104.60999202460899.3416586350962109.878325414119

\begin{tabular}{lllllllll}
\hline
Extrapolation Forecasts of Exponential Smoothing \tabularnewline
t & Forecast & 95% Lower Bound & 95% Upper Bound \tabularnewline
61 & 104.609992024608 & 103.089054084635 & 106.130929964581 \tabularnewline
62 & 104.609992024608 & 102.45913894067 & 106.760845108545 \tabularnewline
63 & 104.609992024608 & 101.975777576215 & 107.244206473 \tabularnewline
64 & 104.609992024608 & 101.568281563115 & 107.651702486101 \tabularnewline
65 & 104.609992024608 & 101.209268674643 & 108.010715374572 \tabularnewline
66 & 104.609992024608 & 100.884695247916 & 108.335288801299 \tabularnewline
67 & 104.609992024608 & 100.586218566041 & 108.633765483174 \tabularnewline
68 & 104.609992024608 & 100.308402827892 & 108.911581221323 \tabularnewline
69 & 104.609992024608 & 100.047472283419 & 109.172511765796 \tabularnewline
70 & 104.609992024608 & 99.8006778156824 & 109.419306233533 \tabularnewline
71 & 104.609992024608 & 99.5659440538201 & 109.654039995395 \tabularnewline
72 & 104.609992024608 & 99.3416586350962 & 109.878325414119 \tabularnewline
\hline
\end{tabular}
%Source: https://freestatistics.org/blog/index.php?pk=&T=3

[TABLE]
[ROW][C]Extrapolation Forecasts of Exponential Smoothing[/C][/ROW]
[ROW][C]t[/C][C]Forecast[/C][C]95% Lower Bound[/C][C]95% Upper Bound[/C][/ROW]
[ROW][C]61[/C][C]104.609992024608[/C][C]103.089054084635[/C][C]106.130929964581[/C][/ROW]
[ROW][C]62[/C][C]104.609992024608[/C][C]102.45913894067[/C][C]106.760845108545[/C][/ROW]
[ROW][C]63[/C][C]104.609992024608[/C][C]101.975777576215[/C][C]107.244206473[/C][/ROW]
[ROW][C]64[/C][C]104.609992024608[/C][C]101.568281563115[/C][C]107.651702486101[/C][/ROW]
[ROW][C]65[/C][C]104.609992024608[/C][C]101.209268674643[/C][C]108.010715374572[/C][/ROW]
[ROW][C]66[/C][C]104.609992024608[/C][C]100.884695247916[/C][C]108.335288801299[/C][/ROW]
[ROW][C]67[/C][C]104.609992024608[/C][C]100.586218566041[/C][C]108.633765483174[/C][/ROW]
[ROW][C]68[/C][C]104.609992024608[/C][C]100.308402827892[/C][C]108.911581221323[/C][/ROW]
[ROW][C]69[/C][C]104.609992024608[/C][C]100.047472283419[/C][C]109.172511765796[/C][/ROW]
[ROW][C]70[/C][C]104.609992024608[/C][C]99.8006778156824[/C][C]109.419306233533[/C][/ROW]
[ROW][C]71[/C][C]104.609992024608[/C][C]99.5659440538201[/C][C]109.654039995395[/C][/ROW]
[ROW][C]72[/C][C]104.609992024608[/C][C]99.3416586350962[/C][C]109.878325414119[/C][/ROW]
[/TABLE]
Source: https://freestatistics.org/blog/index.php?pk=&T=3

Globally Unique Identifier (entire table): ba.freestatistics.org/blog/index.php?pk=&T=3

As an alternative you can also use a QR Code:  

The GUIDs for individual cells are displayed in the table below:

Extrapolation Forecasts of Exponential Smoothing
tForecast95% Lower Bound95% Upper Bound
61104.609992024608103.089054084635106.130929964581
62104.609992024608102.45913894067106.760845108545
63104.609992024608101.975777576215107.244206473
64104.609992024608101.568281563115107.651702486101
65104.609992024608101.209268674643108.010715374572
66104.609992024608100.884695247916108.335288801299
67104.609992024608100.586218566041108.633765483174
68104.609992024608100.308402827892108.911581221323
69104.609992024608100.047472283419109.172511765796
70104.60999202460899.8006778156824109.419306233533
71104.60999202460899.5659440538201109.654039995395
72104.60999202460899.3416586350962109.878325414119


Parameters (Session):
par1 = 12 ; par2 = Single ; par3 = additive ;
Parameters (R input):
par1 = 12 ; par2 = Single ; par3 = additive ;
R code (references can be found in the software module):
par1 <- as.numeric(par1)
if (par2 == 'Single') K <- 1
if (par2 == 'Double') K <- 2
if (par2 == 'Triple') K <- par1
nx <- length(x)
nxmK <- nx - K
x <- ts(x, frequency = par1)
if (par2 == 'Single') fit <- HoltWinters(x, gamma=F, beta=F)
if (par2 == 'Double') fit <- HoltWinters(x, gamma=F)
if (par2 == 'Triple') fit <- HoltWinters(x, seasonal=par3)
fit
myresid <- x - fit$fitted[,'xhat']
bitmap(file='test1.png')
op <- par(mfrow=c(2,1))
plot(fit,ylab='Observed (black) / Fitted (red)',main='Interpolation Fit of Exponential Smoothing')
plot(myresid,ylab='Residuals',main='Interpolation Prediction Errors')
par(op)
dev.off()
bitmap(file='test2.png')
p <- predict(fit, par1, prediction.interval=TRUE)
np <- length(p[,1])
plot(fit,p,ylab='Observed (black) / Fitted (red)',main='Extrapolation Fit of Exponential Smoothing')
dev.off()
bitmap(file='test3.png')
op <- par(mfrow = c(2,2))
acf(as.numeric(myresid),lag.max = nx/2,main='Residual ACF')
spectrum(myresid,main='Residals Periodogram')
cpgram(myresid,main='Residal Cumulative Periodogram')
qqnorm(myresid,main='Residual Normal QQ Plot')
qqline(myresid)
par(op)
dev.off()
load(file='createtable')
a<-table.start()
a<-table.row.start(a)
a<-table.element(a,'Estimated Parameters of Exponential Smoothing',2,TRUE)
a<-table.row.end(a)
a<-table.row.start(a)
a<-table.element(a,'Parameter',header=TRUE)
a<-table.element(a,'Value',header=TRUE)
a<-table.row.end(a)
a<-table.row.start(a)
a<-table.element(a,'alpha',header=TRUE)
a<-table.element(a,fit$alpha)
a<-table.row.end(a)
a<-table.row.start(a)
a<-table.element(a,'beta',header=TRUE)
a<-table.element(a,fit$beta)
a<-table.row.end(a)
a<-table.row.start(a)
a<-table.element(a,'gamma',header=TRUE)
a<-table.element(a,fit$gamma)
a<-table.row.end(a)
a<-table.end(a)
table.save(a,file='mytable.tab')
a<-table.start()
a<-table.row.start(a)
a<-table.element(a,'Interpolation Forecasts of Exponential Smoothing',4,TRUE)
a<-table.row.end(a)
a<-table.row.start(a)
a<-table.element(a,'t',header=TRUE)
a<-table.element(a,'Observed',header=TRUE)
a<-table.element(a,'Fitted',header=TRUE)
a<-table.element(a,'Residuals',header=TRUE)
a<-table.row.end(a)
for (i in 1:nxmK) {
a<-table.row.start(a)
a<-table.element(a,i+K,header=TRUE)
a<-table.element(a,x[i+K])
a<-table.element(a,fit$fitted[i,'xhat'])
a<-table.element(a,myresid[i])
a<-table.row.end(a)
}
a<-table.end(a)
table.save(a,file='mytable1.tab')
a<-table.start()
a<-table.row.start(a)
a<-table.element(a,'Extrapolation Forecasts of Exponential Smoothing',4,TRUE)
a<-table.row.end(a)
a<-table.row.start(a)
a<-table.element(a,'t',header=TRUE)
a<-table.element(a,'Forecast',header=TRUE)
a<-table.element(a,'95% Lower Bound',header=TRUE)
a<-table.element(a,'95% Upper Bound',header=TRUE)
a<-table.row.end(a)
for (i in 1:np) {
a<-table.row.start(a)
a<-table.element(a,nx+i,header=TRUE)
a<-table.element(a,p[i,'fit'])
a<-table.element(a,p[i,'lwr'])
a<-table.element(a,p[i,'upr'])
a<-table.row.end(a)
}
a<-table.end(a)
table.save(a,file='mytable2.tab')