Free Statistics

of Irreproducible Research!

Author's title

Author*Unverified author*
R Software Modulerwasp_exponentialsmoothing.wasp
Title produced by softwareExponential Smoothing
Date of computationSun, 27 Nov 2016 11:10:30 +0000
Cite this page as followsStatistical Computations at FreeStatistics.org, Office for Research Development and Education, URL https://freestatistics.org/blog/index.php?v=date/2016/Nov/27/t1480245057wv6ixbppax2ejd9.htm/, Retrieved Mon, 29 Apr 2024 21:20:08 +0200
Statistical Computations at FreeStatistics.org, Office for Research Development and Education, URL https://freestatistics.org/blog/index.php?pk=, Retrieved Mon, 29 Apr 2024 21:20:08 +0200
QR Codes:

Original text written by user:
IsPrivate?No (this computation is public)
User-defined keywords
Estimated Impact0
Dataseries X:
95.9
89.2
100.2
102.3
102.2
100.5
104.1
94.9
97.3
100.3
98
115.1
94.4
91.6
104.1
107.8
101.7
104.1
102
99.9
101.6
101.3
101
115.9
97.5
97.6
109.2
101.6
108.8
108.8
100.9
107.4
101.7
104.5
106.1
116.7
103.7
96.5
114.1
102.8
114.5
107.2
107.9
111.3
99.8
106.7
106.9
115.3
106.1
97.3
109
109.8
116.5
108.3
110.8
108.7
104
111.3
106.5
120.5
110
99.7
109
112.2
116
112.3
113.2
109.9
107.6
114.9
105.7
123.3


Summary of computational transaction
Raw Inputview raw input (R code)
Raw Outputview raw output of R engine
Computing time1 seconds
R Server'George Udny Yule' @ yule.wessa.net

\begin{tabular}{lllllllll}
\hline
Summary of computational transaction \tabularnewline
Raw Input & view raw input (R code)  \tabularnewline
Raw Output & view raw output of R engine  \tabularnewline
Computing time & 1 seconds \tabularnewline
R Server & 'George Udny Yule' @ yule.wessa.net \tabularnewline
\hline
\end{tabular}
%Source: https://freestatistics.org/blog/index.php?pk=&T=0

[TABLE]
[ROW][C]Summary of computational transaction[/C][/ROW]
[ROW][C]Raw Input[/C][C]view raw input (R code) [/C][/ROW]
[ROW][C]Raw Output[/C][C]view raw output of R engine [/C][/ROW]
[ROW][C]Computing time[/C][C]1 seconds[/C][/ROW]
[ROW][C]R Server[/C][C]'George Udny Yule' @ yule.wessa.net[/C][/ROW]
[/TABLE]
Source: https://freestatistics.org/blog/index.php?pk=&T=0

Globally Unique Identifier (entire table): ba.freestatistics.org/blog/index.php?pk=&T=0

As an alternative you can also use a QR Code:  

The GUIDs for individual cells are displayed in the table below:

Summary of computational transaction
Raw Inputview raw input (R code)
Raw Outputview raw output of R engine
Computing time1 seconds
R Server'George Udny Yule' @ yule.wessa.net


Estimated Parameters of Exponential Smoothing
ParameterValue
alpha0.00266550545066502
beta0
gamma1

\begin{tabular}{lllllllll}
\hline
Estimated Parameters of Exponential Smoothing \tabularnewline
Parameter & Value \tabularnewline
alpha & 0.00266550545066502 \tabularnewline
beta & 0 \tabularnewline
gamma & 1 \tabularnewline
\hline
\end{tabular}
%Source: https://freestatistics.org/blog/index.php?pk=&T=1

[TABLE]
[ROW][C]Estimated Parameters of Exponential Smoothing[/C][/ROW]
[ROW][C]Parameter[/C][C]Value[/C][/ROW]
[ROW][C]alpha[/C][C]0.00266550545066502[/C][/ROW]
[ROW][C]beta[/C][C]0[/C][/ROW]
[ROW][C]gamma[/C][C]1[/C][/ROW]
[/TABLE]
Source: https://freestatistics.org/blog/index.php?pk=&T=1

Globally Unique Identifier (entire table): ba.freestatistics.org/blog/index.php?pk=&T=1

As an alternative you can also use a QR Code:  

The GUIDs for individual cells are displayed in the table below:

Estimated Parameters of Exponential Smoothing
ParameterValue
alpha0.00266550545066502
beta0
gamma1


Interpolation Forecasts of Exponential Smoothing
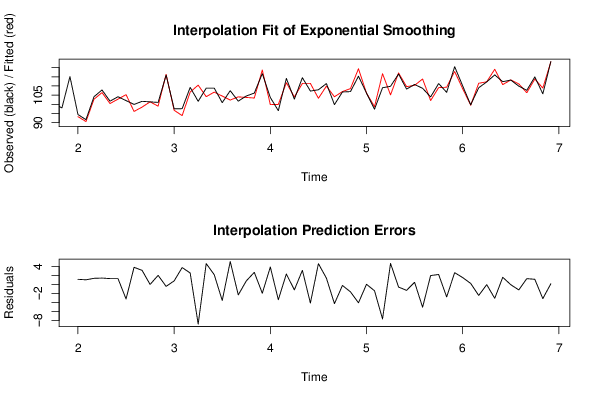
tObservedFittedResiduals
1394.493.25214729932311.14785270067694
1491.690.56244480985911.03755519014086
15104.1102.7365538259291.36344617407069
16107.8106.3731499257741.42685007422614
17101.7100.3932228845471.30677711545265
18104.1102.8108049637891.28919503621117
19102105.230476018688-3.23047601868819
2099.996.07686167296063.82313832703942
21101.698.45349877450243.14650122549762
22101.3101.302297634027-0.00229763402687411
2310198.96946785096292.03053214903707
24115.9116.32460174805-0.42460174805035
2597.596.70430250374590.795697496254064
2697.693.8306648281163.76933517188395
27109.2106.6376239588552.562376041145
28101.6110.425686891911-8.82568689191102
29108.8104.146415002764.65358499723993
30108.8106.608281064982.19171893501967
31100.9104.467070293261-3.5670702932606
32107.4102.2913525702285.10864742977157
33101.7104.032202830454-2.33220283045445
34104.5103.7140625104820.785937489517934
35106.1103.3986093122232.70139068777731
36116.7118.656461981702-1.95646198170176
37103.799.80774270469483.89225729530519
3896.599.9052605519148-3.40526055191484
39114.1111.7569203827882.34307961721173
40102.8104.002289894913-1.20228989491251
41114.5111.3508429869323.14915701306784
42107.2111.348170830133-4.14817083013297
43107.9103.2577361378634.64226386213683
44111.3109.9032876514371.39671234856303
4599.8104.075598079335-4.27559807933481
46106.7106.922456868161-0.222456868160691
47106.9108.546662167426-1.64666216742572
48115.3119.386366840906-4.08636684090563
49106.1106.0618608608380.0381391391618422
5097.398.7027387281705-1.40273872817052
51109116.688583064684-7.68858306468448
52109.8105.1125927148574.68740728514253
53116.5117.07596896076-0.575968960760491
54108.3109.616616228123-1.31661622812338
55110.8110.3110495458180.488950454181904
56108.7113.779815043796-5.079815043796
57104102.0184524035951.98154759640501
58111.3109.0736118260412.22638817395861
59106.5109.283949203132-2.78394920313227
60120.5117.8692214128782.63077858712181
61110108.466132133091.53386786690974
6299.799.47334230145780.226657698542198
63109111.450390819853-2.45039081985253
64112.2112.243872929157-0.0438729291567626
65116119.089620372031-3.08962037203098
66112.3110.6987866421971.60121335780346
67113.2113.252639654221-0.052639654221295
68109.9111.114796364953-1.21479636495289
69107.6106.2975293214221.30247067857771
70114.9113.7517930337471.14820696625257
71105.7108.852060665842-3.15206066584237
72123.3123.1395575066070.160442493393049

\begin{tabular}{lllllllll}
\hline
Interpolation Forecasts of Exponential Smoothing \tabularnewline
t & Observed & Fitted & Residuals \tabularnewline
13 & 94.4 & 93.2521472993231 & 1.14785270067694 \tabularnewline
14 & 91.6 & 90.5624448098591 & 1.03755519014086 \tabularnewline
15 & 104.1 & 102.736553825929 & 1.36344617407069 \tabularnewline
16 & 107.8 & 106.373149925774 & 1.42685007422614 \tabularnewline
17 & 101.7 & 100.393222884547 & 1.30677711545265 \tabularnewline
18 & 104.1 & 102.810804963789 & 1.28919503621117 \tabularnewline
19 & 102 & 105.230476018688 & -3.23047601868819 \tabularnewline
20 & 99.9 & 96.0768616729606 & 3.82313832703942 \tabularnewline
21 & 101.6 & 98.4534987745024 & 3.14650122549762 \tabularnewline
22 & 101.3 & 101.302297634027 & -0.00229763402687411 \tabularnewline
23 & 101 & 98.9694678509629 & 2.03053214903707 \tabularnewline
24 & 115.9 & 116.32460174805 & -0.42460174805035 \tabularnewline
25 & 97.5 & 96.7043025037459 & 0.795697496254064 \tabularnewline
26 & 97.6 & 93.830664828116 & 3.76933517188395 \tabularnewline
27 & 109.2 & 106.637623958855 & 2.562376041145 \tabularnewline
28 & 101.6 & 110.425686891911 & -8.82568689191102 \tabularnewline
29 & 108.8 & 104.14641500276 & 4.65358499723993 \tabularnewline
30 & 108.8 & 106.60828106498 & 2.19171893501967 \tabularnewline
31 & 100.9 & 104.467070293261 & -3.5670702932606 \tabularnewline
32 & 107.4 & 102.291352570228 & 5.10864742977157 \tabularnewline
33 & 101.7 & 104.032202830454 & -2.33220283045445 \tabularnewline
34 & 104.5 & 103.714062510482 & 0.785937489517934 \tabularnewline
35 & 106.1 & 103.398609312223 & 2.70139068777731 \tabularnewline
36 & 116.7 & 118.656461981702 & -1.95646198170176 \tabularnewline
37 & 103.7 & 99.8077427046948 & 3.89225729530519 \tabularnewline
38 & 96.5 & 99.9052605519148 & -3.40526055191484 \tabularnewline
39 & 114.1 & 111.756920382788 & 2.34307961721173 \tabularnewline
40 & 102.8 & 104.002289894913 & -1.20228989491251 \tabularnewline
41 & 114.5 & 111.350842986932 & 3.14915701306784 \tabularnewline
42 & 107.2 & 111.348170830133 & -4.14817083013297 \tabularnewline
43 & 107.9 & 103.257736137863 & 4.64226386213683 \tabularnewline
44 & 111.3 & 109.903287651437 & 1.39671234856303 \tabularnewline
45 & 99.8 & 104.075598079335 & -4.27559807933481 \tabularnewline
46 & 106.7 & 106.922456868161 & -0.222456868160691 \tabularnewline
47 & 106.9 & 108.546662167426 & -1.64666216742572 \tabularnewline
48 & 115.3 & 119.386366840906 & -4.08636684090563 \tabularnewline
49 & 106.1 & 106.061860860838 & 0.0381391391618422 \tabularnewline
50 & 97.3 & 98.7027387281705 & -1.40273872817052 \tabularnewline
51 & 109 & 116.688583064684 & -7.68858306468448 \tabularnewline
52 & 109.8 & 105.112592714857 & 4.68740728514253 \tabularnewline
53 & 116.5 & 117.07596896076 & -0.575968960760491 \tabularnewline
54 & 108.3 & 109.616616228123 & -1.31661622812338 \tabularnewline
55 & 110.8 & 110.311049545818 & 0.488950454181904 \tabularnewline
56 & 108.7 & 113.779815043796 & -5.079815043796 \tabularnewline
57 & 104 & 102.018452403595 & 1.98154759640501 \tabularnewline
58 & 111.3 & 109.073611826041 & 2.22638817395861 \tabularnewline
59 & 106.5 & 109.283949203132 & -2.78394920313227 \tabularnewline
60 & 120.5 & 117.869221412878 & 2.63077858712181 \tabularnewline
61 & 110 & 108.46613213309 & 1.53386786690974 \tabularnewline
62 & 99.7 & 99.4733423014578 & 0.226657698542198 \tabularnewline
63 & 109 & 111.450390819853 & -2.45039081985253 \tabularnewline
64 & 112.2 & 112.243872929157 & -0.0438729291567626 \tabularnewline
65 & 116 & 119.089620372031 & -3.08962037203098 \tabularnewline
66 & 112.3 & 110.698786642197 & 1.60121335780346 \tabularnewline
67 & 113.2 & 113.252639654221 & -0.052639654221295 \tabularnewline
68 & 109.9 & 111.114796364953 & -1.21479636495289 \tabularnewline
69 & 107.6 & 106.297529321422 & 1.30247067857771 \tabularnewline
70 & 114.9 & 113.751793033747 & 1.14820696625257 \tabularnewline
71 & 105.7 & 108.852060665842 & -3.15206066584237 \tabularnewline
72 & 123.3 & 123.139557506607 & 0.160442493393049 \tabularnewline
\hline
\end{tabular}
%Source: https://freestatistics.org/blog/index.php?pk=&T=2

[TABLE]
[ROW][C]Interpolation Forecasts of Exponential Smoothing[/C][/ROW]
[ROW][C]t[/C][C]Observed[/C][C]Fitted[/C][C]Residuals[/C][/ROW]
[ROW][C]13[/C][C]94.4[/C][C]93.2521472993231[/C][C]1.14785270067694[/C][/ROW]
[ROW][C]14[/C][C]91.6[/C][C]90.5624448098591[/C][C]1.03755519014086[/C][/ROW]
[ROW][C]15[/C][C]104.1[/C][C]102.736553825929[/C][C]1.36344617407069[/C][/ROW]
[ROW][C]16[/C][C]107.8[/C][C]106.373149925774[/C][C]1.42685007422614[/C][/ROW]
[ROW][C]17[/C][C]101.7[/C][C]100.393222884547[/C][C]1.30677711545265[/C][/ROW]
[ROW][C]18[/C][C]104.1[/C][C]102.810804963789[/C][C]1.28919503621117[/C][/ROW]
[ROW][C]19[/C][C]102[/C][C]105.230476018688[/C][C]-3.23047601868819[/C][/ROW]
[ROW][C]20[/C][C]99.9[/C][C]96.0768616729606[/C][C]3.82313832703942[/C][/ROW]
[ROW][C]21[/C][C]101.6[/C][C]98.4534987745024[/C][C]3.14650122549762[/C][/ROW]
[ROW][C]22[/C][C]101.3[/C][C]101.302297634027[/C][C]-0.00229763402687411[/C][/ROW]
[ROW][C]23[/C][C]101[/C][C]98.9694678509629[/C][C]2.03053214903707[/C][/ROW]
[ROW][C]24[/C][C]115.9[/C][C]116.32460174805[/C][C]-0.42460174805035[/C][/ROW]
[ROW][C]25[/C][C]97.5[/C][C]96.7043025037459[/C][C]0.795697496254064[/C][/ROW]
[ROW][C]26[/C][C]97.6[/C][C]93.830664828116[/C][C]3.76933517188395[/C][/ROW]
[ROW][C]27[/C][C]109.2[/C][C]106.637623958855[/C][C]2.562376041145[/C][/ROW]
[ROW][C]28[/C][C]101.6[/C][C]110.425686891911[/C][C]-8.82568689191102[/C][/ROW]
[ROW][C]29[/C][C]108.8[/C][C]104.14641500276[/C][C]4.65358499723993[/C][/ROW]
[ROW][C]30[/C][C]108.8[/C][C]106.60828106498[/C][C]2.19171893501967[/C][/ROW]
[ROW][C]31[/C][C]100.9[/C][C]104.467070293261[/C][C]-3.5670702932606[/C][/ROW]
[ROW][C]32[/C][C]107.4[/C][C]102.291352570228[/C][C]5.10864742977157[/C][/ROW]
[ROW][C]33[/C][C]101.7[/C][C]104.032202830454[/C][C]-2.33220283045445[/C][/ROW]
[ROW][C]34[/C][C]104.5[/C][C]103.714062510482[/C][C]0.785937489517934[/C][/ROW]
[ROW][C]35[/C][C]106.1[/C][C]103.398609312223[/C][C]2.70139068777731[/C][/ROW]
[ROW][C]36[/C][C]116.7[/C][C]118.656461981702[/C][C]-1.95646198170176[/C][/ROW]
[ROW][C]37[/C][C]103.7[/C][C]99.8077427046948[/C][C]3.89225729530519[/C][/ROW]
[ROW][C]38[/C][C]96.5[/C][C]99.9052605519148[/C][C]-3.40526055191484[/C][/ROW]
[ROW][C]39[/C][C]114.1[/C][C]111.756920382788[/C][C]2.34307961721173[/C][/ROW]
[ROW][C]40[/C][C]102.8[/C][C]104.002289894913[/C][C]-1.20228989491251[/C][/ROW]
[ROW][C]41[/C][C]114.5[/C][C]111.350842986932[/C][C]3.14915701306784[/C][/ROW]
[ROW][C]42[/C][C]107.2[/C][C]111.348170830133[/C][C]-4.14817083013297[/C][/ROW]
[ROW][C]43[/C][C]107.9[/C][C]103.257736137863[/C][C]4.64226386213683[/C][/ROW]
[ROW][C]44[/C][C]111.3[/C][C]109.903287651437[/C][C]1.39671234856303[/C][/ROW]
[ROW][C]45[/C][C]99.8[/C][C]104.075598079335[/C][C]-4.27559807933481[/C][/ROW]
[ROW][C]46[/C][C]106.7[/C][C]106.922456868161[/C][C]-0.222456868160691[/C][/ROW]
[ROW][C]47[/C][C]106.9[/C][C]108.546662167426[/C][C]-1.64666216742572[/C][/ROW]
[ROW][C]48[/C][C]115.3[/C][C]119.386366840906[/C][C]-4.08636684090563[/C][/ROW]
[ROW][C]49[/C][C]106.1[/C][C]106.061860860838[/C][C]0.0381391391618422[/C][/ROW]
[ROW][C]50[/C][C]97.3[/C][C]98.7027387281705[/C][C]-1.40273872817052[/C][/ROW]
[ROW][C]51[/C][C]109[/C][C]116.688583064684[/C][C]-7.68858306468448[/C][/ROW]
[ROW][C]52[/C][C]109.8[/C][C]105.112592714857[/C][C]4.68740728514253[/C][/ROW]
[ROW][C]53[/C][C]116.5[/C][C]117.07596896076[/C][C]-0.575968960760491[/C][/ROW]
[ROW][C]54[/C][C]108.3[/C][C]109.616616228123[/C][C]-1.31661622812338[/C][/ROW]
[ROW][C]55[/C][C]110.8[/C][C]110.311049545818[/C][C]0.488950454181904[/C][/ROW]
[ROW][C]56[/C][C]108.7[/C][C]113.779815043796[/C][C]-5.079815043796[/C][/ROW]
[ROW][C]57[/C][C]104[/C][C]102.018452403595[/C][C]1.98154759640501[/C][/ROW]
[ROW][C]58[/C][C]111.3[/C][C]109.073611826041[/C][C]2.22638817395861[/C][/ROW]
[ROW][C]59[/C][C]106.5[/C][C]109.283949203132[/C][C]-2.78394920313227[/C][/ROW]
[ROW][C]60[/C][C]120.5[/C][C]117.869221412878[/C][C]2.63077858712181[/C][/ROW]
[ROW][C]61[/C][C]110[/C][C]108.46613213309[/C][C]1.53386786690974[/C][/ROW]
[ROW][C]62[/C][C]99.7[/C][C]99.4733423014578[/C][C]0.226657698542198[/C][/ROW]
[ROW][C]63[/C][C]109[/C][C]111.450390819853[/C][C]-2.45039081985253[/C][/ROW]
[ROW][C]64[/C][C]112.2[/C][C]112.243872929157[/C][C]-0.0438729291567626[/C][/ROW]
[ROW][C]65[/C][C]116[/C][C]119.089620372031[/C][C]-3.08962037203098[/C][/ROW]
[ROW][C]66[/C][C]112.3[/C][C]110.698786642197[/C][C]1.60121335780346[/C][/ROW]
[ROW][C]67[/C][C]113.2[/C][C]113.252639654221[/C][C]-0.052639654221295[/C][/ROW]
[ROW][C]68[/C][C]109.9[/C][C]111.114796364953[/C][C]-1.21479636495289[/C][/ROW]
[ROW][C]69[/C][C]107.6[/C][C]106.297529321422[/C][C]1.30247067857771[/C][/ROW]
[ROW][C]70[/C][C]114.9[/C][C]113.751793033747[/C][C]1.14820696625257[/C][/ROW]
[ROW][C]71[/C][C]105.7[/C][C]108.852060665842[/C][C]-3.15206066584237[/C][/ROW]
[ROW][C]72[/C][C]123.3[/C][C]123.139557506607[/C][C]0.160442493393049[/C][/ROW]
[/TABLE]
Source: https://freestatistics.org/blog/index.php?pk=&T=2

Globally Unique Identifier (entire table): ba.freestatistics.org/blog/index.php?pk=&T=2

As an alternative you can also use a QR Code:  

The GUIDs for individual cells are displayed in the table below:

Interpolation Forecasts of Exponential Smoothing
tObservedFittedResiduals
1394.493.25214729932311.14785270067694
1491.690.56244480985911.03755519014086
15104.1102.7365538259291.36344617407069
16107.8106.3731499257741.42685007422614
17101.7100.3932228845471.30677711545265
18104.1102.8108049637891.28919503621117
19102105.230476018688-3.23047601868819
2099.996.07686167296063.82313832703942
21101.698.45349877450243.14650122549762
22101.3101.302297634027-0.00229763402687411
2310198.96946785096292.03053214903707
24115.9116.32460174805-0.42460174805035
2597.596.70430250374590.795697496254064
2697.693.8306648281163.76933517188395
27109.2106.6376239588552.562376041145
28101.6110.425686891911-8.82568689191102
29108.8104.146415002764.65358499723993
30108.8106.608281064982.19171893501967
31100.9104.467070293261-3.5670702932606
32107.4102.2913525702285.10864742977157
33101.7104.032202830454-2.33220283045445
34104.5103.7140625104820.785937489517934
35106.1103.3986093122232.70139068777731
36116.7118.656461981702-1.95646198170176
37103.799.80774270469483.89225729530519
3896.599.9052605519148-3.40526055191484
39114.1111.7569203827882.34307961721173
40102.8104.002289894913-1.20228989491251
41114.5111.3508429869323.14915701306784
42107.2111.348170830133-4.14817083013297
43107.9103.2577361378634.64226386213683
44111.3109.9032876514371.39671234856303
4599.8104.075598079335-4.27559807933481
46106.7106.922456868161-0.222456868160691
47106.9108.546662167426-1.64666216742572
48115.3119.386366840906-4.08636684090563
49106.1106.0618608608380.0381391391618422
5097.398.7027387281705-1.40273872817052
51109116.688583064684-7.68858306468448
52109.8105.1125927148574.68740728514253
53116.5117.07596896076-0.575968960760491
54108.3109.616616228123-1.31661622812338
55110.8110.3110495458180.488950454181904
56108.7113.779815043796-5.079815043796
57104102.0184524035951.98154759640501
58111.3109.0736118260412.22638817395861
59106.5109.283949203132-2.78394920313227
60120.5117.8692214128782.63077858712181
61110108.466132133091.53386786690974
6299.799.47334230145780.226657698542198
63109111.450390819853-2.45039081985253
64112.2112.243872929157-0.0438729291567626
65116119.089620372031-3.08962037203098
66112.3110.6987866421971.60121335780346
67113.2113.252639654221-0.052639654221295
68109.9111.114796364953-1.21479636495289
69107.6106.2975293214221.30247067857771
70114.9113.7517930337471.14820696625257
71105.7108.852060665842-3.15206066584237
72123.3123.1395575066070.160442493393049


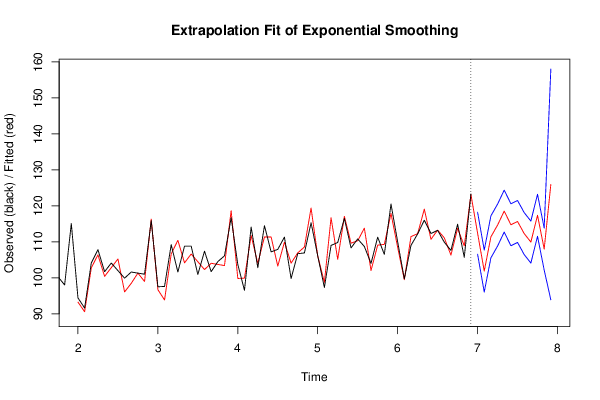
Extrapolation Forecasts of Exponential Smoothing
tForecast95% Lower Bound95% Upper Bound
73112.401297764786106.570923191143118.231672338429
74101.87185465029696.0414631240422107.70224617655
75111.376642778917105.54622334494117.207062212893
76114.642082520327108.811638720307120.472526320348
77118.528400781255112.697930409898124.358871152612
78114.738890417032108.908407051886120.569373782179
79115.654129156693109.823623471417121.48463484197
80112.281553247678106.45103608187118.112070413485
81109.923915727143104.093385187776115.75444626651
82117.373953109002111.543377807929123.204528410075
83107.980108963921102.149547636394113.810670291448
84125.95455824279793.8697384771853158.039378008408

\begin{tabular}{lllllllll}
\hline
Extrapolation Forecasts of Exponential Smoothing \tabularnewline
t & Forecast & 95% Lower Bound & 95% Upper Bound \tabularnewline
73 & 112.401297764786 & 106.570923191143 & 118.231672338429 \tabularnewline
74 & 101.871854650296 & 96.0414631240422 & 107.70224617655 \tabularnewline
75 & 111.376642778917 & 105.54622334494 & 117.207062212893 \tabularnewline
76 & 114.642082520327 & 108.811638720307 & 120.472526320348 \tabularnewline
77 & 118.528400781255 & 112.697930409898 & 124.358871152612 \tabularnewline
78 & 114.738890417032 & 108.908407051886 & 120.569373782179 \tabularnewline
79 & 115.654129156693 & 109.823623471417 & 121.48463484197 \tabularnewline
80 & 112.281553247678 & 106.45103608187 & 118.112070413485 \tabularnewline
81 & 109.923915727143 & 104.093385187776 & 115.75444626651 \tabularnewline
82 & 117.373953109002 & 111.543377807929 & 123.204528410075 \tabularnewline
83 & 107.980108963921 & 102.149547636394 & 113.810670291448 \tabularnewline
84 & 125.954558242797 & 93.8697384771853 & 158.039378008408 \tabularnewline
\hline
\end{tabular}
%Source: https://freestatistics.org/blog/index.php?pk=&T=3

[TABLE]
[ROW][C]Extrapolation Forecasts of Exponential Smoothing[/C][/ROW]
[ROW][C]t[/C][C]Forecast[/C][C]95% Lower Bound[/C][C]95% Upper Bound[/C][/ROW]
[ROW][C]73[/C][C]112.401297764786[/C][C]106.570923191143[/C][C]118.231672338429[/C][/ROW]
[ROW][C]74[/C][C]101.871854650296[/C][C]96.0414631240422[/C][C]107.70224617655[/C][/ROW]
[ROW][C]75[/C][C]111.376642778917[/C][C]105.54622334494[/C][C]117.207062212893[/C][/ROW]
[ROW][C]76[/C][C]114.642082520327[/C][C]108.811638720307[/C][C]120.472526320348[/C][/ROW]
[ROW][C]77[/C][C]118.528400781255[/C][C]112.697930409898[/C][C]124.358871152612[/C][/ROW]
[ROW][C]78[/C][C]114.738890417032[/C][C]108.908407051886[/C][C]120.569373782179[/C][/ROW]
[ROW][C]79[/C][C]115.654129156693[/C][C]109.823623471417[/C][C]121.48463484197[/C][/ROW]
[ROW][C]80[/C][C]112.281553247678[/C][C]106.45103608187[/C][C]118.112070413485[/C][/ROW]
[ROW][C]81[/C][C]109.923915727143[/C][C]104.093385187776[/C][C]115.75444626651[/C][/ROW]
[ROW][C]82[/C][C]117.373953109002[/C][C]111.543377807929[/C][C]123.204528410075[/C][/ROW]
[ROW][C]83[/C][C]107.980108963921[/C][C]102.149547636394[/C][C]113.810670291448[/C][/ROW]
[ROW][C]84[/C][C]125.954558242797[/C][C]93.8697384771853[/C][C]158.039378008408[/C][/ROW]
[/TABLE]
Source: https://freestatistics.org/blog/index.php?pk=&T=3

Globally Unique Identifier (entire table): ba.freestatistics.org/blog/index.php?pk=&T=3

As an alternative you can also use a QR Code:  

The GUIDs for individual cells are displayed in the table below:

Extrapolation Forecasts of Exponential Smoothing
tForecast95% Lower Bound95% Upper Bound
73112.401297764786106.570923191143118.231672338429
74101.87185465029696.0414631240422107.70224617655
75111.376642778917105.54622334494117.207062212893
76114.642082520327108.811638720307120.472526320348
77118.528400781255112.697930409898124.358871152612
78114.738890417032108.908407051886120.569373782179
79115.654129156693109.823623471417121.48463484197
80112.281553247678106.45103608187118.112070413485
81109.923915727143104.093385187776115.75444626651
82117.373953109002111.543377807929123.204528410075
83107.980108963921102.149547636394113.810670291448
84125.95455824279793.8697384771853158.039378008408


Parameters (Session):
par1 = 12 ; par2 = Triple ; par3 = multiplicative ;
Parameters (R input):
par1 = 12 ; par2 = Triple ; par3 = multiplicative ;
R code (references can be found in the software module):
par3 <- 'multiplicative'
par2 <- 'Triple'
par1 <- '12'
par1 <- as.numeric(par1)
if (par2 == 'Single') K <- 1
if (par2 == 'Double') K <- 2
if (par2 == 'Triple') K <- par1
nx <- length(x)
nxmK <- nx - K
x <- ts(x, frequency = par1)
if (par2 == 'Single') fit <- HoltWinters(x, gamma=F, beta=F)
if (par2 == 'Double') fit <- HoltWinters(x, gamma=F)
if (par2 == 'Triple') fit <- HoltWinters(x, seasonal=par3)
fit
myresid <- x - fit$fitted[,'xhat']
bitmap(file='test1.png')
op <- par(mfrow=c(2,1))
plot(fit,ylab='Observed (black) / Fitted (red)',main='Interpolation Fit of Exponential Smoothing')
plot(myresid,ylab='Residuals',main='Interpolation Prediction Errors')
par(op)
dev.off()
bitmap(file='test2.png')
p <- predict(fit, par1, prediction.interval=TRUE)
np <- length(p[,1])
plot(fit,p,ylab='Observed (black) / Fitted (red)',main='Extrapolation Fit of Exponential Smoothing')
dev.off()
bitmap(file='test3.png')
op <- par(mfrow = c(2,2))
acf(as.numeric(myresid),lag.max = nx/2,main='Residual ACF')
spectrum(myresid,main='Residals Periodogram')
cpgram(myresid,main='Residal Cumulative Periodogram')
qqnorm(myresid,main='Residual Normal QQ Plot')
qqline(myresid)
par(op)
dev.off()
load(file='createtable')
a<-table.start()
a<-table.row.start(a)
a<-table.element(a,'Estimated Parameters of Exponential Smoothing',2,TRUE)
a<-table.row.end(a)
a<-table.row.start(a)
a<-table.element(a,'Parameter',header=TRUE)
a<-table.element(a,'Value',header=TRUE)
a<-table.row.end(a)
a<-table.row.start(a)
a<-table.element(a,'alpha',header=TRUE)
a<-table.element(a,fit$alpha)
a<-table.row.end(a)
a<-table.row.start(a)
a<-table.element(a,'beta',header=TRUE)
a<-table.element(a,fit$beta)
a<-table.row.end(a)
a<-table.row.start(a)
a<-table.element(a,'gamma',header=TRUE)
a<-table.element(a,fit$gamma)
a<-table.row.end(a)
a<-table.end(a)
table.save(a,file='mytable.tab')
a<-table.start()
a<-table.row.start(a)
a<-table.element(a,'Interpolation Forecasts of Exponential Smoothing',4,TRUE)
a<-table.row.end(a)
a<-table.row.start(a)
a<-table.element(a,'t',header=TRUE)
a<-table.element(a,'Observed',header=TRUE)
a<-table.element(a,'Fitted',header=TRUE)
a<-table.element(a,'Residuals',header=TRUE)
a<-table.row.end(a)
for (i in 1:nxmK) {
a<-table.row.start(a)
a<-table.element(a,i+K,header=TRUE)
a<-table.element(a,x[i+K])
a<-table.element(a,fit$fitted[i,'xhat'])
a<-table.element(a,myresid[i])
a<-table.row.end(a)
}
a<-table.end(a)
table.save(a,file='mytable1.tab')
a<-table.start()
a<-table.row.start(a)
a<-table.element(a,'Extrapolation Forecasts of Exponential Smoothing',4,TRUE)
a<-table.row.end(a)
a<-table.row.start(a)
a<-table.element(a,'t',header=TRUE)
a<-table.element(a,'Forecast',header=TRUE)
a<-table.element(a,'95% Lower Bound',header=TRUE)
a<-table.element(a,'95% Upper Bound',header=TRUE)
a<-table.row.end(a)
for (i in 1:np) {
a<-table.row.start(a)
a<-table.element(a,nx+i,header=TRUE)
a<-table.element(a,p[i,'fit'])
a<-table.element(a,p[i,'lwr'])
a<-table.element(a,p[i,'upr'])
a<-table.row.end(a)
}
a<-table.end(a)
table.save(a,file='mytable2.tab')