Free Statistics

of Irreproducible Research!

Author's title

Author*Unverified author*
R Software Modulerwasp_exponentialsmoothing.wasp
Title produced by softwareExponential Smoothing
Date of computationSun, 27 Nov 2016 15:26:15 +0000
Cite this page as followsStatistical Computations at FreeStatistics.org, Office for Research Development and Education, URL https://freestatistics.org/blog/index.php?v=date/2016/Nov/27/t1480260454z6k4hs8hwu5qtc3.htm/, Retrieved Mon, 29 Apr 2024 23:20:00 +0200
Statistical Computations at FreeStatistics.org, Office for Research Development and Education, URL https://freestatistics.org/blog/index.php?pk=, Retrieved Mon, 29 Apr 2024 23:20:00 +0200
QR Codes:

Original text written by user:
IsPrivate?No (this computation is public)
User-defined keywords
Estimated Impact0
Dataseries X:
100
100
100
100
100
100
100
100
100
100
100
100
100,4
100,4
100,4
100,4
100,4
100,4
100,4
100,4
100,4
100,4
101,4
101,4
102
102
102,6
102,6
102,6
102,6
102,6
102,6
102,3
102,4
102,4
102,4
102,9
102,9
102,9
104,9
104,9
105,5
105,5
105,5
105,5
105,5
105,5
105,5
105,5
106,8
106,8
106,8
106,9
107,5
107,6
107,6
107,6
107,8
107,8
107,8


Summary of computational transaction
Raw Inputview raw input (R code)
Raw Outputview raw output of R engine
Computing time1 seconds
R Server'Sir Ronald Aylmer Fisher' @ fisher.wessa.net

\begin{tabular}{lllllllll}
\hline
Summary of computational transaction \tabularnewline
Raw Input & view raw input (R code)  \tabularnewline
Raw Output & view raw output of R engine  \tabularnewline
Computing time & 1 seconds \tabularnewline
R Server & 'Sir Ronald Aylmer Fisher' @ fisher.wessa.net \tabularnewline
\hline
\end{tabular}
%Source: https://freestatistics.org/blog/index.php?pk=&T=0

[TABLE]
[ROW][C]Summary of computational transaction[/C][/ROW]
[ROW][C]Raw Input[/C][C]view raw input (R code) [/C][/ROW]
[ROW][C]Raw Output[/C][C]view raw output of R engine [/C][/ROW]
[ROW][C]Computing time[/C][C]1 seconds[/C][/ROW]
[ROW][C]R Server[/C][C]'Sir Ronald Aylmer Fisher' @ fisher.wessa.net[/C][/ROW]
[/TABLE]
Source: https://freestatistics.org/blog/index.php?pk=&T=0

Globally Unique Identifier (entire table): ba.freestatistics.org/blog/index.php?pk=&T=0

As an alternative you can also use a QR Code:  

The GUIDs for individual cells are displayed in the table below:

Summary of computational transaction
Raw Inputview raw input (R code)
Raw Outputview raw output of R engine
Computing time1 seconds
R Server'Sir Ronald Aylmer Fisher' @ fisher.wessa.net


Estimated Parameters of Exponential Smoothing
ParameterValue
alpha0.894316694477335
beta0.0554592401396707
gammaFALSE

\begin{tabular}{lllllllll}
\hline
Estimated Parameters of Exponential Smoothing \tabularnewline
Parameter & Value \tabularnewline
alpha & 0.894316694477335 \tabularnewline
beta & 0.0554592401396707 \tabularnewline
gamma & FALSE \tabularnewline
\hline
\end{tabular}
%Source: https://freestatistics.org/blog/index.php?pk=&T=1

[TABLE]
[ROW][C]Estimated Parameters of Exponential Smoothing[/C][/ROW]
[ROW][C]Parameter[/C][C]Value[/C][/ROW]
[ROW][C]alpha[/C][C]0.894316694477335[/C][/ROW]
[ROW][C]beta[/C][C]0.0554592401396707[/C][/ROW]
[ROW][C]gamma[/C][C]FALSE[/C][/ROW]
[/TABLE]
Source: https://freestatistics.org/blog/index.php?pk=&T=1

Globally Unique Identifier (entire table): ba.freestatistics.org/blog/index.php?pk=&T=1

As an alternative you can also use a QR Code:  

The GUIDs for individual cells are displayed in the table below:

Estimated Parameters of Exponential Smoothing
ParameterValue
alpha0.894316694477335
beta0.0554592401396707
gammaFALSE


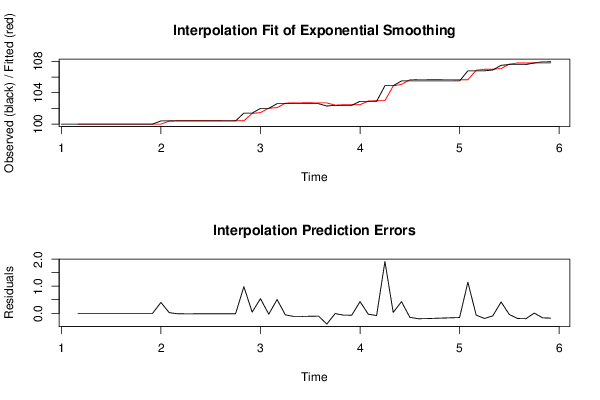
Interpolation Forecasts of Exponential Smoothing
tObservedFittedResiduals
31001000
41001000
51001000
61001000
71001000
81001000
91001000
101001000
111001000
121001000
13100.41000.400000000000006
14100.4100.3775659275190.0224340724810901
15100.4100.418581030708-0.0185810307077645
16100.4100.421994058118-0.021994058118068
17100.4100.421263894108-0.021263894107804
18100.4100.420132078698-0.0201320786981398
19100.4100.419013951362-0.0190139513623109
20100.4100.417952727646-0.0179527276459766
21100.4100.416950152398-0.0169501523980671
22100.4100.416003501166-0.0160035011659687
23101.4100.4151097122940.984890287705809
24101.4101.358180659140.041819340859746
25102101.4599216750120.540078324987732
26102102.034050890468-0.0340508904684924
27102.6102.0930379034560.506962096543603
28102.6102.661006231748-0.0610062317481237
29102.6102.718005207448-0.118005207447652
30102.6102.718176210662-0.118176210661602
31102.6102.712332964458-0.112332964458446
32102.6102.706143926548-0.106143926548285
33102.3102.700225308899-0.400225308899181
34102.4102.411454376852-0.0114543768519155
35102.4102.469799664055-0.0697996640549263
36102.4102.472503854453-0.0725038544529184
37102.9102.4691935870460.430806412953899
38102.9102.937369284311-0.0373692843105857
39102.9102.984994193154-0.0849941931538893
40104.9102.9858117983871.91418820161286
41104.9104.8694717389610.0305282610391657
42105.5105.0700572924480.429942707552414
43105.5105.649170205326-0.149170205326186
44105.5105.702974209841-0.202974209841443
45105.5105.698593254796-0.198593254795526
46105.5105.688280408044-0.188280408044477
47105.5105.677852157225-0.177852157225288
48105.5105.667928931803-0.16792893180326
49105.5105.658551252503-0.158551252502718
50106.8105.6496963436231.15030365637661
51106.8106.868425134158-0.0684251341581046
52106.8106.993830662967-0.19383066296686
53106.9106.997470296463-0.0974702964633423
54107.5107.0824522705280.417547729471607
55107.6107.64873304734-0.0487330473396668
56107.6107.795594073394-0.195594073394318
57107.6107.801413732912-0.201413732911774
58107.8107.7920390304020.007960969598102
59107.8107.970306468908-0.170306468907654
60107.8107.980699479659-0.180699479658642

\begin{tabular}{lllllllll}
\hline
Interpolation Forecasts of Exponential Smoothing \tabularnewline
t & Observed & Fitted & Residuals \tabularnewline
3 & 100 & 100 & 0 \tabularnewline
4 & 100 & 100 & 0 \tabularnewline
5 & 100 & 100 & 0 \tabularnewline
6 & 100 & 100 & 0 \tabularnewline
7 & 100 & 100 & 0 \tabularnewline
8 & 100 & 100 & 0 \tabularnewline
9 & 100 & 100 & 0 \tabularnewline
10 & 100 & 100 & 0 \tabularnewline
11 & 100 & 100 & 0 \tabularnewline
12 & 100 & 100 & 0 \tabularnewline
13 & 100.4 & 100 & 0.400000000000006 \tabularnewline
14 & 100.4 & 100.377565927519 & 0.0224340724810901 \tabularnewline
15 & 100.4 & 100.418581030708 & -0.0185810307077645 \tabularnewline
16 & 100.4 & 100.421994058118 & -0.021994058118068 \tabularnewline
17 & 100.4 & 100.421263894108 & -0.021263894107804 \tabularnewline
18 & 100.4 & 100.420132078698 & -0.0201320786981398 \tabularnewline
19 & 100.4 & 100.419013951362 & -0.0190139513623109 \tabularnewline
20 & 100.4 & 100.417952727646 & -0.0179527276459766 \tabularnewline
21 & 100.4 & 100.416950152398 & -0.0169501523980671 \tabularnewline
22 & 100.4 & 100.416003501166 & -0.0160035011659687 \tabularnewline
23 & 101.4 & 100.415109712294 & 0.984890287705809 \tabularnewline
24 & 101.4 & 101.35818065914 & 0.041819340859746 \tabularnewline
25 & 102 & 101.459921675012 & 0.540078324987732 \tabularnewline
26 & 102 & 102.034050890468 & -0.0340508904684924 \tabularnewline
27 & 102.6 & 102.093037903456 & 0.506962096543603 \tabularnewline
28 & 102.6 & 102.661006231748 & -0.0610062317481237 \tabularnewline
29 & 102.6 & 102.718005207448 & -0.118005207447652 \tabularnewline
30 & 102.6 & 102.718176210662 & -0.118176210661602 \tabularnewline
31 & 102.6 & 102.712332964458 & -0.112332964458446 \tabularnewline
32 & 102.6 & 102.706143926548 & -0.106143926548285 \tabularnewline
33 & 102.3 & 102.700225308899 & -0.400225308899181 \tabularnewline
34 & 102.4 & 102.411454376852 & -0.0114543768519155 \tabularnewline
35 & 102.4 & 102.469799664055 & -0.0697996640549263 \tabularnewline
36 & 102.4 & 102.472503854453 & -0.0725038544529184 \tabularnewline
37 & 102.9 & 102.469193587046 & 0.430806412953899 \tabularnewline
38 & 102.9 & 102.937369284311 & -0.0373692843105857 \tabularnewline
39 & 102.9 & 102.984994193154 & -0.0849941931538893 \tabularnewline
40 & 104.9 & 102.985811798387 & 1.91418820161286 \tabularnewline
41 & 104.9 & 104.869471738961 & 0.0305282610391657 \tabularnewline
42 & 105.5 & 105.070057292448 & 0.429942707552414 \tabularnewline
43 & 105.5 & 105.649170205326 & -0.149170205326186 \tabularnewline
44 & 105.5 & 105.702974209841 & -0.202974209841443 \tabularnewline
45 & 105.5 & 105.698593254796 & -0.198593254795526 \tabularnewline
46 & 105.5 & 105.688280408044 & -0.188280408044477 \tabularnewline
47 & 105.5 & 105.677852157225 & -0.177852157225288 \tabularnewline
48 & 105.5 & 105.667928931803 & -0.16792893180326 \tabularnewline
49 & 105.5 & 105.658551252503 & -0.158551252502718 \tabularnewline
50 & 106.8 & 105.649696343623 & 1.15030365637661 \tabularnewline
51 & 106.8 & 106.868425134158 & -0.0684251341581046 \tabularnewline
52 & 106.8 & 106.993830662967 & -0.19383066296686 \tabularnewline
53 & 106.9 & 106.997470296463 & -0.0974702964633423 \tabularnewline
54 & 107.5 & 107.082452270528 & 0.417547729471607 \tabularnewline
55 & 107.6 & 107.64873304734 & -0.0487330473396668 \tabularnewline
56 & 107.6 & 107.795594073394 & -0.195594073394318 \tabularnewline
57 & 107.6 & 107.801413732912 & -0.201413732911774 \tabularnewline
58 & 107.8 & 107.792039030402 & 0.007960969598102 \tabularnewline
59 & 107.8 & 107.970306468908 & -0.170306468907654 \tabularnewline
60 & 107.8 & 107.980699479659 & -0.180699479658642 \tabularnewline
\hline
\end{tabular}
%Source: https://freestatistics.org/blog/index.php?pk=&T=2

[TABLE]
[ROW][C]Interpolation Forecasts of Exponential Smoothing[/C][/ROW]
[ROW][C]t[/C][C]Observed[/C][C]Fitted[/C][C]Residuals[/C][/ROW]
[ROW][C]3[/C][C]100[/C][C]100[/C][C]0[/C][/ROW]
[ROW][C]4[/C][C]100[/C][C]100[/C][C]0[/C][/ROW]
[ROW][C]5[/C][C]100[/C][C]100[/C][C]0[/C][/ROW]
[ROW][C]6[/C][C]100[/C][C]100[/C][C]0[/C][/ROW]
[ROW][C]7[/C][C]100[/C][C]100[/C][C]0[/C][/ROW]
[ROW][C]8[/C][C]100[/C][C]100[/C][C]0[/C][/ROW]
[ROW][C]9[/C][C]100[/C][C]100[/C][C]0[/C][/ROW]
[ROW][C]10[/C][C]100[/C][C]100[/C][C]0[/C][/ROW]
[ROW][C]11[/C][C]100[/C][C]100[/C][C]0[/C][/ROW]
[ROW][C]12[/C][C]100[/C][C]100[/C][C]0[/C][/ROW]
[ROW][C]13[/C][C]100.4[/C][C]100[/C][C]0.400000000000006[/C][/ROW]
[ROW][C]14[/C][C]100.4[/C][C]100.377565927519[/C][C]0.0224340724810901[/C][/ROW]
[ROW][C]15[/C][C]100.4[/C][C]100.418581030708[/C][C]-0.0185810307077645[/C][/ROW]
[ROW][C]16[/C][C]100.4[/C][C]100.421994058118[/C][C]-0.021994058118068[/C][/ROW]
[ROW][C]17[/C][C]100.4[/C][C]100.421263894108[/C][C]-0.021263894107804[/C][/ROW]
[ROW][C]18[/C][C]100.4[/C][C]100.420132078698[/C][C]-0.0201320786981398[/C][/ROW]
[ROW][C]19[/C][C]100.4[/C][C]100.419013951362[/C][C]-0.0190139513623109[/C][/ROW]
[ROW][C]20[/C][C]100.4[/C][C]100.417952727646[/C][C]-0.0179527276459766[/C][/ROW]
[ROW][C]21[/C][C]100.4[/C][C]100.416950152398[/C][C]-0.0169501523980671[/C][/ROW]
[ROW][C]22[/C][C]100.4[/C][C]100.416003501166[/C][C]-0.0160035011659687[/C][/ROW]
[ROW][C]23[/C][C]101.4[/C][C]100.415109712294[/C][C]0.984890287705809[/C][/ROW]
[ROW][C]24[/C][C]101.4[/C][C]101.35818065914[/C][C]0.041819340859746[/C][/ROW]
[ROW][C]25[/C][C]102[/C][C]101.459921675012[/C][C]0.540078324987732[/C][/ROW]
[ROW][C]26[/C][C]102[/C][C]102.034050890468[/C][C]-0.0340508904684924[/C][/ROW]
[ROW][C]27[/C][C]102.6[/C][C]102.093037903456[/C][C]0.506962096543603[/C][/ROW]
[ROW][C]28[/C][C]102.6[/C][C]102.661006231748[/C][C]-0.0610062317481237[/C][/ROW]
[ROW][C]29[/C][C]102.6[/C][C]102.718005207448[/C][C]-0.118005207447652[/C][/ROW]
[ROW][C]30[/C][C]102.6[/C][C]102.718176210662[/C][C]-0.118176210661602[/C][/ROW]
[ROW][C]31[/C][C]102.6[/C][C]102.712332964458[/C][C]-0.112332964458446[/C][/ROW]
[ROW][C]32[/C][C]102.6[/C][C]102.706143926548[/C][C]-0.106143926548285[/C][/ROW]
[ROW][C]33[/C][C]102.3[/C][C]102.700225308899[/C][C]-0.400225308899181[/C][/ROW]
[ROW][C]34[/C][C]102.4[/C][C]102.411454376852[/C][C]-0.0114543768519155[/C][/ROW]
[ROW][C]35[/C][C]102.4[/C][C]102.469799664055[/C][C]-0.0697996640549263[/C][/ROW]
[ROW][C]36[/C][C]102.4[/C][C]102.472503854453[/C][C]-0.0725038544529184[/C][/ROW]
[ROW][C]37[/C][C]102.9[/C][C]102.469193587046[/C][C]0.430806412953899[/C][/ROW]
[ROW][C]38[/C][C]102.9[/C][C]102.937369284311[/C][C]-0.0373692843105857[/C][/ROW]
[ROW][C]39[/C][C]102.9[/C][C]102.984994193154[/C][C]-0.0849941931538893[/C][/ROW]
[ROW][C]40[/C][C]104.9[/C][C]102.985811798387[/C][C]1.91418820161286[/C][/ROW]
[ROW][C]41[/C][C]104.9[/C][C]104.869471738961[/C][C]0.0305282610391657[/C][/ROW]
[ROW][C]42[/C][C]105.5[/C][C]105.070057292448[/C][C]0.429942707552414[/C][/ROW]
[ROW][C]43[/C][C]105.5[/C][C]105.649170205326[/C][C]-0.149170205326186[/C][/ROW]
[ROW][C]44[/C][C]105.5[/C][C]105.702974209841[/C][C]-0.202974209841443[/C][/ROW]
[ROW][C]45[/C][C]105.5[/C][C]105.698593254796[/C][C]-0.198593254795526[/C][/ROW]
[ROW][C]46[/C][C]105.5[/C][C]105.688280408044[/C][C]-0.188280408044477[/C][/ROW]
[ROW][C]47[/C][C]105.5[/C][C]105.677852157225[/C][C]-0.177852157225288[/C][/ROW]
[ROW][C]48[/C][C]105.5[/C][C]105.667928931803[/C][C]-0.16792893180326[/C][/ROW]
[ROW][C]49[/C][C]105.5[/C][C]105.658551252503[/C][C]-0.158551252502718[/C][/ROW]
[ROW][C]50[/C][C]106.8[/C][C]105.649696343623[/C][C]1.15030365637661[/C][/ROW]
[ROW][C]51[/C][C]106.8[/C][C]106.868425134158[/C][C]-0.0684251341581046[/C][/ROW]
[ROW][C]52[/C][C]106.8[/C][C]106.993830662967[/C][C]-0.19383066296686[/C][/ROW]
[ROW][C]53[/C][C]106.9[/C][C]106.997470296463[/C][C]-0.0974702964633423[/C][/ROW]
[ROW][C]54[/C][C]107.5[/C][C]107.082452270528[/C][C]0.417547729471607[/C][/ROW]
[ROW][C]55[/C][C]107.6[/C][C]107.64873304734[/C][C]-0.0487330473396668[/C][/ROW]
[ROW][C]56[/C][C]107.6[/C][C]107.795594073394[/C][C]-0.195594073394318[/C][/ROW]
[ROW][C]57[/C][C]107.6[/C][C]107.801413732912[/C][C]-0.201413732911774[/C][/ROW]
[ROW][C]58[/C][C]107.8[/C][C]107.792039030402[/C][C]0.007960969598102[/C][/ROW]
[ROW][C]59[/C][C]107.8[/C][C]107.970306468908[/C][C]-0.170306468907654[/C][/ROW]
[ROW][C]60[/C][C]107.8[/C][C]107.980699479659[/C][C]-0.180699479658642[/C][/ROW]
[/TABLE]
Source: https://freestatistics.org/blog/index.php?pk=&T=2

Globally Unique Identifier (entire table): ba.freestatistics.org/blog/index.php?pk=&T=2

As an alternative you can also use a QR Code:  

The GUIDs for individual cells are displayed in the table below:

Interpolation Forecasts of Exponential Smoothing
tObservedFittedResiduals
31001000
41001000
51001000
61001000
71001000
81001000
91001000
101001000
111001000
121001000
13100.41000.400000000000006
14100.4100.3775659275190.0224340724810901
15100.4100.418581030708-0.0185810307077645
16100.4100.421994058118-0.021994058118068
17100.4100.421263894108-0.021263894107804
18100.4100.420132078698-0.0201320786981398
19100.4100.419013951362-0.0190139513623109
20100.4100.417952727646-0.0179527276459766
21100.4100.416950152398-0.0169501523980671
22100.4100.416003501166-0.0160035011659687
23101.4100.4151097122940.984890287705809
24101.4101.358180659140.041819340859746
25102101.4599216750120.540078324987732
26102102.034050890468-0.0340508904684924
27102.6102.0930379034560.506962096543603
28102.6102.661006231748-0.0610062317481237
29102.6102.718005207448-0.118005207447652
30102.6102.718176210662-0.118176210661602
31102.6102.712332964458-0.112332964458446
32102.6102.706143926548-0.106143926548285
33102.3102.700225308899-0.400225308899181
34102.4102.411454376852-0.0114543768519155
35102.4102.469799664055-0.0697996640549263
36102.4102.472503854453-0.0725038544529184
37102.9102.4691935870460.430806412953899
38102.9102.937369284311-0.0373692843105857
39102.9102.984994193154-0.0849941931538893
40104.9102.9858117983871.91418820161286
41104.9104.8694717389610.0305282610391657
42105.5105.0700572924480.429942707552414
43105.5105.649170205326-0.149170205326186
44105.5105.702974209841-0.202974209841443
45105.5105.698593254796-0.198593254795526
46105.5105.688280408044-0.188280408044477
47105.5105.677852157225-0.177852157225288
48105.5105.667928931803-0.16792893180326
49105.5105.658551252503-0.158551252502718
50106.8105.6496963436231.15030365637661
51106.8106.868425134158-0.0684251341581046
52106.8106.993830662967-0.19383066296686
53106.9106.997470296463-0.0974702964633423
54107.5107.0824522705280.417547729471607
55107.6107.64873304734-0.0487330473396668
56107.6107.795594073394-0.195594073394318
57107.6107.801413732912-0.201413732911774
58107.8107.7920390304020.007960969598102
59107.8107.970306468908-0.170306468907654
60107.8107.980699479659-0.180699479658642


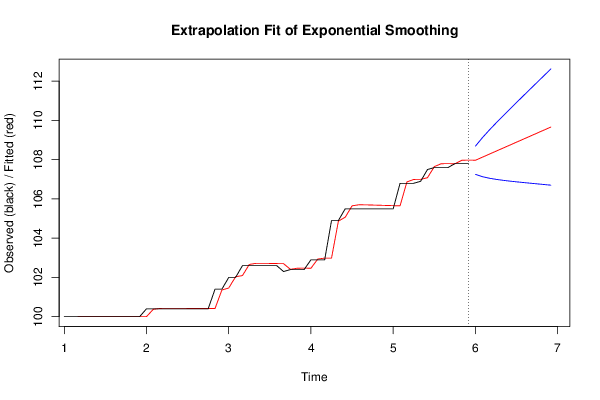
Extrapolation Forecasts of Exponential Smoothing
tForecast95% Lower Bound95% Upper Bound
61107.972835492132107.252233249902108.693437734363
62108.126574065948107.135654225603109.117493906294
63108.280312639764107.057825610606109.502799668923
64108.43405121358106.998962512349109.869139914811
65108.587789787396106.950874386011110.224705188782
66108.741528361212106.909298392399110.573758330025
67108.895266935028106.871716038248110.918817831808
68109.049005508844106.836513357333111.261497660354
69109.20274408266106.802595900982111.602892264338
70109.356482656476106.769190187138111.943775125813
71109.510221230292106.735732201009112.284710259575
72109.663959804108106.701800588492112.626119019723

\begin{tabular}{lllllllll}
\hline
Extrapolation Forecasts of Exponential Smoothing \tabularnewline
t & Forecast & 95% Lower Bound & 95% Upper Bound \tabularnewline
61 & 107.972835492132 & 107.252233249902 & 108.693437734363 \tabularnewline
62 & 108.126574065948 & 107.135654225603 & 109.117493906294 \tabularnewline
63 & 108.280312639764 & 107.057825610606 & 109.502799668923 \tabularnewline
64 & 108.43405121358 & 106.998962512349 & 109.869139914811 \tabularnewline
65 & 108.587789787396 & 106.950874386011 & 110.224705188782 \tabularnewline
66 & 108.741528361212 & 106.909298392399 & 110.573758330025 \tabularnewline
67 & 108.895266935028 & 106.871716038248 & 110.918817831808 \tabularnewline
68 & 109.049005508844 & 106.836513357333 & 111.261497660354 \tabularnewline
69 & 109.20274408266 & 106.802595900982 & 111.602892264338 \tabularnewline
70 & 109.356482656476 & 106.769190187138 & 111.943775125813 \tabularnewline
71 & 109.510221230292 & 106.735732201009 & 112.284710259575 \tabularnewline
72 & 109.663959804108 & 106.701800588492 & 112.626119019723 \tabularnewline
\hline
\end{tabular}
%Source: https://freestatistics.org/blog/index.php?pk=&T=3

[TABLE]
[ROW][C]Extrapolation Forecasts of Exponential Smoothing[/C][/ROW]
[ROW][C]t[/C][C]Forecast[/C][C]95% Lower Bound[/C][C]95% Upper Bound[/C][/ROW]
[ROW][C]61[/C][C]107.972835492132[/C][C]107.252233249902[/C][C]108.693437734363[/C][/ROW]
[ROW][C]62[/C][C]108.126574065948[/C][C]107.135654225603[/C][C]109.117493906294[/C][/ROW]
[ROW][C]63[/C][C]108.280312639764[/C][C]107.057825610606[/C][C]109.502799668923[/C][/ROW]
[ROW][C]64[/C][C]108.43405121358[/C][C]106.998962512349[/C][C]109.869139914811[/C][/ROW]
[ROW][C]65[/C][C]108.587789787396[/C][C]106.950874386011[/C][C]110.224705188782[/C][/ROW]
[ROW][C]66[/C][C]108.741528361212[/C][C]106.909298392399[/C][C]110.573758330025[/C][/ROW]
[ROW][C]67[/C][C]108.895266935028[/C][C]106.871716038248[/C][C]110.918817831808[/C][/ROW]
[ROW][C]68[/C][C]109.049005508844[/C][C]106.836513357333[/C][C]111.261497660354[/C][/ROW]
[ROW][C]69[/C][C]109.20274408266[/C][C]106.802595900982[/C][C]111.602892264338[/C][/ROW]
[ROW][C]70[/C][C]109.356482656476[/C][C]106.769190187138[/C][C]111.943775125813[/C][/ROW]
[ROW][C]71[/C][C]109.510221230292[/C][C]106.735732201009[/C][C]112.284710259575[/C][/ROW]
[ROW][C]72[/C][C]109.663959804108[/C][C]106.701800588492[/C][C]112.626119019723[/C][/ROW]
[/TABLE]
Source: https://freestatistics.org/blog/index.php?pk=&T=3

Globally Unique Identifier (entire table): ba.freestatistics.org/blog/index.php?pk=&T=3

As an alternative you can also use a QR Code:  

The GUIDs for individual cells are displayed in the table below:

Extrapolation Forecasts of Exponential Smoothing
tForecast95% Lower Bound95% Upper Bound
61107.972835492132107.252233249902108.693437734363
62108.126574065948107.135654225603109.117493906294
63108.280312639764107.057825610606109.502799668923
64108.43405121358106.998962512349109.869139914811
65108.587789787396106.950874386011110.224705188782
66108.741528361212106.909298392399110.573758330025
67108.895266935028106.871716038248110.918817831808
68109.049005508844106.836513357333111.261497660354
69109.20274408266106.802595900982111.602892264338
70109.356482656476106.769190187138111.943775125813
71109.510221230292106.735732201009112.284710259575
72109.663959804108106.701800588492112.626119019723


Parameters (Session):
par1 = 12 ; par2 = Double ; par3 = multiplicative ;
Parameters (R input):
par1 = 12 ; par2 = Double ; par3 = multiplicative ;
R code (references can be found in the software module):
par1 <- as.numeric(par1)
if (par2 == 'Single') K <- 1
if (par2 == 'Double') K <- 2
if (par2 == 'Triple') K <- par1
nx <- length(x)
nxmK <- nx - K
x <- ts(x, frequency = par1)
if (par2 == 'Single') fit <- HoltWinters(x, gamma=F, beta=F)
if (par2 == 'Double') fit <- HoltWinters(x, gamma=F)
if (par2 == 'Triple') fit <- HoltWinters(x, seasonal=par3)
fit
myresid <- x - fit$fitted[,'xhat']
bitmap(file='test1.png')
op <- par(mfrow=c(2,1))
plot(fit,ylab='Observed (black) / Fitted (red)',main='Interpolation Fit of Exponential Smoothing')
plot(myresid,ylab='Residuals',main='Interpolation Prediction Errors')
par(op)
dev.off()
bitmap(file='test2.png')
p <- predict(fit, par1, prediction.interval=TRUE)
np <- length(p[,1])
plot(fit,p,ylab='Observed (black) / Fitted (red)',main='Extrapolation Fit of Exponential Smoothing')
dev.off()
bitmap(file='test3.png')
op <- par(mfrow = c(2,2))
acf(as.numeric(myresid),lag.max = nx/2,main='Residual ACF')
spectrum(myresid,main='Residals Periodogram')
cpgram(myresid,main='Residal Cumulative Periodogram')
qqnorm(myresid,main='Residual Normal QQ Plot')
qqline(myresid)
par(op)
dev.off()
load(file='createtable')
a<-table.start()
a<-table.row.start(a)
a<-table.element(a,'Estimated Parameters of Exponential Smoothing',2,TRUE)
a<-table.row.end(a)
a<-table.row.start(a)
a<-table.element(a,'Parameter',header=TRUE)
a<-table.element(a,'Value',header=TRUE)
a<-table.row.end(a)
a<-table.row.start(a)
a<-table.element(a,'alpha',header=TRUE)
a<-table.element(a,fit$alpha)
a<-table.row.end(a)
a<-table.row.start(a)
a<-table.element(a,'beta',header=TRUE)
a<-table.element(a,fit$beta)
a<-table.row.end(a)
a<-table.row.start(a)
a<-table.element(a,'gamma',header=TRUE)
a<-table.element(a,fit$gamma)
a<-table.row.end(a)
a<-table.end(a)
table.save(a,file='mytable.tab')
a<-table.start()
a<-table.row.start(a)
a<-table.element(a,'Interpolation Forecasts of Exponential Smoothing',4,TRUE)
a<-table.row.end(a)
a<-table.row.start(a)
a<-table.element(a,'t',header=TRUE)
a<-table.element(a,'Observed',header=TRUE)
a<-table.element(a,'Fitted',header=TRUE)
a<-table.element(a,'Residuals',header=TRUE)
a<-table.row.end(a)
for (i in 1:nxmK) {
a<-table.row.start(a)
a<-table.element(a,i+K,header=TRUE)
a<-table.element(a,x[i+K])
a<-table.element(a,fit$fitted[i,'xhat'])
a<-table.element(a,myresid[i])
a<-table.row.end(a)
}
a<-table.end(a)
table.save(a,file='mytable1.tab')
a<-table.start()
a<-table.row.start(a)
a<-table.element(a,'Extrapolation Forecasts of Exponential Smoothing',4,TRUE)
a<-table.row.end(a)
a<-table.row.start(a)
a<-table.element(a,'t',header=TRUE)
a<-table.element(a,'Forecast',header=TRUE)
a<-table.element(a,'95% Lower Bound',header=TRUE)
a<-table.element(a,'95% Upper Bound',header=TRUE)
a<-table.row.end(a)
for (i in 1:np) {
a<-table.row.start(a)
a<-table.element(a,nx+i,header=TRUE)
a<-table.element(a,p[i,'fit'])
a<-table.element(a,p[i,'lwr'])
a<-table.element(a,p[i,'upr'])
a<-table.row.end(a)
}
a<-table.end(a)
table.save(a,file='mytable2.tab')