Free Statistics

of Irreproducible Research!

Author's title

Author*Unverified author*
R Software Modulerwasp_exponentialsmoothing.wasp
Title produced by softwareExponential Smoothing
Date of computationSun, 27 Nov 2016 16:39:52 +0000
Cite this page as followsStatistical Computations at FreeStatistics.org, Office for Research Development and Education, URL https://freestatistics.org/blog/index.php?v=date/2016/Nov/27/t1480264838hmffopa1co2fghh.htm/, Retrieved Mon, 29 Apr 2024 22:04:41 +0200
Statistical Computations at FreeStatistics.org, Office for Research Development and Education, URL https://freestatistics.org/blog/index.php?pk=, Retrieved Mon, 29 Apr 2024 22:04:41 +0200
QR Codes:

Original text written by user:
IsPrivate?No (this computation is public)
User-defined keywords
Estimated Impact0
Dataseries X:
203089
198480
192684
187827
182414
182510
211524
211451
200140
191568
186424
191987
203583
201920
195978
191395
188222
189422
214419
224325
216222
210506
207221
210027
215191
215177
211701
210176
205491
206996
235980
241292
236675
229127
225436
229570
239973
236168
230703
224790
217811
219576
245472
248511
242084
235572
229827
229697
239567
237201
233164
227755
220189
221270
245413
247826
237736
230079
225939
228987


Summary of computational transaction
Raw Inputview raw input (R code)
Raw Outputview raw output of R engine
Computing time1 seconds
R Server'Sir Maurice George Kendall' @ kendall.wessa.net

\begin{tabular}{lllllllll}
\hline
Summary of computational transaction \tabularnewline
Raw Input & view raw input (R code)  \tabularnewline
Raw Output & view raw output of R engine  \tabularnewline
Computing time & 1 seconds \tabularnewline
R Server & 'Sir Maurice George Kendall' @ kendall.wessa.net \tabularnewline
\hline
\end{tabular}
%Source: https://freestatistics.org/blog/index.php?pk=&T=0

[TABLE]
[ROW][C]Summary of computational transaction[/C][/ROW]
[ROW][C]Raw Input[/C][C]view raw input (R code) [/C][/ROW]
[ROW][C]Raw Output[/C][C]view raw output of R engine [/C][/ROW]
[ROW][C]Computing time[/C][C]1 seconds[/C][/ROW]
[ROW][C]R Server[/C][C]'Sir Maurice George Kendall' @ kendall.wessa.net[/C][/ROW]
[/TABLE]
Source: https://freestatistics.org/blog/index.php?pk=&T=0

Globally Unique Identifier (entire table): ba.freestatistics.org/blog/index.php?pk=&T=0

As an alternative you can also use a QR Code:  

The GUIDs for individual cells are displayed in the table below:

Summary of computational transaction
Raw Inputview raw input (R code)
Raw Outputview raw output of R engine
Computing time1 seconds
R Server'Sir Maurice George Kendall' @ kendall.wessa.net


Estimated Parameters of Exponential Smoothing
ParameterValue
alpha0.609997415745508
beta0
gamma1

\begin{tabular}{lllllllll}
\hline
Estimated Parameters of Exponential Smoothing \tabularnewline
Parameter & Value \tabularnewline
alpha & 0.609997415745508 \tabularnewline
beta & 0 \tabularnewline
gamma & 1 \tabularnewline
\hline
\end{tabular}
%Source: https://freestatistics.org/blog/index.php?pk=&T=1

[TABLE]
[ROW][C]Estimated Parameters of Exponential Smoothing[/C][/ROW]
[ROW][C]Parameter[/C][C]Value[/C][/ROW]
[ROW][C]alpha[/C][C]0.609997415745508[/C][/ROW]
[ROW][C]beta[/C][C]0[/C][/ROW]
[ROW][C]gamma[/C][C]1[/C][/ROW]
[/TABLE]
Source: https://freestatistics.org/blog/index.php?pk=&T=1

Globally Unique Identifier (entire table): ba.freestatistics.org/blog/index.php?pk=&T=1

As an alternative you can also use a QR Code:  

The GUIDs for individual cells are displayed in the table below:

Estimated Parameters of Exponential Smoothing
ParameterValue
alpha0.609997415745508
beta0
gamma1


Interpolation Forecasts of Exponential Smoothing
tObservedFittedResiduals
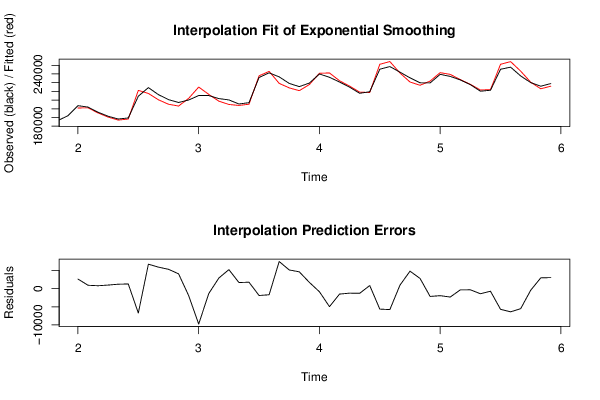
13203583200940.8036585912642.19634140879
14201920200993.261675558926.738324441569
15195978195176.754066847801.245933152939
16191395190411.964894434983.035105565679
17188222187001.7386098711220.26139012861
18189422188136.7130750891285.28692491128
19214419221138.023085531-6719.02308553079
20224325217591.6109291836733.38907081718
21216222210303.4571339855918.5428660149
22210506205183.830841475322.16915853016
23207221203139.58432744081.4156725996
24210027211923.909565214-1896.90956521383
25215191224943.975118884-9752.97511888397
26215177216538.748207711-1361.74820771089
27211701208787.0397450262913.96025497434
28210176204941.6559748415234.34402515934
29205491203811.5528131681679.44718683162
30206996205224.9571071721771.04289282847
31235980237868.941210122-1888.94121012246
32241292242979.484818895-1687.4848188945
33236675229213.7553612237461.24463877748
34229127223980.5573852375146.44261476304
35225436220812.2014799344623.79852006573
36229570227847.7564737791722.24352622067
37239973240829.064877243-856.06487724313
38236168241127.590305333-4959.59030533285
39230703232199.461879007-1496.46187900708
40224790226031.205637763-1241.2056377632
41217811219100.687764092-1289.68776409229
42219576218717.693778193858.306221807055
43245472251109.27389131-5637.27389131047
44248511254282.67136796-5771.67136796025
45242084241144.1980346939.801965400024
46235572230758.2558396394813.74416036147
47229827227015.7403599582811.25964004247
48229697231845.321014161-2148.32101416108
49239567241502.037980858-1935.03798085815
50237201239515.163254597-2314.16325459731
51233164233505.679775511-341.679775511351
52227755228073.665051186-318.665051185701
53220189221590.452486986-1401.45248698554
54221270221983.465521266-713.465521266335
55245413251108.560076728-5695.56007672759
56247826254212.759143082-6386.75914308234
57237736243259.134613382-5523.13461338202
58230079230510.723552298-431.723552297684
59225939222964.4741243412974.52587565855
60228987225944.7604135553042.23958644483

\begin{tabular}{lllllllll}
\hline
Interpolation Forecasts of Exponential Smoothing \tabularnewline
t & Observed & Fitted & Residuals \tabularnewline
13 & 203583 & 200940.803658591 & 2642.19634140879 \tabularnewline
14 & 201920 & 200993.261675558 & 926.738324441569 \tabularnewline
15 & 195978 & 195176.754066847 & 801.245933152939 \tabularnewline
16 & 191395 & 190411.964894434 & 983.035105565679 \tabularnewline
17 & 188222 & 187001.738609871 & 1220.26139012861 \tabularnewline
18 & 189422 & 188136.713075089 & 1285.28692491128 \tabularnewline
19 & 214419 & 221138.023085531 & -6719.02308553079 \tabularnewline
20 & 224325 & 217591.610929183 & 6733.38907081718 \tabularnewline
21 & 216222 & 210303.457133985 & 5918.5428660149 \tabularnewline
22 & 210506 & 205183.83084147 & 5322.16915853016 \tabularnewline
23 & 207221 & 203139.5843274 & 4081.4156725996 \tabularnewline
24 & 210027 & 211923.909565214 & -1896.90956521383 \tabularnewline
25 & 215191 & 224943.975118884 & -9752.97511888397 \tabularnewline
26 & 215177 & 216538.748207711 & -1361.74820771089 \tabularnewline
27 & 211701 & 208787.039745026 & 2913.96025497434 \tabularnewline
28 & 210176 & 204941.655974841 & 5234.34402515934 \tabularnewline
29 & 205491 & 203811.552813168 & 1679.44718683162 \tabularnewline
30 & 206996 & 205224.957107172 & 1771.04289282847 \tabularnewline
31 & 235980 & 237868.941210122 & -1888.94121012246 \tabularnewline
32 & 241292 & 242979.484818895 & -1687.4848188945 \tabularnewline
33 & 236675 & 229213.755361223 & 7461.24463877748 \tabularnewline
34 & 229127 & 223980.557385237 & 5146.44261476304 \tabularnewline
35 & 225436 & 220812.201479934 & 4623.79852006573 \tabularnewline
36 & 229570 & 227847.756473779 & 1722.24352622067 \tabularnewline
37 & 239973 & 240829.064877243 & -856.06487724313 \tabularnewline
38 & 236168 & 241127.590305333 & -4959.59030533285 \tabularnewline
39 & 230703 & 232199.461879007 & -1496.46187900708 \tabularnewline
40 & 224790 & 226031.205637763 & -1241.2056377632 \tabularnewline
41 & 217811 & 219100.687764092 & -1289.68776409229 \tabularnewline
42 & 219576 & 218717.693778193 & 858.306221807055 \tabularnewline
43 & 245472 & 251109.27389131 & -5637.27389131047 \tabularnewline
44 & 248511 & 254282.67136796 & -5771.67136796025 \tabularnewline
45 & 242084 & 241144.1980346 & 939.801965400024 \tabularnewline
46 & 235572 & 230758.255839639 & 4813.74416036147 \tabularnewline
47 & 229827 & 227015.740359958 & 2811.25964004247 \tabularnewline
48 & 229697 & 231845.321014161 & -2148.32101416108 \tabularnewline
49 & 239567 & 241502.037980858 & -1935.03798085815 \tabularnewline
50 & 237201 & 239515.163254597 & -2314.16325459731 \tabularnewline
51 & 233164 & 233505.679775511 & -341.679775511351 \tabularnewline
52 & 227755 & 228073.665051186 & -318.665051185701 \tabularnewline
53 & 220189 & 221590.452486986 & -1401.45248698554 \tabularnewline
54 & 221270 & 221983.465521266 & -713.465521266335 \tabularnewline
55 & 245413 & 251108.560076728 & -5695.56007672759 \tabularnewline
56 & 247826 & 254212.759143082 & -6386.75914308234 \tabularnewline
57 & 237736 & 243259.134613382 & -5523.13461338202 \tabularnewline
58 & 230079 & 230510.723552298 & -431.723552297684 \tabularnewline
59 & 225939 & 222964.474124341 & 2974.52587565855 \tabularnewline
60 & 228987 & 225944.760413555 & 3042.23958644483 \tabularnewline
\hline
\end{tabular}
%Source: https://freestatistics.org/blog/index.php?pk=&T=2

[TABLE]
[ROW][C]Interpolation Forecasts of Exponential Smoothing[/C][/ROW]
[ROW][C]t[/C][C]Observed[/C][C]Fitted[/C][C]Residuals[/C][/ROW]
[ROW][C]13[/C][C]203583[/C][C]200940.803658591[/C][C]2642.19634140879[/C][/ROW]
[ROW][C]14[/C][C]201920[/C][C]200993.261675558[/C][C]926.738324441569[/C][/ROW]
[ROW][C]15[/C][C]195978[/C][C]195176.754066847[/C][C]801.245933152939[/C][/ROW]
[ROW][C]16[/C][C]191395[/C][C]190411.964894434[/C][C]983.035105565679[/C][/ROW]
[ROW][C]17[/C][C]188222[/C][C]187001.738609871[/C][C]1220.26139012861[/C][/ROW]
[ROW][C]18[/C][C]189422[/C][C]188136.713075089[/C][C]1285.28692491128[/C][/ROW]
[ROW][C]19[/C][C]214419[/C][C]221138.023085531[/C][C]-6719.02308553079[/C][/ROW]
[ROW][C]20[/C][C]224325[/C][C]217591.610929183[/C][C]6733.38907081718[/C][/ROW]
[ROW][C]21[/C][C]216222[/C][C]210303.457133985[/C][C]5918.5428660149[/C][/ROW]
[ROW][C]22[/C][C]210506[/C][C]205183.83084147[/C][C]5322.16915853016[/C][/ROW]
[ROW][C]23[/C][C]207221[/C][C]203139.5843274[/C][C]4081.4156725996[/C][/ROW]
[ROW][C]24[/C][C]210027[/C][C]211923.909565214[/C][C]-1896.90956521383[/C][/ROW]
[ROW][C]25[/C][C]215191[/C][C]224943.975118884[/C][C]-9752.97511888397[/C][/ROW]
[ROW][C]26[/C][C]215177[/C][C]216538.748207711[/C][C]-1361.74820771089[/C][/ROW]
[ROW][C]27[/C][C]211701[/C][C]208787.039745026[/C][C]2913.96025497434[/C][/ROW]
[ROW][C]28[/C][C]210176[/C][C]204941.655974841[/C][C]5234.34402515934[/C][/ROW]
[ROW][C]29[/C][C]205491[/C][C]203811.552813168[/C][C]1679.44718683162[/C][/ROW]
[ROW][C]30[/C][C]206996[/C][C]205224.957107172[/C][C]1771.04289282847[/C][/ROW]
[ROW][C]31[/C][C]235980[/C][C]237868.941210122[/C][C]-1888.94121012246[/C][/ROW]
[ROW][C]32[/C][C]241292[/C][C]242979.484818895[/C][C]-1687.4848188945[/C][/ROW]
[ROW][C]33[/C][C]236675[/C][C]229213.755361223[/C][C]7461.24463877748[/C][/ROW]
[ROW][C]34[/C][C]229127[/C][C]223980.557385237[/C][C]5146.44261476304[/C][/ROW]
[ROW][C]35[/C][C]225436[/C][C]220812.201479934[/C][C]4623.79852006573[/C][/ROW]
[ROW][C]36[/C][C]229570[/C][C]227847.756473779[/C][C]1722.24352622067[/C][/ROW]
[ROW][C]37[/C][C]239973[/C][C]240829.064877243[/C][C]-856.06487724313[/C][/ROW]
[ROW][C]38[/C][C]236168[/C][C]241127.590305333[/C][C]-4959.59030533285[/C][/ROW]
[ROW][C]39[/C][C]230703[/C][C]232199.461879007[/C][C]-1496.46187900708[/C][/ROW]
[ROW][C]40[/C][C]224790[/C][C]226031.205637763[/C][C]-1241.2056377632[/C][/ROW]
[ROW][C]41[/C][C]217811[/C][C]219100.687764092[/C][C]-1289.68776409229[/C][/ROW]
[ROW][C]42[/C][C]219576[/C][C]218717.693778193[/C][C]858.306221807055[/C][/ROW]
[ROW][C]43[/C][C]245472[/C][C]251109.27389131[/C][C]-5637.27389131047[/C][/ROW]
[ROW][C]44[/C][C]248511[/C][C]254282.67136796[/C][C]-5771.67136796025[/C][/ROW]
[ROW][C]45[/C][C]242084[/C][C]241144.1980346[/C][C]939.801965400024[/C][/ROW]
[ROW][C]46[/C][C]235572[/C][C]230758.255839639[/C][C]4813.74416036147[/C][/ROW]
[ROW][C]47[/C][C]229827[/C][C]227015.740359958[/C][C]2811.25964004247[/C][/ROW]
[ROW][C]48[/C][C]229697[/C][C]231845.321014161[/C][C]-2148.32101416108[/C][/ROW]
[ROW][C]49[/C][C]239567[/C][C]241502.037980858[/C][C]-1935.03798085815[/C][/ROW]
[ROW][C]50[/C][C]237201[/C][C]239515.163254597[/C][C]-2314.16325459731[/C][/ROW]
[ROW][C]51[/C][C]233164[/C][C]233505.679775511[/C][C]-341.679775511351[/C][/ROW]
[ROW][C]52[/C][C]227755[/C][C]228073.665051186[/C][C]-318.665051185701[/C][/ROW]
[ROW][C]53[/C][C]220189[/C][C]221590.452486986[/C][C]-1401.45248698554[/C][/ROW]
[ROW][C]54[/C][C]221270[/C][C]221983.465521266[/C][C]-713.465521266335[/C][/ROW]
[ROW][C]55[/C][C]245413[/C][C]251108.560076728[/C][C]-5695.56007672759[/C][/ROW]
[ROW][C]56[/C][C]247826[/C][C]254212.759143082[/C][C]-6386.75914308234[/C][/ROW]
[ROW][C]57[/C][C]237736[/C][C]243259.134613382[/C][C]-5523.13461338202[/C][/ROW]
[ROW][C]58[/C][C]230079[/C][C]230510.723552298[/C][C]-431.723552297684[/C][/ROW]
[ROW][C]59[/C][C]225939[/C][C]222964.474124341[/C][C]2974.52587565855[/C][/ROW]
[ROW][C]60[/C][C]228987[/C][C]225944.760413555[/C][C]3042.23958644483[/C][/ROW]
[/TABLE]
Source: https://freestatistics.org/blog/index.php?pk=&T=2

Globally Unique Identifier (entire table): ba.freestatistics.org/blog/index.php?pk=&T=2

As an alternative you can also use a QR Code:  

The GUIDs for individual cells are displayed in the table below:

Interpolation Forecasts of Exponential Smoothing
tObservedFittedResiduals
13203583200940.8036585912642.19634140879
14201920200993.261675558926.738324441569
15195978195176.754066847801.245933152939
16191395190411.964894434983.035105565679
17188222187001.7386098711220.26139012861
18189422188136.7130750891285.28692491128
19214419221138.023085531-6719.02308553079
20224325217591.6109291836733.38907081718
21216222210303.4571339855918.5428660149
22210506205183.830841475322.16915853016
23207221203139.58432744081.4156725996
24210027211923.909565214-1896.90956521383
25215191224943.975118884-9752.97511888397
26215177216538.748207711-1361.74820771089
27211701208787.0397450262913.96025497434
28210176204941.6559748415234.34402515934
29205491203811.5528131681679.44718683162
30206996205224.9571071721771.04289282847
31235980237868.941210122-1888.94121012246
32241292242979.484818895-1687.4848188945
33236675229213.7553612237461.24463877748
34229127223980.5573852375146.44261476304
35225436220812.2014799344623.79852006573
36229570227847.7564737791722.24352622067
37239973240829.064877243-856.06487724313
38236168241127.590305333-4959.59030533285
39230703232199.461879007-1496.46187900708
40224790226031.205637763-1241.2056377632
41217811219100.687764092-1289.68776409229
42219576218717.693778193858.306221807055
43245472251109.27389131-5637.27389131047
44248511254282.67136796-5771.67136796025
45242084241144.1980346939.801965400024
46235572230758.2558396394813.74416036147
47229827227015.7403599582811.25964004247
48229697231845.321014161-2148.32101416108
49239567241502.037980858-1935.03798085815
50237201239515.163254597-2314.16325459731
51233164233505.679775511-341.679775511351
52227755228073.665051186-318.665051185701
53220189221590.452486986-1401.45248698554
54221270221983.465521266-713.465521266335
55245413251108.560076728-5695.56007672759
56247826254212.759143082-6386.75914308234
57237736243259.134613382-5523.13461338202
58230079230510.723552298-431.723552297684
59225939222964.4741243412974.52587565855
60228987225944.7604135553042.23958644483


Extrapolation Forecasts of Exponential Smoothing
tForecast95% Lower Bound95% Upper Bound
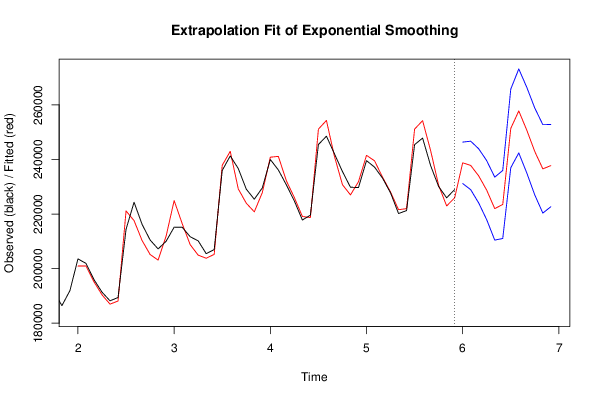
61238762.238002735231171.022356328246353.453649141
62237808.275086082228933.385277123246683.16489504
63233967.886384687224039.023415922243896.749353452
64228732.70410972217921.183375741239544.224843699
65221987.661188081210447.914131277233527.408244886
66223509.996962896211046.888955728235973.104970064
67251367.439303985236966.611152005265768.267455964
68257770.269721594242390.357125417273150.182317772
69250717.044173061235032.75463471266401.333711411
70242878.509176274226962.772970101258794.245382448
71236542.393318967220346.532260108252738.254377826
72237746.21209237222678.729074379252813.695110361

\begin{tabular}{lllllllll}
\hline
Extrapolation Forecasts of Exponential Smoothing \tabularnewline
t & Forecast & 95% Lower Bound & 95% Upper Bound \tabularnewline
61 & 238762.238002735 & 231171.022356328 & 246353.453649141 \tabularnewline
62 & 237808.275086082 & 228933.385277123 & 246683.16489504 \tabularnewline
63 & 233967.886384687 & 224039.023415922 & 243896.749353452 \tabularnewline
64 & 228732.70410972 & 217921.183375741 & 239544.224843699 \tabularnewline
65 & 221987.661188081 & 210447.914131277 & 233527.408244886 \tabularnewline
66 & 223509.996962896 & 211046.888955728 & 235973.104970064 \tabularnewline
67 & 251367.439303985 & 236966.611152005 & 265768.267455964 \tabularnewline
68 & 257770.269721594 & 242390.357125417 & 273150.182317772 \tabularnewline
69 & 250717.044173061 & 235032.75463471 & 266401.333711411 \tabularnewline
70 & 242878.509176274 & 226962.772970101 & 258794.245382448 \tabularnewline
71 & 236542.393318967 & 220346.532260108 & 252738.254377826 \tabularnewline
72 & 237746.21209237 & 222678.729074379 & 252813.695110361 \tabularnewline
\hline
\end{tabular}
%Source: https://freestatistics.org/blog/index.php?pk=&T=3

[TABLE]
[ROW][C]Extrapolation Forecasts of Exponential Smoothing[/C][/ROW]
[ROW][C]t[/C][C]Forecast[/C][C]95% Lower Bound[/C][C]95% Upper Bound[/C][/ROW]
[ROW][C]61[/C][C]238762.238002735[/C][C]231171.022356328[/C][C]246353.453649141[/C][/ROW]
[ROW][C]62[/C][C]237808.275086082[/C][C]228933.385277123[/C][C]246683.16489504[/C][/ROW]
[ROW][C]63[/C][C]233967.886384687[/C][C]224039.023415922[/C][C]243896.749353452[/C][/ROW]
[ROW][C]64[/C][C]228732.70410972[/C][C]217921.183375741[/C][C]239544.224843699[/C][/ROW]
[ROW][C]65[/C][C]221987.661188081[/C][C]210447.914131277[/C][C]233527.408244886[/C][/ROW]
[ROW][C]66[/C][C]223509.996962896[/C][C]211046.888955728[/C][C]235973.104970064[/C][/ROW]
[ROW][C]67[/C][C]251367.439303985[/C][C]236966.611152005[/C][C]265768.267455964[/C][/ROW]
[ROW][C]68[/C][C]257770.269721594[/C][C]242390.357125417[/C][C]273150.182317772[/C][/ROW]
[ROW][C]69[/C][C]250717.044173061[/C][C]235032.75463471[/C][C]266401.333711411[/C][/ROW]
[ROW][C]70[/C][C]242878.509176274[/C][C]226962.772970101[/C][C]258794.245382448[/C][/ROW]
[ROW][C]71[/C][C]236542.393318967[/C][C]220346.532260108[/C][C]252738.254377826[/C][/ROW]
[ROW][C]72[/C][C]237746.21209237[/C][C]222678.729074379[/C][C]252813.695110361[/C][/ROW]
[/TABLE]
Source: https://freestatistics.org/blog/index.php?pk=&T=3

Globally Unique Identifier (entire table): ba.freestatistics.org/blog/index.php?pk=&T=3

As an alternative you can also use a QR Code:  

The GUIDs for individual cells are displayed in the table below:

Extrapolation Forecasts of Exponential Smoothing
tForecast95% Lower Bound95% Upper Bound
61238762.238002735231171.022356328246353.453649141
62237808.275086082228933.385277123246683.16489504
63233967.886384687224039.023415922243896.749353452
64228732.70410972217921.183375741239544.224843699
65221987.661188081210447.914131277233527.408244886
66223509.996962896211046.888955728235973.104970064
67251367.439303985236966.611152005265768.267455964
68257770.269721594242390.357125417273150.182317772
69250717.044173061235032.75463471266401.333711411
70242878.509176274226962.772970101258794.245382448
71236542.393318967220346.532260108252738.254377826
72237746.21209237222678.729074379252813.695110361


Parameters (Session):
par1 = 12 ; par2 = Triple ; par3 = multiplicative ;
Parameters (R input):
par1 = 12 ; par2 = Triple ; par3 = multiplicative ;
R code (references can be found in the software module):
par1 <- as.numeric(par1)
if (par2 == 'Single') K <- 1
if (par2 == 'Double') K <- 2
if (par2 == 'Triple') K <- par1
nx <- length(x)
nxmK <- nx - K
x <- ts(x, frequency = par1)
if (par2 == 'Single') fit <- HoltWinters(x, gamma=F, beta=F)
if (par2 == 'Double') fit <- HoltWinters(x, gamma=F)
if (par2 == 'Triple') fit <- HoltWinters(x, seasonal=par3)
fit
myresid <- x - fit$fitted[,'xhat']
bitmap(file='test1.png')
op <- par(mfrow=c(2,1))
plot(fit,ylab='Observed (black) / Fitted (red)',main='Interpolation Fit of Exponential Smoothing')
plot(myresid,ylab='Residuals',main='Interpolation Prediction Errors')
par(op)
dev.off()
bitmap(file='test2.png')
p <- predict(fit, par1, prediction.interval=TRUE)
np <- length(p[,1])
plot(fit,p,ylab='Observed (black) / Fitted (red)',main='Extrapolation Fit of Exponential Smoothing')
dev.off()
bitmap(file='test3.png')
op <- par(mfrow = c(2,2))
acf(as.numeric(myresid),lag.max = nx/2,main='Residual ACF')
spectrum(myresid,main='Residals Periodogram')
cpgram(myresid,main='Residal Cumulative Periodogram')
qqnorm(myresid,main='Residual Normal QQ Plot')
qqline(myresid)
par(op)
dev.off()
load(file='createtable')
a<-table.start()
a<-table.row.start(a)
a<-table.element(a,'Estimated Parameters of Exponential Smoothing',2,TRUE)
a<-table.row.end(a)
a<-table.row.start(a)
a<-table.element(a,'Parameter',header=TRUE)
a<-table.element(a,'Value',header=TRUE)
a<-table.row.end(a)
a<-table.row.start(a)
a<-table.element(a,'alpha',header=TRUE)
a<-table.element(a,fit$alpha)
a<-table.row.end(a)
a<-table.row.start(a)
a<-table.element(a,'beta',header=TRUE)
a<-table.element(a,fit$beta)
a<-table.row.end(a)
a<-table.row.start(a)
a<-table.element(a,'gamma',header=TRUE)
a<-table.element(a,fit$gamma)
a<-table.row.end(a)
a<-table.end(a)
table.save(a,file='mytable.tab')
a<-table.start()
a<-table.row.start(a)
a<-table.element(a,'Interpolation Forecasts of Exponential Smoothing',4,TRUE)
a<-table.row.end(a)
a<-table.row.start(a)
a<-table.element(a,'t',header=TRUE)
a<-table.element(a,'Observed',header=TRUE)
a<-table.element(a,'Fitted',header=TRUE)
a<-table.element(a,'Residuals',header=TRUE)
a<-table.row.end(a)
for (i in 1:nxmK) {
a<-table.row.start(a)
a<-table.element(a,i+K,header=TRUE)
a<-table.element(a,x[i+K])
a<-table.element(a,fit$fitted[i,'xhat'])
a<-table.element(a,myresid[i])
a<-table.row.end(a)
}
a<-table.end(a)
table.save(a,file='mytable1.tab')
a<-table.start()
a<-table.row.start(a)
a<-table.element(a,'Extrapolation Forecasts of Exponential Smoothing',4,TRUE)
a<-table.row.end(a)
a<-table.row.start(a)
a<-table.element(a,'t',header=TRUE)
a<-table.element(a,'Forecast',header=TRUE)
a<-table.element(a,'95% Lower Bound',header=TRUE)
a<-table.element(a,'95% Upper Bound',header=TRUE)
a<-table.row.end(a)
for (i in 1:np) {
a<-table.row.start(a)
a<-table.element(a,nx+i,header=TRUE)
a<-table.element(a,p[i,'fit'])
a<-table.element(a,p[i,'lwr'])
a<-table.element(a,p[i,'upr'])
a<-table.row.end(a)
}
a<-table.end(a)
table.save(a,file='mytable2.tab')