Free Statistics

of Irreproducible Research!

Author's title

Author*Unverified author*
R Software Modulerwasp_exponentialsmoothing.wasp
Title produced by softwareExponential Smoothing
Date of computationMon, 28 Nov 2016 16:15:56 +0000
Cite this page as followsStatistical Computations at FreeStatistics.org, Office for Research Development and Education, URL https://freestatistics.org/blog/index.php?v=date/2016/Nov/28/t14803498672mgpmef9zs2t977.htm/, Retrieved Sat, 04 May 2024 16:28:38 +0200
Statistical Computations at FreeStatistics.org, Office for Research Development and Education, URL https://freestatistics.org/blog/index.php?pk=, Retrieved Sat, 04 May 2024 16:28:38 +0200
QR Codes:

Original text written by user:
IsPrivate?No (this computation is public)
User-defined keywords
Estimated Impact0
Dataseries X:
99,6
96,1
109
99,5
104,6
99,9
94,1
105,3
110,4
110,5
110
108,5
101,5
99
106,2
97,6
103,7
103,4
99,9
105
103,4
117,8
110,6
102
105,1
98,5
104,4
103,9
105,8
100,3
106,3
101,4
104,3
114,6
105
103,4
102,9
96,4
102,6
104,7
100,8
102,1
101,1
98,1
109,2
114,4
104
107,2
101,3
98,1
109,6
105,9
99,5
109,9
105,3
102,5
111,9
118
112,1
113,8


Summary of computational transaction
Raw Inputview raw input (R code)
Raw Outputview raw output of R engine
Computing time1 seconds
R Server'Gwilym Jenkins' @ jenkins.wessa.net

\begin{tabular}{lllllllll}
\hline
Summary of computational transaction \tabularnewline
Raw Input & view raw input (R code)  \tabularnewline
Raw Output & view raw output of R engine  \tabularnewline
Computing time & 1 seconds \tabularnewline
R Server & 'Gwilym Jenkins' @ jenkins.wessa.net \tabularnewline
\hline
\end{tabular}
%Source: https://freestatistics.org/blog/index.php?pk=&T=0

[TABLE]
[ROW][C]Summary of computational transaction[/C][/ROW]
[ROW][C]Raw Input[/C][C]view raw input (R code) [/C][/ROW]
[ROW][C]Raw Output[/C][C]view raw output of R engine [/C][/ROW]
[ROW][C]Computing time[/C][C]1 seconds[/C][/ROW]
[ROW][C]R Server[/C][C]'Gwilym Jenkins' @ jenkins.wessa.net[/C][/ROW]
[/TABLE]
Source: https://freestatistics.org/blog/index.php?pk=&T=0

Globally Unique Identifier (entire table): ba.freestatistics.org/blog/index.php?pk=&T=0

As an alternative you can also use a QR Code:  

The GUIDs for individual cells are displayed in the table below:

Summary of computational transaction
Raw Inputview raw input (R code)
Raw Outputview raw output of R engine
Computing time1 seconds
R Server'Gwilym Jenkins' @ jenkins.wessa.net


Estimated Parameters of Exponential Smoothing
ParameterValue
alpha0.116260861139079
beta0
gamma1

\begin{tabular}{lllllllll}
\hline
Estimated Parameters of Exponential Smoothing \tabularnewline
Parameter & Value \tabularnewline
alpha & 0.116260861139079 \tabularnewline
beta & 0 \tabularnewline
gamma & 1 \tabularnewline
\hline
\end{tabular}
%Source: https://freestatistics.org/blog/index.php?pk=&T=1

[TABLE]
[ROW][C]Estimated Parameters of Exponential Smoothing[/C][/ROW]
[ROW][C]Parameter[/C][C]Value[/C][/ROW]
[ROW][C]alpha[/C][C]0.116260861139079[/C][/ROW]
[ROW][C]beta[/C][C]0[/C][/ROW]
[ROW][C]gamma[/C][C]1[/C][/ROW]
[/TABLE]
Source: https://freestatistics.org/blog/index.php?pk=&T=1

Globally Unique Identifier (entire table): ba.freestatistics.org/blog/index.php?pk=&T=1

As an alternative you can also use a QR Code:  

The GUIDs for individual cells are displayed in the table below:

Estimated Parameters of Exponential Smoothing
ParameterValue
alpha0.116260861139079
beta0
gamma1


Interpolation Forecasts of Exponential Smoothing
tObservedFittedResiduals
13101.5101.2115391615530.288460838447179
149998.57983680883670.420163191163311
15106.2106.1581941867870.0418058132132586
1697.697.59857419595010.00142580404984471
17103.7103.4194461314960.280553868504001
18103.4103.442374577409-0.042374577408637
1999.994.54630504827595.35369495172408
20105106.339358887778-1.33935888777788
21103.4111.372061853047-7.97206185304687
22117.8110.8035404440096.99645955599117
23110.6111.286669340043-0.686669340042727
24102109.625465203923-7.62546520392289
25105.1101.6472794412983.45272055870196
2698.599.4856408562672-0.985640856267239
27104.4106.592974120275-2.1929741202753
28103.997.72661709425456.17338290574548
29105.8104.5637266010211.23627339897942
30100.3104.409060303819-4.10906030381892
31106.399.75639523735676.54360476264327
32101.4105.803305781248-4.40330578124849
33104.3104.556927883011-0.256927883011102
34114.6118.215608216813-3.61560821681304
35105110.67494048144-5.67494048144049
36103.4102.2880905221881.11190947781203
37102.9105.114742047132-2.2147420471323
3896.498.3859254334453-1.98592543344533
39102.6104.283976779767-1.68397677976705
40104.7102.8345931381931.86540686180697
41100.8104.792293485608-3.99229348560787
42102.199.35990594465682.74009405534323
43101.1104.84203847114-3.74203847114045
4498.1100.079288485198-1.9792884851984
45109.2102.7348870025526.46511299744786
46114.4114.1123571347430.287642865256615
47104105.211236487002-1.21123648700197
48107.2103.3387133845853.8612866154153
49101.3103.53920976453-2.2392097645301
5098.196.98237545162921.11762454837083
51109.6103.5521872154956.04781278450545
52105.9106.164528746254-0.264528746253959
5399.5102.634331955495-3.13433195549453
54109.9103.2571517163896.64284828361114
55105.3103.4389224746541.86107752534593
56102.5100.8101356627731.68986433722716
57111.9111.6173824465310.282617553469294
58118116.9314904265741.06850957342621
59112.1106.5558166406365.54418335936433
60113.8110.0194326740253.78056732597499

\begin{tabular}{lllllllll}
\hline
Interpolation Forecasts of Exponential Smoothing \tabularnewline
t & Observed & Fitted & Residuals \tabularnewline
13 & 101.5 & 101.211539161553 & 0.288460838447179 \tabularnewline
14 & 99 & 98.5798368088367 & 0.420163191163311 \tabularnewline
15 & 106.2 & 106.158194186787 & 0.0418058132132586 \tabularnewline
16 & 97.6 & 97.5985741959501 & 0.00142580404984471 \tabularnewline
17 & 103.7 & 103.419446131496 & 0.280553868504001 \tabularnewline
18 & 103.4 & 103.442374577409 & -0.042374577408637 \tabularnewline
19 & 99.9 & 94.5463050482759 & 5.35369495172408 \tabularnewline
20 & 105 & 106.339358887778 & -1.33935888777788 \tabularnewline
21 & 103.4 & 111.372061853047 & -7.97206185304687 \tabularnewline
22 & 117.8 & 110.803540444009 & 6.99645955599117 \tabularnewline
23 & 110.6 & 111.286669340043 & -0.686669340042727 \tabularnewline
24 & 102 & 109.625465203923 & -7.62546520392289 \tabularnewline
25 & 105.1 & 101.647279441298 & 3.45272055870196 \tabularnewline
26 & 98.5 & 99.4856408562672 & -0.985640856267239 \tabularnewline
27 & 104.4 & 106.592974120275 & -2.1929741202753 \tabularnewline
28 & 103.9 & 97.7266170942545 & 6.17338290574548 \tabularnewline
29 & 105.8 & 104.563726601021 & 1.23627339897942 \tabularnewline
30 & 100.3 & 104.409060303819 & -4.10906030381892 \tabularnewline
31 & 106.3 & 99.7563952373567 & 6.54360476264327 \tabularnewline
32 & 101.4 & 105.803305781248 & -4.40330578124849 \tabularnewline
33 & 104.3 & 104.556927883011 & -0.256927883011102 \tabularnewline
34 & 114.6 & 118.215608216813 & -3.61560821681304 \tabularnewline
35 & 105 & 110.67494048144 & -5.67494048144049 \tabularnewline
36 & 103.4 & 102.288090522188 & 1.11190947781203 \tabularnewline
37 & 102.9 & 105.114742047132 & -2.2147420471323 \tabularnewline
38 & 96.4 & 98.3859254334453 & -1.98592543344533 \tabularnewline
39 & 102.6 & 104.283976779767 & -1.68397677976705 \tabularnewline
40 & 104.7 & 102.834593138193 & 1.86540686180697 \tabularnewline
41 & 100.8 & 104.792293485608 & -3.99229348560787 \tabularnewline
42 & 102.1 & 99.3599059446568 & 2.74009405534323 \tabularnewline
43 & 101.1 & 104.84203847114 & -3.74203847114045 \tabularnewline
44 & 98.1 & 100.079288485198 & -1.9792884851984 \tabularnewline
45 & 109.2 & 102.734887002552 & 6.46511299744786 \tabularnewline
46 & 114.4 & 114.112357134743 & 0.287642865256615 \tabularnewline
47 & 104 & 105.211236487002 & -1.21123648700197 \tabularnewline
48 & 107.2 & 103.338713384585 & 3.8612866154153 \tabularnewline
49 & 101.3 & 103.53920976453 & -2.2392097645301 \tabularnewline
50 & 98.1 & 96.9823754516292 & 1.11762454837083 \tabularnewline
51 & 109.6 & 103.552187215495 & 6.04781278450545 \tabularnewline
52 & 105.9 & 106.164528746254 & -0.264528746253959 \tabularnewline
53 & 99.5 & 102.634331955495 & -3.13433195549453 \tabularnewline
54 & 109.9 & 103.257151716389 & 6.64284828361114 \tabularnewline
55 & 105.3 & 103.438922474654 & 1.86107752534593 \tabularnewline
56 & 102.5 & 100.810135662773 & 1.68986433722716 \tabularnewline
57 & 111.9 & 111.617382446531 & 0.282617553469294 \tabularnewline
58 & 118 & 116.931490426574 & 1.06850957342621 \tabularnewline
59 & 112.1 & 106.555816640636 & 5.54418335936433 \tabularnewline
60 & 113.8 & 110.019432674025 & 3.78056732597499 \tabularnewline
\hline
\end{tabular}
%Source: https://freestatistics.org/blog/index.php?pk=&T=2

[TABLE]
[ROW][C]Interpolation Forecasts of Exponential Smoothing[/C][/ROW]
[ROW][C]t[/C][C]Observed[/C][C]Fitted[/C][C]Residuals[/C][/ROW]
[ROW][C]13[/C][C]101.5[/C][C]101.211539161553[/C][C]0.288460838447179[/C][/ROW]
[ROW][C]14[/C][C]99[/C][C]98.5798368088367[/C][C]0.420163191163311[/C][/ROW]
[ROW][C]15[/C][C]106.2[/C][C]106.158194186787[/C][C]0.0418058132132586[/C][/ROW]
[ROW][C]16[/C][C]97.6[/C][C]97.5985741959501[/C][C]0.00142580404984471[/C][/ROW]
[ROW][C]17[/C][C]103.7[/C][C]103.419446131496[/C][C]0.280553868504001[/C][/ROW]
[ROW][C]18[/C][C]103.4[/C][C]103.442374577409[/C][C]-0.042374577408637[/C][/ROW]
[ROW][C]19[/C][C]99.9[/C][C]94.5463050482759[/C][C]5.35369495172408[/C][/ROW]
[ROW][C]20[/C][C]105[/C][C]106.339358887778[/C][C]-1.33935888777788[/C][/ROW]
[ROW][C]21[/C][C]103.4[/C][C]111.372061853047[/C][C]-7.97206185304687[/C][/ROW]
[ROW][C]22[/C][C]117.8[/C][C]110.803540444009[/C][C]6.99645955599117[/C][/ROW]
[ROW][C]23[/C][C]110.6[/C][C]111.286669340043[/C][C]-0.686669340042727[/C][/ROW]
[ROW][C]24[/C][C]102[/C][C]109.625465203923[/C][C]-7.62546520392289[/C][/ROW]
[ROW][C]25[/C][C]105.1[/C][C]101.647279441298[/C][C]3.45272055870196[/C][/ROW]
[ROW][C]26[/C][C]98.5[/C][C]99.4856408562672[/C][C]-0.985640856267239[/C][/ROW]
[ROW][C]27[/C][C]104.4[/C][C]106.592974120275[/C][C]-2.1929741202753[/C][/ROW]
[ROW][C]28[/C][C]103.9[/C][C]97.7266170942545[/C][C]6.17338290574548[/C][/ROW]
[ROW][C]29[/C][C]105.8[/C][C]104.563726601021[/C][C]1.23627339897942[/C][/ROW]
[ROW][C]30[/C][C]100.3[/C][C]104.409060303819[/C][C]-4.10906030381892[/C][/ROW]
[ROW][C]31[/C][C]106.3[/C][C]99.7563952373567[/C][C]6.54360476264327[/C][/ROW]
[ROW][C]32[/C][C]101.4[/C][C]105.803305781248[/C][C]-4.40330578124849[/C][/ROW]
[ROW][C]33[/C][C]104.3[/C][C]104.556927883011[/C][C]-0.256927883011102[/C][/ROW]
[ROW][C]34[/C][C]114.6[/C][C]118.215608216813[/C][C]-3.61560821681304[/C][/ROW]
[ROW][C]35[/C][C]105[/C][C]110.67494048144[/C][C]-5.67494048144049[/C][/ROW]
[ROW][C]36[/C][C]103.4[/C][C]102.288090522188[/C][C]1.11190947781203[/C][/ROW]
[ROW][C]37[/C][C]102.9[/C][C]105.114742047132[/C][C]-2.2147420471323[/C][/ROW]
[ROW][C]38[/C][C]96.4[/C][C]98.3859254334453[/C][C]-1.98592543344533[/C][/ROW]
[ROW][C]39[/C][C]102.6[/C][C]104.283976779767[/C][C]-1.68397677976705[/C][/ROW]
[ROW][C]40[/C][C]104.7[/C][C]102.834593138193[/C][C]1.86540686180697[/C][/ROW]
[ROW][C]41[/C][C]100.8[/C][C]104.792293485608[/C][C]-3.99229348560787[/C][/ROW]
[ROW][C]42[/C][C]102.1[/C][C]99.3599059446568[/C][C]2.74009405534323[/C][/ROW]
[ROW][C]43[/C][C]101.1[/C][C]104.84203847114[/C][C]-3.74203847114045[/C][/ROW]
[ROW][C]44[/C][C]98.1[/C][C]100.079288485198[/C][C]-1.9792884851984[/C][/ROW]
[ROW][C]45[/C][C]109.2[/C][C]102.734887002552[/C][C]6.46511299744786[/C][/ROW]
[ROW][C]46[/C][C]114.4[/C][C]114.112357134743[/C][C]0.287642865256615[/C][/ROW]
[ROW][C]47[/C][C]104[/C][C]105.211236487002[/C][C]-1.21123648700197[/C][/ROW]
[ROW][C]48[/C][C]107.2[/C][C]103.338713384585[/C][C]3.8612866154153[/C][/ROW]
[ROW][C]49[/C][C]101.3[/C][C]103.53920976453[/C][C]-2.2392097645301[/C][/ROW]
[ROW][C]50[/C][C]98.1[/C][C]96.9823754516292[/C][C]1.11762454837083[/C][/ROW]
[ROW][C]51[/C][C]109.6[/C][C]103.552187215495[/C][C]6.04781278450545[/C][/ROW]
[ROW][C]52[/C][C]105.9[/C][C]106.164528746254[/C][C]-0.264528746253959[/C][/ROW]
[ROW][C]53[/C][C]99.5[/C][C]102.634331955495[/C][C]-3.13433195549453[/C][/ROW]
[ROW][C]54[/C][C]109.9[/C][C]103.257151716389[/C][C]6.64284828361114[/C][/ROW]
[ROW][C]55[/C][C]105.3[/C][C]103.438922474654[/C][C]1.86107752534593[/C][/ROW]
[ROW][C]56[/C][C]102.5[/C][C]100.810135662773[/C][C]1.68986433722716[/C][/ROW]
[ROW][C]57[/C][C]111.9[/C][C]111.617382446531[/C][C]0.282617553469294[/C][/ROW]
[ROW][C]58[/C][C]118[/C][C]116.931490426574[/C][C]1.06850957342621[/C][/ROW]
[ROW][C]59[/C][C]112.1[/C][C]106.555816640636[/C][C]5.54418335936433[/C][/ROW]
[ROW][C]60[/C][C]113.8[/C][C]110.019432674025[/C][C]3.78056732597499[/C][/ROW]
[/TABLE]
Source: https://freestatistics.org/blog/index.php?pk=&T=2

Globally Unique Identifier (entire table): ba.freestatistics.org/blog/index.php?pk=&T=2

As an alternative you can also use a QR Code:  

The GUIDs for individual cells are displayed in the table below:

Interpolation Forecasts of Exponential Smoothing
tObservedFittedResiduals
13101.5101.2115391615530.288460838447179
149998.57983680883670.420163191163311
15106.2106.1581941867870.0418058132132586
1697.697.59857419595010.00142580404984471
17103.7103.4194461314960.280553868504001
18103.4103.442374577409-0.042374577408637
1999.994.54630504827595.35369495172408
20105106.339358887778-1.33935888777788
21103.4111.372061853047-7.97206185304687
22117.8110.8035404440096.99645955599117
23110.6111.286669340043-0.686669340042727
24102109.625465203923-7.62546520392289
25105.1101.6472794412983.45272055870196
2698.599.4856408562672-0.985640856267239
27104.4106.592974120275-2.1929741202753
28103.997.72661709425456.17338290574548
29105.8104.5637266010211.23627339897942
30100.3104.409060303819-4.10906030381892
31106.399.75639523735676.54360476264327
32101.4105.803305781248-4.40330578124849
33104.3104.556927883011-0.256927883011102
34114.6118.215608216813-3.61560821681304
35105110.67494048144-5.67494048144049
36103.4102.2880905221881.11190947781203
37102.9105.114742047132-2.2147420471323
3896.498.3859254334453-1.98592543344533
39102.6104.283976779767-1.68397677976705
40104.7102.8345931381931.86540686180697
41100.8104.792293485608-3.99229348560787
42102.199.35990594465682.74009405534323
43101.1104.84203847114-3.74203847114045
4498.1100.079288485198-1.9792884851984
45109.2102.7348870025526.46511299744786
46114.4114.1123571347430.287642865256615
47104105.211236487002-1.21123648700197
48107.2103.3387133845853.8612866154153
49101.3103.53920976453-2.2392097645301
5098.196.98237545162921.11762454837083
51109.6103.5521872154956.04781278450545
52105.9106.164528746254-0.264528746253959
5399.5102.634331955495-3.13433195549453
54109.9103.2571517163896.64284828361114
55105.3103.4389224746541.86107752534593
56102.5100.8101356627731.68986433722716
57111.9111.6173824465310.282617553469294
58118116.9314904265741.06850957342621
59112.1106.5558166406365.54418335936433
60113.8110.0194326740253.78056732597499


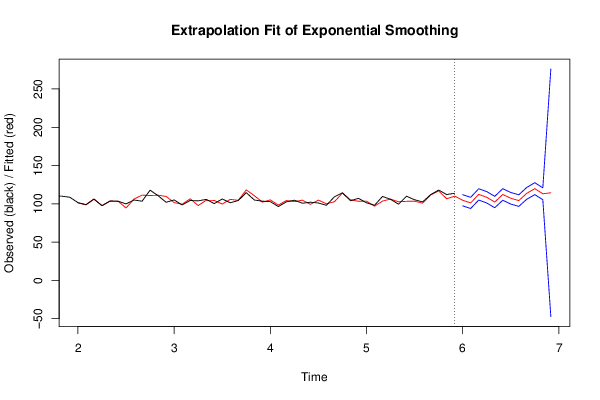
Extrapolation Forecasts of Exponential Smoothing
tForecast95% Lower Bound95% Upper Bound
61104.6413186893797.3795641133143111.903073265426
62101.19872552371593.8912538762224108.506197171208
63112.297915753325104.920282524586119.675548982065
64108.537113958604101.122154716392115.952073200817
65102.33999037298694.8993190782762109.780661667697
66112.196265971714104.663149148313119.729382795115
67107.27478101485999.7215559895269114.828006040192
68104.21831101467496.6369356748015111.799686354546
69113.74158052216106.04565781674121.437503227579
70119.813824440434112.021322387461127.606326493408
71113.137984939153105.360689484467120.915280393839
72114.396246540096-47.3694733110359276.161966391227

\begin{tabular}{lllllllll}
\hline
Extrapolation Forecasts of Exponential Smoothing \tabularnewline
t & Forecast & 95% Lower Bound & 95% Upper Bound \tabularnewline
61 & 104.64131868937 & 97.3795641133143 & 111.903073265426 \tabularnewline
62 & 101.198725523715 & 93.8912538762224 & 108.506197171208 \tabularnewline
63 & 112.297915753325 & 104.920282524586 & 119.675548982065 \tabularnewline
64 & 108.537113958604 & 101.122154716392 & 115.952073200817 \tabularnewline
65 & 102.339990372986 & 94.8993190782762 & 109.780661667697 \tabularnewline
66 & 112.196265971714 & 104.663149148313 & 119.729382795115 \tabularnewline
67 & 107.274781014859 & 99.7215559895269 & 114.828006040192 \tabularnewline
68 & 104.218311014674 & 96.6369356748015 & 111.799686354546 \tabularnewline
69 & 113.74158052216 & 106.04565781674 & 121.437503227579 \tabularnewline
70 & 119.813824440434 & 112.021322387461 & 127.606326493408 \tabularnewline
71 & 113.137984939153 & 105.360689484467 & 120.915280393839 \tabularnewline
72 & 114.396246540096 & -47.3694733110359 & 276.161966391227 \tabularnewline
\hline
\end{tabular}
%Source: https://freestatistics.org/blog/index.php?pk=&T=3

[TABLE]
[ROW][C]Extrapolation Forecasts of Exponential Smoothing[/C][/ROW]
[ROW][C]t[/C][C]Forecast[/C][C]95% Lower Bound[/C][C]95% Upper Bound[/C][/ROW]
[ROW][C]61[/C][C]104.64131868937[/C][C]97.3795641133143[/C][C]111.903073265426[/C][/ROW]
[ROW][C]62[/C][C]101.198725523715[/C][C]93.8912538762224[/C][C]108.506197171208[/C][/ROW]
[ROW][C]63[/C][C]112.297915753325[/C][C]104.920282524586[/C][C]119.675548982065[/C][/ROW]
[ROW][C]64[/C][C]108.537113958604[/C][C]101.122154716392[/C][C]115.952073200817[/C][/ROW]
[ROW][C]65[/C][C]102.339990372986[/C][C]94.8993190782762[/C][C]109.780661667697[/C][/ROW]
[ROW][C]66[/C][C]112.196265971714[/C][C]104.663149148313[/C][C]119.729382795115[/C][/ROW]
[ROW][C]67[/C][C]107.274781014859[/C][C]99.7215559895269[/C][C]114.828006040192[/C][/ROW]
[ROW][C]68[/C][C]104.218311014674[/C][C]96.6369356748015[/C][C]111.799686354546[/C][/ROW]
[ROW][C]69[/C][C]113.74158052216[/C][C]106.04565781674[/C][C]121.437503227579[/C][/ROW]
[ROW][C]70[/C][C]119.813824440434[/C][C]112.021322387461[/C][C]127.606326493408[/C][/ROW]
[ROW][C]71[/C][C]113.137984939153[/C][C]105.360689484467[/C][C]120.915280393839[/C][/ROW]
[ROW][C]72[/C][C]114.396246540096[/C][C]-47.3694733110359[/C][C]276.161966391227[/C][/ROW]
[/TABLE]
Source: https://freestatistics.org/blog/index.php?pk=&T=3

Globally Unique Identifier (entire table): ba.freestatistics.org/blog/index.php?pk=&T=3

As an alternative you can also use a QR Code:  

The GUIDs for individual cells are displayed in the table below:

Extrapolation Forecasts of Exponential Smoothing
tForecast95% Lower Bound95% Upper Bound
61104.6413186893797.3795641133143111.903073265426
62101.19872552371593.8912538762224108.506197171208
63112.297915753325104.920282524586119.675548982065
64108.537113958604101.122154716392115.952073200817
65102.33999037298694.8993190782762109.780661667697
66112.196265971714104.663149148313119.729382795115
67107.27478101485999.7215559895269114.828006040192
68104.21831101467496.6369356748015111.799686354546
69113.74158052216106.04565781674121.437503227579
70119.813824440434112.021322387461127.606326493408
71113.137984939153105.360689484467120.915280393839
72114.396246540096-47.3694733110359276.161966391227


Parameters (Session):
par1 = 12 ; par2 = Triple ; par3 = multiplicative ;
Parameters (R input):
par1 = 12 ; par2 = Triple ; par3 = multiplicative ;
R code (references can be found in the software module):
par1 <- as.numeric(par1)
if (par2 == 'Single') K <- 1
if (par2 == 'Double') K <- 2
if (par2 == 'Triple') K <- par1
nx <- length(x)
nxmK <- nx - K
x <- ts(x, frequency = par1)
if (par2 == 'Single') fit <- HoltWinters(x, gamma=F, beta=F)
if (par2 == 'Double') fit <- HoltWinters(x, gamma=F)
if (par2 == 'Triple') fit <- HoltWinters(x, seasonal=par3)
fit
myresid <- x - fit$fitted[,'xhat']
bitmap(file='test1.png')
op <- par(mfrow=c(2,1))
plot(fit,ylab='Observed (black) / Fitted (red)',main='Interpolation Fit of Exponential Smoothing')
plot(myresid,ylab='Residuals',main='Interpolation Prediction Errors')
par(op)
dev.off()
bitmap(file='test2.png')
p <- predict(fit, par1, prediction.interval=TRUE)
np <- length(p[,1])
plot(fit,p,ylab='Observed (black) / Fitted (red)',main='Extrapolation Fit of Exponential Smoothing')
dev.off()
bitmap(file='test3.png')
op <- par(mfrow = c(2,2))
acf(as.numeric(myresid),lag.max = nx/2,main='Residual ACF')
spectrum(myresid,main='Residals Periodogram')
cpgram(myresid,main='Residal Cumulative Periodogram')
qqnorm(myresid,main='Residual Normal QQ Plot')
qqline(myresid)
par(op)
dev.off()
load(file='createtable')
a<-table.start()
a<-table.row.start(a)
a<-table.element(a,'Estimated Parameters of Exponential Smoothing',2,TRUE)
a<-table.row.end(a)
a<-table.row.start(a)
a<-table.element(a,'Parameter',header=TRUE)
a<-table.element(a,'Value',header=TRUE)
a<-table.row.end(a)
a<-table.row.start(a)
a<-table.element(a,'alpha',header=TRUE)
a<-table.element(a,fit$alpha)
a<-table.row.end(a)
a<-table.row.start(a)
a<-table.element(a,'beta',header=TRUE)
a<-table.element(a,fit$beta)
a<-table.row.end(a)
a<-table.row.start(a)
a<-table.element(a,'gamma',header=TRUE)
a<-table.element(a,fit$gamma)
a<-table.row.end(a)
a<-table.end(a)
table.save(a,file='mytable.tab')
a<-table.start()
a<-table.row.start(a)
a<-table.element(a,'Interpolation Forecasts of Exponential Smoothing',4,TRUE)
a<-table.row.end(a)
a<-table.row.start(a)
a<-table.element(a,'t',header=TRUE)
a<-table.element(a,'Observed',header=TRUE)
a<-table.element(a,'Fitted',header=TRUE)
a<-table.element(a,'Residuals',header=TRUE)
a<-table.row.end(a)
for (i in 1:nxmK) {
a<-table.row.start(a)
a<-table.element(a,i+K,header=TRUE)
a<-table.element(a,x[i+K])
a<-table.element(a,fit$fitted[i,'xhat'])
a<-table.element(a,myresid[i])
a<-table.row.end(a)
}
a<-table.end(a)
table.save(a,file='mytable1.tab')
a<-table.start()
a<-table.row.start(a)
a<-table.element(a,'Extrapolation Forecasts of Exponential Smoothing',4,TRUE)
a<-table.row.end(a)
a<-table.row.start(a)
a<-table.element(a,'t',header=TRUE)
a<-table.element(a,'Forecast',header=TRUE)
a<-table.element(a,'95% Lower Bound',header=TRUE)
a<-table.element(a,'95% Upper Bound',header=TRUE)
a<-table.row.end(a)
for (i in 1:np) {
a<-table.row.start(a)
a<-table.element(a,nx+i,header=TRUE)
a<-table.element(a,p[i,'fit'])
a<-table.element(a,p[i,'lwr'])
a<-table.element(a,p[i,'upr'])
a<-table.row.end(a)
}
a<-table.end(a)
table.save(a,file='mytable2.tab')