Free Statistics

of Irreproducible Research!

Author's title

Author*The author of this computation has been verified*
R Software Modulerwasp_histogram.wasp
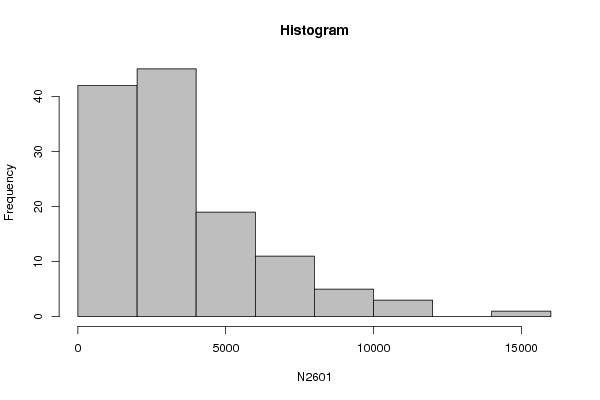
Title produced by softwareHistogram
Date of computationTue, 29 Nov 2016 10:43:36 +0100
Cite this page as followsStatistical Computations at FreeStatistics.org, Office for Research Development and Education, URL https://freestatistics.org/blog/index.php?v=date/2016/Nov/29/t1480412674gl7gpa7s12tsdqm.htm/, Retrieved Tue, 07 May 2024 06:55:06 +0000
Statistical Computations at FreeStatistics.org, Office for Research Development and Education, URL https://freestatistics.org/blog/index.php?pk=297245, Retrieved Tue, 07 May 2024 06:55:06 +0000
QR Codes:

Original text written by user:
IsPrivate?No (this computation is public)
User-defined keywords
Estimated Impact96
Family? (F = Feedback message, R = changed R code, M = changed R Module, P = changed Parameters, D = changed Data)
-       [Histogram] [Histogram & Frequ...] [2016-11-29 09:43:36] [73c8181f60882f9827d3eab75df83592] [Current]
Feedback Forum

Post a new message
Dataseries X:
2246
1512
2290
2622
1162
2818
2626
2122
1666
1464
1762
5224
930
1510
2682
1212
1916
3122
1686
1480
2202
1032
1694
2656
1868
798
1526
1644
2570
2386
2014
2336
2990
2976
954
1064
3684
2614
6884
3554
5786
4998
6464
3712
2138
3018
1100
4844
4082
1650
3450
3642
3496
3444
1382
512
290
420
4690
2334
1170
530
1900
888
1200
660
2086
3748
2604
5260
4620
2876
4150
3798
4716
5296
6370
6284
2694
3474
2988
2348
1204
2594
1238
1528
830
2394
1848
1336
1766
5792
1500
7152
1024
2526
2500
4146
1708
1510
3922
5886
6882
6120
3436
2952
6440
6598
3706
7220
9544
9220
5592
9554
5064
5236
2692
4788
8262
11810
6832
10192
15300
4006
10308
8562


Summary of computational transaction
Raw Input view raw input (R code)
Raw Outputview raw output of R engine
Computing time1 seconds
R ServerBig Analytics Cloud Computing Center

\begin{tabular}{lllllllll}
\hline
Summary of computational transaction \tabularnewline
Raw Input view raw input (R code)  \tabularnewline
Raw Outputview raw output of R engine  \tabularnewline
Computing time1 seconds \tabularnewline
R ServerBig Analytics Cloud Computing Center \tabularnewline
\hline
\end{tabular}
%Source: https://freestatistics.org/blog/index.php?pk=297245&T=0

[TABLE]
[ROW]
Summary of computational transaction[/C][/ROW] [ROW]Raw Input[/C] view raw input (R code) [/C][/ROW] [ROW]Raw Output[/C]view raw output of R engine [/C][/ROW] [ROW]Computing time[/C]1 seconds[/C][/ROW] [ROW]R Server[/C]Big Analytics Cloud Computing Center[/C][/ROW] [/TABLE] Source: https://freestatistics.org/blog/index.php?pk=297245&T=0

Globally Unique Identifier (entire table): ba.freestatistics.org/blog/index.php?pk=297245&T=0

As an alternative you can also use a QR Code:  

The GUIDs for individual cells are displayed in the table below:

Summary of computational transaction
Raw Input view raw input (R code)
Raw Outputview raw output of R engine
Computing time1 seconds
R ServerBig Analytics Cloud Computing Center


Frequency Table (Histogram)
BinsMidpointAbs. FrequencyRel. FrequencyCumul. Rel. Freq.Density
[0,2000[1000420.3333330.3333330.000167
[2000,4000[3000450.3571430.6904760.000179
[4000,6000[5000190.1507940.841277.5e-05
[6000,8000[7000110.0873020.9285714.4e-05
[8000,10000[900050.0396830.9682542e-05
[10000,12000[1100030.023810.9920631.2e-05
[12000,14000[13000000.9920630
[14000,16000]1500010.00793714e-06

\begin{tabular}{lllllllll}
\hline
Frequency Table (Histogram) \tabularnewline
Bins & Midpoint & Abs. Frequency & Rel. Frequency & Cumul. Rel. Freq. & Density \tabularnewline
[0,2000[ & 1000 & 42 & 0.333333 & 0.333333 & 0.000167 \tabularnewline
[2000,4000[ & 3000 & 45 & 0.357143 & 0.690476 & 0.000179 \tabularnewline
[4000,6000[ & 5000 & 19 & 0.150794 & 0.84127 & 7.5e-05 \tabularnewline
[6000,8000[ & 7000 & 11 & 0.087302 & 0.928571 & 4.4e-05 \tabularnewline
[8000,10000[ & 9000 & 5 & 0.039683 & 0.968254 & 2e-05 \tabularnewline
[10000,12000[ & 11000 & 3 & 0.02381 & 0.992063 & 1.2e-05 \tabularnewline
[12000,14000[ & 13000 & 0 & 0 & 0.992063 & 0 \tabularnewline
[14000,16000] & 15000 & 1 & 0.007937 & 1 & 4e-06 \tabularnewline
\hline
\end{tabular}
%Source: https://freestatistics.org/blog/index.php?pk=297245&T=1

[TABLE]
[ROW][C]Frequency Table (Histogram)[/C][/ROW]
[ROW][C]Bins[/C][C]Midpoint[/C][C]Abs. Frequency[/C][C]Rel. Frequency[/C][C]Cumul. Rel. Freq.[/C][C]Density[/C][/ROW]
[ROW][C][0,2000[[/C][C]1000[/C][C]42[/C][C]0.333333[/C][C]0.333333[/C][C]0.000167[/C][/ROW]
[ROW][C][2000,4000[[/C][C]3000[/C][C]45[/C][C]0.357143[/C][C]0.690476[/C][C]0.000179[/C][/ROW]
[ROW][C][4000,6000[[/C][C]5000[/C][C]19[/C][C]0.150794[/C][C]0.84127[/C][C]7.5e-05[/C][/ROW]
[ROW][C][6000,8000[[/C][C]7000[/C][C]11[/C][C]0.087302[/C][C]0.928571[/C][C]4.4e-05[/C][/ROW]
[ROW][C][8000,10000[[/C][C]9000[/C][C]5[/C][C]0.039683[/C][C]0.968254[/C][C]2e-05[/C][/ROW]
[ROW][C][10000,12000[[/C][C]11000[/C][C]3[/C][C]0.02381[/C][C]0.992063[/C][C]1.2e-05[/C][/ROW]
[ROW][C][12000,14000[[/C][C]13000[/C][C]0[/C][C]0[/C][C]0.992063[/C][C]0[/C][/ROW]
[ROW][C][14000,16000][/C][C]15000[/C][C]1[/C][C]0.007937[/C][C]1[/C][C]4e-06[/C][/ROW]
[/TABLE]
Source: https://freestatistics.org/blog/index.php?pk=297245&T=1

Globally Unique Identifier (entire table): ba.freestatistics.org/blog/index.php?pk=297245&T=1

As an alternative you can also use a QR Code:  

The GUIDs for individual cells are displayed in the table below:

Frequency Table (Histogram)
BinsMidpointAbs. FrequencyRel. FrequencyCumul. Rel. Freq.Density
[0,2000[1000420.3333330.3333330.000167
[2000,4000[3000450.3571430.6904760.000179
[4000,6000[5000190.1507940.841277.5e-05
[6000,8000[7000110.0873020.9285714.4e-05
[8000,10000[900050.0396830.9682542e-05
[10000,12000[1100030.023810.9920631.2e-05
[12000,14000[13000000.9920630
[14000,16000]1500010.00793714e-06


Parameters (Session):
par2 = grey ; par3 = FALSE ; par4 = Unknown ;
Parameters (R input):
par1 = ; par2 = grey ; par3 = FALSE ; par4 = Unknown ;
R code (references can be found in the software module):
par4 <- 'Unknown'
par3 <- 'FALSE'
par2 <- 'grey'
par1 <- ''
par1 <- as.numeric(par1)
if (par3 == 'TRUE') par3 <- TRUE
if (par3 == 'FALSE') par3 <- FALSE
if (par4 == 'Unknown') par1 <- as.numeric(par1)
if (par4 == 'Interval/Ratio') par1 <- as.numeric(par1)
if (par4 == '3-point Likert') par1 <- c(1:3 - 0.5, 3.5)
if (par4 == '4-point Likert') par1 <- c(1:4 - 0.5, 4.5)
if (par4 == '5-point Likert') par1 <- c(1:5 - 0.5, 5.5)
if (par4 == '6-point Likert') par1 <- c(1:6 - 0.5, 6.5)
if (par4 == '7-point Likert') par1 <- c(1:7 - 0.5, 7.5)
if (par4 == '8-point Likert') par1 <- c(1:8 - 0.5, 8.5)
if (par4 == '9-point Likert') par1 <- c(1:9 - 0.5, 9.5)
if (par4 == '10-point Likert') par1 <- c(1:10 - 0.5, 10.5)
bitmap(file='test1.png')
if(is.numeric(x[1])) {
if (is.na(par1)) {
myhist<-hist(x,col=par2,main=main,xlab=xlab,right=par3)
} else {
if (par1 < 0) par1 <- 3
if (par1 > 50) par1 <- 50
myhist<-hist(x,breaks=par1,col=par2,main=main,xlab=xlab,right=par3)
}
} else {
barplot(mytab <- sort(table(x),T),col=par2,main='Frequency Plot',xlab=xlab,ylab='Absolute Frequency')
}
dev.off()
if(is.numeric(x[1])) {
myhist
n <- length(x)
load(file='createtable')
a<-table.start()
a<-table.row.start(a)
a<-table.element(a,'Frequency Table (Histogram)',6,TRUE)
a<-table.row.end(a)
a<-table.row.start(a)
a<-table.element(a,'Bins',header=TRUE)
a<-table.element(a,'Midpoint',header=TRUE)
a<-table.element(a,'Abs. Frequency',header=TRUE)
a<-table.element(a,'Rel. Frequency',header=TRUE)
a<-table.element(a,'Cumul. Rel. Freq.',header=TRUE)
a<-table.element(a,'Density',header=TRUE)
a<-table.row.end(a)
crf <- 0
if (par3 == FALSE) mybracket <- '[' else mybracket <- ']'
mynumrows <- (length(myhist$breaks)-1)
for (i in 1:mynumrows) {
a<-table.row.start(a)
if (i == 1)
dum <- paste('[',myhist$breaks[i],sep='')
else
dum <- paste(mybracket,myhist$breaks[i],sep='')
dum <- paste(dum,myhist$breaks[i+1],sep=',')
if (i==mynumrows)
dum <- paste(dum,']',sep='')
else
dum <- paste(dum,mybracket,sep='')
a<-table.element(a,dum,header=TRUE)
a<-table.element(a,myhist$mids[i])
a<-table.element(a,myhist$counts[i])
rf <- myhist$counts[i]/n
crf <- crf + rf
a<-table.element(a,round(rf,6))
a<-table.element(a,round(crf,6))
a<-table.element(a,round(myhist$density[i],6))
a<-table.row.end(a)
}
a<-table.end(a)
table.save(a,file='mytable.tab')
} else {
mytab
reltab <- mytab / sum(mytab)
n <- length(mytab)
load(file='createtable')
a<-table.start()
a<-table.row.start(a)
a<-table.element(a,'Frequency Table (Categorical Data)',3,TRUE)
a<-table.row.end(a)
a<-table.row.start(a)
a<-table.element(a,'Category',header=TRUE)
a<-table.element(a,'Abs. Frequency',header=TRUE)
a<-table.element(a,'Rel. Frequency',header=TRUE)
a<-table.row.end(a)
for (i in 1:n) {
a<-table.row.start(a)
a<-table.element(a,labels(mytab)$x[i],header=TRUE)
a<-table.element(a,mytab[i])
a<-table.element(a,round(reltab[i],4))
a<-table.row.end(a)
}
a<-table.end(a)
table.save(a,file='mytable1.tab')
}