Free Statistics
of Irreproducible Research!
Description of Statistical Computation | ||||||||||||||||||||||||||||||||||||||||||
|---|---|---|---|---|---|---|---|---|---|---|---|---|---|---|---|---|---|---|---|---|---|---|---|---|---|---|---|---|---|---|---|---|---|---|---|---|---|---|---|---|---|---|
| Author's title | ||||||||||||||||||||||||||||||||||||||||||
| Author | *The author of this computation has been verified* | |||||||||||||||||||||||||||||||||||||||||
| R Software Module | rwasp_fitdistrexp.wasp | |||||||||||||||||||||||||||||||||||||||||
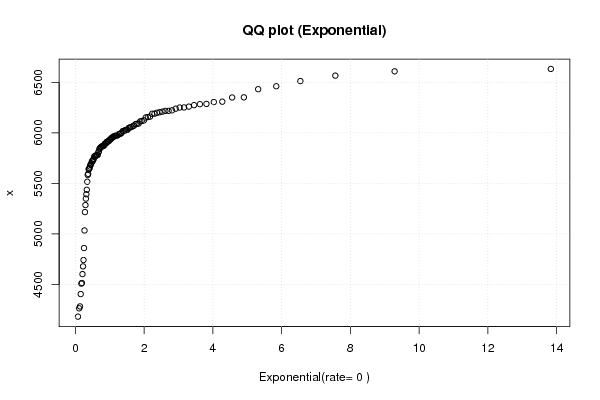
| Title produced by software | Maximum-likelihood Fitting - Exponential Distribution | |||||||||||||||||||||||||||||||||||||||||
| Date of computation | Tue, 29 Nov 2016 15:55:39 +0100 | |||||||||||||||||||||||||||||||||||||||||
| Cite this page as follows | Statistical Computations at FreeStatistics.org, Office for Research Development and Education, URL https://freestatistics.org/blog/index.php?v=date/2016/Nov/29/t1480431468q62qmp0y5zbwrm1.htm/, Retrieved Tue, 07 May 2024 20:41:52 +0000 | |||||||||||||||||||||||||||||||||||||||||
| Statistical Computations at FreeStatistics.org, Office for Research Development and Education, URL https://freestatistics.org/blog/index.php?pk=297271, Retrieved Tue, 07 May 2024 20:41:52 +0000 | ||||||||||||||||||||||||||||||||||||||||||
| QR Codes: | ||||||||||||||||||||||||||||||||||||||||||
|
| ||||||||||||||||||||||||||||||||||||||||||
| Original text written by user: | ||||||||||||||||||||||||||||||||||||||||||
| IsPrivate? | No (this computation is public) | |||||||||||||||||||||||||||||||||||||||||
| User-defined keywords | ||||||||||||||||||||||||||||||||||||||||||
| Estimated Impact | 108 | |||||||||||||||||||||||||||||||||||||||||
Tree of Dependent Computations | ||||||||||||||||||||||||||||||||||||||||||
| Family? (F = Feedback message, R = changed R code, M = changed R Module, P = changed Parameters, D = changed Data) | ||||||||||||||||||||||||||||||||||||||||||
| - [Skewness-Kurtosis Plot] [hgi] [2016-11-22 13:33:08] [6645d1b9dc3eb52796fd44b1f711efc9] - RM D [Maximum-likelihood Fitting - Exponential Distribution] [ML Fitting - Expo...] [2016-11-29 14:55:39] [8b2c6464bd93a4843579a2d15e9e0aeb] [Current] | ||||||||||||||||||||||||||||||||||||||||||
| Feedback Forum | ||||||||||||||||||||||||||||||||||||||||||
Post a new message | ||||||||||||||||||||||||||||||||||||||||||
Dataset | ||||||||||||||||||||||||||||||||||||||||||
| Dataseries X: | ||||||||||||||||||||||||||||||||||||||||||
4181.5 4264 4283 4405 4508.5 4514.5 4602.5 4679 4742 4860.5 5034.5 5216.5 5286 5349.5 5437 5393 5516.5 5583.5 5667 5698.5 5764.5 5873 5782.5 5840 5742.5 5808 5814 5862.5 5782 5895 5932.5 6027.5 5970.5 5942 5913.5 5915.5 5845.5 5869.5 5858.5 5856 5871 5736 5716 5651.5 5640 5685.5 5772.5 5721.5 5595 5641.5 5769.5 5723 5769 5779 5779 5685 5895 5874 5911 5958 6029 5992 5977 5972.5 5953.5 6018 5955.5 5969.5 5987 5990.5 6054 6071.5 6239.5 6223.5 6252 6218.5 6287 6204.5 6567 6350.5 6190 6189.5 6092.5 5918 6118.5 5933 5890.5 6019.5 6156.5 6086.5 6352 6160.5 6153 6124 6305.5 6513 6633 6609.5 6462 6432.5 6275 6284.5 6260 6199 6210.5 6217.5 6309 6251 6114.5 6002 6090.5 6048.5 6027 6057.5 5974 6065 | ||||||||||||||||||||||||||||||||||||||||||
Tables (Output of Computation) | ||||||||||||||||||||||||||||||||||||||||||
| ||||||||||||||||||||||||||||||||||||||||||
Figures (Output of Computation) | ||||||||||||||||||||||||||||||||||||||||||
Input Parameters & R Code | ||||||||||||||||||||||||||||||||||||||||||
| Parameters (Session): | ||||||||||||||||||||||||||||||||||||||||||
| Parameters (R input): | ||||||||||||||||||||||||||||||||||||||||||
| R code (references can be found in the software module): | ||||||||||||||||||||||||||||||||||||||||||
library(MASS) | ||||||||||||||||||||||||||||||||||||||||||