Free Statistics
of Irreproducible Research!
Description of Statistical Computation | ||||||||||||||||||||||||||||||||||||||||||
|---|---|---|---|---|---|---|---|---|---|---|---|---|---|---|---|---|---|---|---|---|---|---|---|---|---|---|---|---|---|---|---|---|---|---|---|---|---|---|---|---|---|---|
| Author's title | ||||||||||||||||||||||||||||||||||||||||||
| Author | *The author of this computation has been verified* | |||||||||||||||||||||||||||||||||||||||||
| R Software Module | rwasp_fitdistrchisq1.wasp | |||||||||||||||||||||||||||||||||||||||||
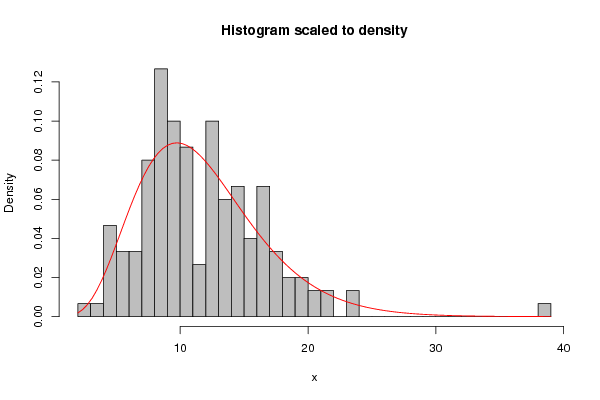
| Title produced by software | Maximum-likelihood Fitting - Chi-squared Distribution | |||||||||||||||||||||||||||||||||||||||||
| Date of computation | Fri, 07 Oct 2016 14:25:12 +0200 | |||||||||||||||||||||||||||||||||||||||||
| Cite this page as follows | Statistical Computations at FreeStatistics.org, Office for Research Development and Education, URL https://freestatistics.org/blog/index.php?v=date/2016/Oct/07/t1475843136yk5htvbgynqvr4c.htm/, Retrieved Sun, 05 May 2024 23:29:34 +0000 | |||||||||||||||||||||||||||||||||||||||||
| Statistical Computations at FreeStatistics.org, Office for Research Development and Education, URL https://freestatistics.org/blog/index.php?pk=296605, Retrieved Sun, 05 May 2024 23:29:34 +0000 | ||||||||||||||||||||||||||||||||||||||||||
| QR Codes: | ||||||||||||||||||||||||||||||||||||||||||
|
| ||||||||||||||||||||||||||||||||||||||||||
| Original text written by user: | ||||||||||||||||||||||||||||||||||||||||||
| IsPrivate? | No (this computation is public) | |||||||||||||||||||||||||||||||||||||||||
| User-defined keywords | ||||||||||||||||||||||||||||||||||||||||||
| Estimated Impact | 108 | |||||||||||||||||||||||||||||||||||||||||
Tree of Dependent Computations | ||||||||||||||||||||||||||||||||||||||||||
| Family? (F = Feedback message, R = changed R code, M = changed R Module, P = changed Parameters, D = changed Data) | ||||||||||||||||||||||||||||||||||||||||||
| - [Maximum-likelihood Fitting - Chi-squared Distribution] [3.3.7.21.4 2] [2016-10-07 12:25:12] [86c9a777e8dbb7ef3face68c75fc8376] [Current] | ||||||||||||||||||||||||||||||||||||||||||
| Feedback Forum | ||||||||||||||||||||||||||||||||||||||||||
Post a new message | ||||||||||||||||||||||||||||||||||||||||||
Dataset | ||||||||||||||||||||||||||||||||||||||||||
| Dataseries X: | ||||||||||||||||||||||||||||||||||||||||||
11.14486395 7.947285762 13.6164633 14.15894995 10.20742303 8.425363126 9.788375141 9.530028692 6.440086226 13.81446502 7.047206884 12.02779324 7.611767484 17.5079621 15.89972074 4.914647206 11.51857644 4.184339183 13.16143761 19.78098421 13.38795378 7.63620822 8.608955178 8.841766971 15.99925997 21.80663469 15.87167715 10.3093707 8.072692431 4.419304915 10.19426948 20.96863351 8.925702857 12.76808293 7.295854594 7.076038248 9.474022998 13.78467325 7.948118172 15.21699923 9.498053842 16.68792936 12.45119232 14.98535595 9.037222252 9.51412502 23.04581193 9.702959826 15.7078596 19.63178913 10.15121804 7.165380432 5.085613102 10.4952699 23.25899617 8.605840338 7.107272595 12.28746436 12.28876639 20.34959385 13.25744206 4.955001548 14.3813469 16.29087577 18.71714101 5.912614983 6.139448575 13.51929956 17.65273163 16.95440643 12.86537029 8.075564539 7.364522276 16.51511603 17.96851459 16.09371049 11.26253863 8.726745117 10.22888516 14.50506492 14.3620006 13.79351413 12.90527456 7.686638067 9.587312608 8.343219088 16.15380851 16.88643605 5.058071737 14.81900188 10.55140424 3.81959859 10.29806652 10.98823163 14.97043894 6.387760792 7.047871323 6.119624425 10.07799565 16.32982506 6.249442031 9.214800354 5.066549442 8.337825571 8.78913329 8.543899316 4.941415743 38.72133132 8.78842743 12.94677639 4.859804733 11.0228367 9.896776286 14.500151 2.616927419 18.20227842 19.40895412 12.13391892 8.792077993 17.60461504 9.300022286 21.18916432 12.39936136 9.590051467 14.33240738 9.920294845 9.280755588 15.28593767 16.17429577 8.380377909 8.344644649 10.34019312 12.08338318 9.611779746 8.602125928 10.09163719 17.34792988 12.65458807 12.98670407 5.790970357 14.34066648 13.9334567 10.89451138 4.638616285 12.17921639 8.559058278 18.58857988 12.83251631 16.34059234 8.727279382 | ||||||||||||||||||||||||||||||||||||||||||
Tables (Output of Computation) | ||||||||||||||||||||||||||||||||||||||||||
| ||||||||||||||||||||||||||||||||||||||||||
Figures (Output of Computation) | ||||||||||||||||||||||||||||||||||||||||||
Input Parameters & R Code | ||||||||||||||||||||||||||||||||||||||||||
| Parameters (Session): | ||||||||||||||||||||||||||||||||||||||||||
| Parameters (R input): | ||||||||||||||||||||||||||||||||||||||||||
| R code (references can be found in the software module): | ||||||||||||||||||||||||||||||||||||||||||
library(MASS) | ||||||||||||||||||||||||||||||||||||||||||