Free Statistics

of Irreproducible Research!

Author's title

Author*Unverified author*
R Software Modulerwasp_centraltendency.wasp
Title produced by softwareCentral Tendency
Date of computationThu, 13 Oct 2016 07:31:03 +0100
Cite this page as followsStatistical Computations at FreeStatistics.org, Office for Research Development and Education, URL https://freestatistics.org/blog/index.php?v=date/2016/Oct/13/t147634028057wa6q05zmswo1v.htm/, Retrieved Tue, 30 Apr 2024 13:17:21 +0200
Statistical Computations at FreeStatistics.org, Office for Research Development and Education, URL https://freestatistics.org/blog/index.php?pk=, Retrieved Tue, 30 Apr 2024 13:17:21 +0200
QR Codes:

Original text written by user:
IsPrivate?No (this computation is public)
User-defined keywords
Estimated Impact0
Dataseries X:
15391
13704
15409
15098
15254
15522
16669
16238
16246
15424
14952
15008
14929
13905
14994
14753
15031
15386
16160
16116
16219
16064
15436
15404
15112
14119
14775
14289
15121
15371
15782
16104
15674
15105
14223
14385
14558
13804
14672
14244
15089
14580
15218
15696
15129
15110
14204
13655
14534
12746
14074
13699
14184
14110
15820
15362
14993
14437
13694
13688
14366
13267
14409
14031
14584
14626
15669
15460
15552
15220
13907
14090
14176
12523
13597
13241
14345
14273
15308
15353
15330
14610
13852
13902


Summary of computational transaction
Raw Inputview raw input (R code)
Raw Outputview raw output of R engine
Computing time1 seconds
R Server'Sir Ronald Aylmer Fisher' @ fisher.wessa.net

\begin{tabular}{lllllllll}
\hline
Summary of computational transaction \tabularnewline
Raw Input & view raw input (R code)  \tabularnewline
Raw Output & view raw output of R engine  \tabularnewline
Computing time & 1 seconds \tabularnewline
R Server & 'Sir Ronald Aylmer Fisher' @ fisher.wessa.net \tabularnewline
\hline
\end{tabular}
%Source: https://freestatistics.org/blog/index.php?pk=&T=0

[TABLE]
[ROW][C]Summary of computational transaction[/C][/ROW]
[ROW][C]Raw Input[/C][C]view raw input (R code) [/C][/ROW]
[ROW][C]Raw Output[/C][C]view raw output of R engine [/C][/ROW]
[ROW][C]Computing time[/C][C]1 seconds[/C][/ROW]
[ROW][C]R Server[/C][C]'Sir Ronald Aylmer Fisher' @ fisher.wessa.net[/C][/ROW]
[/TABLE]
Source: https://freestatistics.org/blog/index.php?pk=&T=0

Globally Unique Identifier (entire table): ba.freestatistics.org/blog/index.php?pk=&T=0

As an alternative you can also use a QR Code:  

The GUIDs for individual cells are displayed in the table below:

Summary of computational transaction
Raw Inputview raw input (R code)
Raw Outputview raw output of R engine
Computing time1 seconds
R Server'Sir Ronald Aylmer Fisher' @ fisher.wessa.net


Central Tendency - Ungrouped Data
MeasureValueS.E.Value/S.E.
Arithmetic Mean14790.035714285792.5153542736058159.865741534595
Geometric Mean14765.7472458977
Harmonic Mean14741.1740104693
Quadratic Mean14814.0325693002
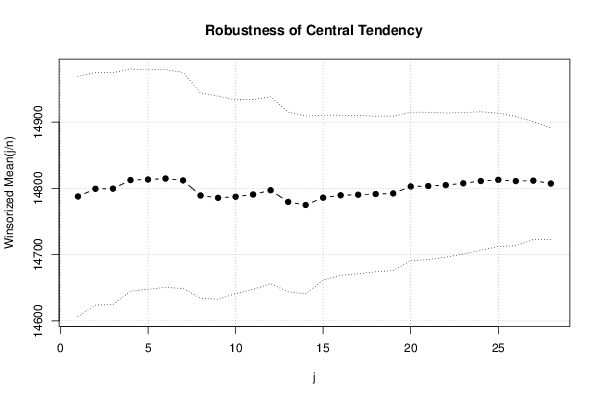
Winsorized Mean ( 1 / 28 )14787.654761904890.6575876088901163.115467242531
Winsorized Mean ( 2 / 28 )14799.2587.7552025859152168.642423057608
Winsorized Mean ( 3 / 28 )14799.587.4244227329488169.283359699238
Winsorized Mean ( 4 / 28 )14812.404761904883.8397699995443176.675159795706
Winsorized Mean ( 5 / 28 )14813.238095238182.7450542936182179.022640346259
Winsorized Mean ( 6 / 28 )14814.738095238182.189320300752180.251376225368
Winsorized Mean ( 7 / 28 )14811.904761904881.4831264171874181.778797809855
Winsorized Mean ( 8 / 28 )14789.142857142977.3799555962103191.123692734029
Winsorized Mean ( 9 / 28 )14785.607142857176.643308855184192.914520050201
Winsorized Mean ( 10 / 28 )14787.273809523873.0960440484552202.299235232503
Winsorized Mean ( 11 / 28 )14790.678571428671.6608461272596206.398324479206
Winsorized Mean ( 12 / 28 )14797.107142857170.4440123016149210.05486001424
Winsorized Mean ( 13 / 28 )14779.464285714367.7769460346035218.060345743059
Winsorized Mean ( 14 / 28 )14774.797619047667.0460057747702220.368050986976
Winsorized Mean ( 15 / 28 )14785.86904761962.2308358493694237.597146909748
Winsorized Mean ( 16 / 28 )14789.488095238160.4553041682784244.635078736372
Winsorized Mean ( 17 / 28 )14790.297619047659.6837543995999247.81111322224
Winsorized Mean ( 18 / 28 )14791.36904761958.6715303518434252.104708346922
Winsorized Mean ( 19 / 28 )14792.273809523858.2440764994354253.970441263108
Winsorized Mean ( 20 / 28 )14802.7555.991557112403264.374680101921
Winsorized Mean ( 21 / 28 )14803.555.5643102205105266.421016318773
Winsorized Mean ( 22 / 28 )14804.809523809554.3691945514762272.301431829976
Winsorized Mean ( 23 / 28 )14807.547619047653.3707773519072277.446729348012
Winsorized Mean ( 24 / 28 )14810.976190476252.26114414804283.403213456659
Winsorized Mean ( 25 / 28 )14812.761904761950.2869779826958294.564567189921
Winsorized Mean ( 26 / 28 )14810.904761904848.8079403070732303.452771592543
Winsorized Mean ( 27 / 28 )14811.547619047644.4001306535744333.592433198284
Winsorized Mean ( 28 / 28 )14807.214285714342.166738908464351.158630451786
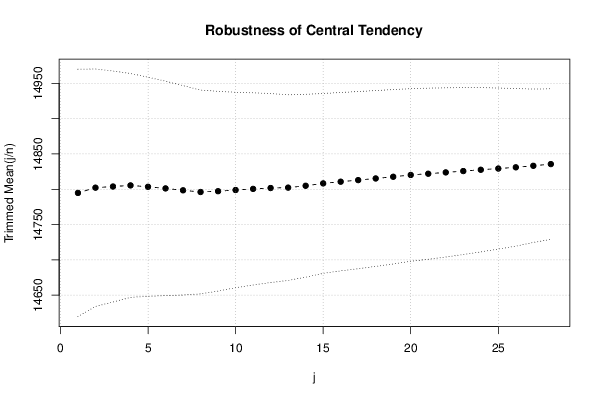
Trimmed Mean ( 1 / 28 )14794.768292682987.6284161966719168.835281234318
Trimmed Mean ( 2 / 28 )14802.237584.0943924960991176.019316635014
Trimmed Mean ( 3 / 28 )14803.846153846281.8076658884091180.959155759798
Trimmed Mean ( 4 / 28 )14805.447368421179.284485318304186.73826674893
Trimmed Mean ( 5 / 28 )14803.47297297377.6064107412689190.750645875456
Trimmed Mean ( 6 / 28 )14801.194444444475.9561267578433194.865050078611
Trimmed Mean ( 7 / 28 )14798.485714285774.1491606841816199.577251822389
Trimmed Mean ( 8 / 28 )14796.117647058872.1761591503585205.000069569168
Trimmed Mean ( 9 / 28 )14797.227272727370.7632936449727209.108797944971
Trimmed Mean ( 10 / 28 )14798.92187569.2161803007099213.807260249064
Trimmed Mean ( 11 / 28 )14800.568.0662365603706217.442608081804
Trimmed Mean ( 12 / 28 )14801.7566.9330242230128221.142704544207
Trimmed Mean ( 13 / 28 )14802.310344827665.7628105512611225.086340147969
Trimmed Mean ( 14 / 28 )14804.946428571464.7924379287823228.49806091329
Trimmed Mean ( 15 / 28 )14808.296296296363.6885801445701232.511013162519
Trimmed Mean ( 16 / 28 )14810.711538461563.1612371851519234.490522961815
Trimmed Mean ( 17 / 28 )14812.9462.7458652024179236.07834479951
Trimmed Mean ( 18 / 28 )14815.270833333362.2760508279291237.89676185904
Trimmed Mean ( 19 / 28 )14817.695652173961.7743585281191239.868061850113
Trimmed Mean ( 20 / 28 )14820.2561.1165154597759242.491737110798
Trimmed Mean ( 21 / 28 )1482260.6110483904698244.542874502243
Trimmed Mean ( 22 / 28 )14823.8559.9189254593666247.398461944259
Trimmed Mean ( 23 / 28 )14825.763157894759.1373913748396250.700323656861
Trimmed Mean ( 24 / 28 )14827.611111111158.1876449791422254.824045833547
Trimmed Mean ( 25 / 28 )14829.323529411857.0312439089067260.021043081191
Trimmed Mean ( 26 / 28 )14831.062555.8033871655944265.773517582175
Trimmed Mean ( 27 / 28 )14833.233333333354.3262110133325273.040086114105
Trimmed Mean ( 28 / 28 )14835.642857142953.3542174955774278.059421607534
Median14940.5
Midrange14596
Midmean - Weighted Average at Xnp14806.976744186
Midmean - Weighted Average at X(n+1)p14822
Midmean - Empirical Distribution Function14806.976744186
Midmean - Empirical Distribution Function - Averaging14822
Midmean - Empirical Distribution Function - Interpolation14822
Midmean - Closest Observation14806.976744186
Midmean - True Basic - Statistics Graphics Toolkit14822
Midmean - MS Excel (old versions)14820.25
Number of observations84

\begin{tabular}{lllllllll}
\hline
Central Tendency - Ungrouped Data \tabularnewline
Measure & Value & S.E. & Value/S.E. \tabularnewline
Arithmetic Mean & 14790.0357142857 & 92.5153542736058 & 159.865741534595 \tabularnewline
Geometric Mean & 14765.7472458977 &  &  \tabularnewline
Harmonic Mean & 14741.1740104693 &  &  \tabularnewline
Quadratic Mean & 14814.0325693002 &  &  \tabularnewline
Winsorized Mean ( 1 / 28 ) & 14787.6547619048 & 90.6575876088901 & 163.115467242531 \tabularnewline
Winsorized Mean ( 2 / 28 ) & 14799.25 & 87.7552025859152 & 168.642423057608 \tabularnewline
Winsorized Mean ( 3 / 28 ) & 14799.5 & 87.4244227329488 & 169.283359699238 \tabularnewline
Winsorized Mean ( 4 / 28 ) & 14812.4047619048 & 83.8397699995443 & 176.675159795706 \tabularnewline
Winsorized Mean ( 5 / 28 ) & 14813.2380952381 & 82.7450542936182 & 179.022640346259 \tabularnewline
Winsorized Mean ( 6 / 28 ) & 14814.7380952381 & 82.189320300752 & 180.251376225368 \tabularnewline
Winsorized Mean ( 7 / 28 ) & 14811.9047619048 & 81.4831264171874 & 181.778797809855 \tabularnewline
Winsorized Mean ( 8 / 28 ) & 14789.1428571429 & 77.3799555962103 & 191.123692734029 \tabularnewline
Winsorized Mean ( 9 / 28 ) & 14785.6071428571 & 76.643308855184 & 192.914520050201 \tabularnewline
Winsorized Mean ( 10 / 28 ) & 14787.2738095238 & 73.0960440484552 & 202.299235232503 \tabularnewline
Winsorized Mean ( 11 / 28 ) & 14790.6785714286 & 71.6608461272596 & 206.398324479206 \tabularnewline
Winsorized Mean ( 12 / 28 ) & 14797.1071428571 & 70.4440123016149 & 210.05486001424 \tabularnewline
Winsorized Mean ( 13 / 28 ) & 14779.4642857143 & 67.7769460346035 & 218.060345743059 \tabularnewline
Winsorized Mean ( 14 / 28 ) & 14774.7976190476 & 67.0460057747702 & 220.368050986976 \tabularnewline
Winsorized Mean ( 15 / 28 ) & 14785.869047619 & 62.2308358493694 & 237.597146909748 \tabularnewline
Winsorized Mean ( 16 / 28 ) & 14789.4880952381 & 60.4553041682784 & 244.635078736372 \tabularnewline
Winsorized Mean ( 17 / 28 ) & 14790.2976190476 & 59.6837543995999 & 247.81111322224 \tabularnewline
Winsorized Mean ( 18 / 28 ) & 14791.369047619 & 58.6715303518434 & 252.104708346922 \tabularnewline
Winsorized Mean ( 19 / 28 ) & 14792.2738095238 & 58.2440764994354 & 253.970441263108 \tabularnewline
Winsorized Mean ( 20 / 28 ) & 14802.75 & 55.991557112403 & 264.374680101921 \tabularnewline
Winsorized Mean ( 21 / 28 ) & 14803.5 & 55.5643102205105 & 266.421016318773 \tabularnewline
Winsorized Mean ( 22 / 28 ) & 14804.8095238095 & 54.3691945514762 & 272.301431829976 \tabularnewline
Winsorized Mean ( 23 / 28 ) & 14807.5476190476 & 53.3707773519072 & 277.446729348012 \tabularnewline
Winsorized Mean ( 24 / 28 ) & 14810.9761904762 & 52.26114414804 & 283.403213456659 \tabularnewline
Winsorized Mean ( 25 / 28 ) & 14812.7619047619 & 50.2869779826958 & 294.564567189921 \tabularnewline
Winsorized Mean ( 26 / 28 ) & 14810.9047619048 & 48.8079403070732 & 303.452771592543 \tabularnewline
Winsorized Mean ( 27 / 28 ) & 14811.5476190476 & 44.4001306535744 & 333.592433198284 \tabularnewline
Winsorized Mean ( 28 / 28 ) & 14807.2142857143 & 42.166738908464 & 351.158630451786 \tabularnewline
Trimmed Mean ( 1 / 28 ) & 14794.7682926829 & 87.6284161966719 & 168.835281234318 \tabularnewline
Trimmed Mean ( 2 / 28 ) & 14802.2375 & 84.0943924960991 & 176.019316635014 \tabularnewline
Trimmed Mean ( 3 / 28 ) & 14803.8461538462 & 81.8076658884091 & 180.959155759798 \tabularnewline
Trimmed Mean ( 4 / 28 ) & 14805.4473684211 & 79.284485318304 & 186.73826674893 \tabularnewline
Trimmed Mean ( 5 / 28 ) & 14803.472972973 & 77.6064107412689 & 190.750645875456 \tabularnewline
Trimmed Mean ( 6 / 28 ) & 14801.1944444444 & 75.9561267578433 & 194.865050078611 \tabularnewline
Trimmed Mean ( 7 / 28 ) & 14798.4857142857 & 74.1491606841816 & 199.577251822389 \tabularnewline
Trimmed Mean ( 8 / 28 ) & 14796.1176470588 & 72.1761591503585 & 205.000069569168 \tabularnewline
Trimmed Mean ( 9 / 28 ) & 14797.2272727273 & 70.7632936449727 & 209.108797944971 \tabularnewline
Trimmed Mean ( 10 / 28 ) & 14798.921875 & 69.2161803007099 & 213.807260249064 \tabularnewline
Trimmed Mean ( 11 / 28 ) & 14800.5 & 68.0662365603706 & 217.442608081804 \tabularnewline
Trimmed Mean ( 12 / 28 ) & 14801.75 & 66.9330242230128 & 221.142704544207 \tabularnewline
Trimmed Mean ( 13 / 28 ) & 14802.3103448276 & 65.7628105512611 & 225.086340147969 \tabularnewline
Trimmed Mean ( 14 / 28 ) & 14804.9464285714 & 64.7924379287823 & 228.49806091329 \tabularnewline
Trimmed Mean ( 15 / 28 ) & 14808.2962962963 & 63.6885801445701 & 232.511013162519 \tabularnewline
Trimmed Mean ( 16 / 28 ) & 14810.7115384615 & 63.1612371851519 & 234.490522961815 \tabularnewline
Trimmed Mean ( 17 / 28 ) & 14812.94 & 62.7458652024179 & 236.07834479951 \tabularnewline
Trimmed Mean ( 18 / 28 ) & 14815.2708333333 & 62.2760508279291 & 237.89676185904 \tabularnewline
Trimmed Mean ( 19 / 28 ) & 14817.6956521739 & 61.7743585281191 & 239.868061850113 \tabularnewline
Trimmed Mean ( 20 / 28 ) & 14820.25 & 61.1165154597759 & 242.491737110798 \tabularnewline
Trimmed Mean ( 21 / 28 ) & 14822 & 60.6110483904698 & 244.542874502243 \tabularnewline
Trimmed Mean ( 22 / 28 ) & 14823.85 & 59.9189254593666 & 247.398461944259 \tabularnewline
Trimmed Mean ( 23 / 28 ) & 14825.7631578947 & 59.1373913748396 & 250.700323656861 \tabularnewline
Trimmed Mean ( 24 / 28 ) & 14827.6111111111 & 58.1876449791422 & 254.824045833547 \tabularnewline
Trimmed Mean ( 25 / 28 ) & 14829.3235294118 & 57.0312439089067 & 260.021043081191 \tabularnewline
Trimmed Mean ( 26 / 28 ) & 14831.0625 & 55.8033871655944 & 265.773517582175 \tabularnewline
Trimmed Mean ( 27 / 28 ) & 14833.2333333333 & 54.3262110133325 & 273.040086114105 \tabularnewline
Trimmed Mean ( 28 / 28 ) & 14835.6428571429 & 53.3542174955774 & 278.059421607534 \tabularnewline
Median & 14940.5 &  &  \tabularnewline
Midrange & 14596 &  &  \tabularnewline
Midmean - Weighted Average at Xnp & 14806.976744186 &  &  \tabularnewline
Midmean - Weighted Average at X(n+1)p & 14822 &  &  \tabularnewline
Midmean - Empirical Distribution Function & 14806.976744186 &  &  \tabularnewline
Midmean - Empirical Distribution Function - Averaging & 14822 &  &  \tabularnewline
Midmean - Empirical Distribution Function - Interpolation & 14822 &  &  \tabularnewline
Midmean - Closest Observation & 14806.976744186 &  &  \tabularnewline
Midmean - True Basic - Statistics Graphics Toolkit & 14822 &  &  \tabularnewline
Midmean - MS Excel (old versions) & 14820.25 &  &  \tabularnewline
Number of observations & 84 &  &  \tabularnewline
\hline
\end{tabular}
%Source: https://freestatistics.org/blog/index.php?pk=&T=1

[TABLE]
[ROW][C]Central Tendency - Ungrouped Data[/C][/ROW]
[ROW][C]Measure[/C][C]Value[/C][C]S.E.[/C][C]Value/S.E.[/C][/ROW]
[ROW][C]Arithmetic Mean[/C][C]14790.0357142857[/C][C]92.5153542736058[/C][C]159.865741534595[/C][/ROW]
[ROW][C]Geometric Mean[/C][C]14765.7472458977[/C][C][/C][C][/C][/ROW]
[ROW][C]Harmonic Mean[/C][C]14741.1740104693[/C][C][/C][C][/C][/ROW]
[ROW][C]Quadratic Mean[/C][C]14814.0325693002[/C][C][/C][C][/C][/ROW]
[ROW][C]Winsorized Mean ( 1 / 28 )[/C][C]14787.6547619048[/C][C]90.6575876088901[/C][C]163.115467242531[/C][/ROW]
[ROW][C]Winsorized Mean ( 2 / 28 )[/C][C]14799.25[/C][C]87.7552025859152[/C][C]168.642423057608[/C][/ROW]
[ROW][C]Winsorized Mean ( 3 / 28 )[/C][C]14799.5[/C][C]87.4244227329488[/C][C]169.283359699238[/C][/ROW]
[ROW][C]Winsorized Mean ( 4 / 28 )[/C][C]14812.4047619048[/C][C]83.8397699995443[/C][C]176.675159795706[/C][/ROW]
[ROW][C]Winsorized Mean ( 5 / 28 )[/C][C]14813.2380952381[/C][C]82.7450542936182[/C][C]179.022640346259[/C][/ROW]
[ROW][C]Winsorized Mean ( 6 / 28 )[/C][C]14814.7380952381[/C][C]82.189320300752[/C][C]180.251376225368[/C][/ROW]
[ROW][C]Winsorized Mean ( 7 / 28 )[/C][C]14811.9047619048[/C][C]81.4831264171874[/C][C]181.778797809855[/C][/ROW]
[ROW][C]Winsorized Mean ( 8 / 28 )[/C][C]14789.1428571429[/C][C]77.3799555962103[/C][C]191.123692734029[/C][/ROW]
[ROW][C]Winsorized Mean ( 9 / 28 )[/C][C]14785.6071428571[/C][C]76.643308855184[/C][C]192.914520050201[/C][/ROW]
[ROW][C]Winsorized Mean ( 10 / 28 )[/C][C]14787.2738095238[/C][C]73.0960440484552[/C][C]202.299235232503[/C][/ROW]
[ROW][C]Winsorized Mean ( 11 / 28 )[/C][C]14790.6785714286[/C][C]71.6608461272596[/C][C]206.398324479206[/C][/ROW]
[ROW][C]Winsorized Mean ( 12 / 28 )[/C][C]14797.1071428571[/C][C]70.4440123016149[/C][C]210.05486001424[/C][/ROW]
[ROW][C]Winsorized Mean ( 13 / 28 )[/C][C]14779.4642857143[/C][C]67.7769460346035[/C][C]218.060345743059[/C][/ROW]
[ROW][C]Winsorized Mean ( 14 / 28 )[/C][C]14774.7976190476[/C][C]67.0460057747702[/C][C]220.368050986976[/C][/ROW]
[ROW][C]Winsorized Mean ( 15 / 28 )[/C][C]14785.869047619[/C][C]62.2308358493694[/C][C]237.597146909748[/C][/ROW]
[ROW][C]Winsorized Mean ( 16 / 28 )[/C][C]14789.4880952381[/C][C]60.4553041682784[/C][C]244.635078736372[/C][/ROW]
[ROW][C]Winsorized Mean ( 17 / 28 )[/C][C]14790.2976190476[/C][C]59.6837543995999[/C][C]247.81111322224[/C][/ROW]
[ROW][C]Winsorized Mean ( 18 / 28 )[/C][C]14791.369047619[/C][C]58.6715303518434[/C][C]252.104708346922[/C][/ROW]
[ROW][C]Winsorized Mean ( 19 / 28 )[/C][C]14792.2738095238[/C][C]58.2440764994354[/C][C]253.970441263108[/C][/ROW]
[ROW][C]Winsorized Mean ( 20 / 28 )[/C][C]14802.75[/C][C]55.991557112403[/C][C]264.374680101921[/C][/ROW]
[ROW][C]Winsorized Mean ( 21 / 28 )[/C][C]14803.5[/C][C]55.5643102205105[/C][C]266.421016318773[/C][/ROW]
[ROW][C]Winsorized Mean ( 22 / 28 )[/C][C]14804.8095238095[/C][C]54.3691945514762[/C][C]272.301431829976[/C][/ROW]
[ROW][C]Winsorized Mean ( 23 / 28 )[/C][C]14807.5476190476[/C][C]53.3707773519072[/C][C]277.446729348012[/C][/ROW]
[ROW][C]Winsorized Mean ( 24 / 28 )[/C][C]14810.9761904762[/C][C]52.26114414804[/C][C]283.403213456659[/C][/ROW]
[ROW][C]Winsorized Mean ( 25 / 28 )[/C][C]14812.7619047619[/C][C]50.2869779826958[/C][C]294.564567189921[/C][/ROW]
[ROW][C]Winsorized Mean ( 26 / 28 )[/C][C]14810.9047619048[/C][C]48.8079403070732[/C][C]303.452771592543[/C][/ROW]
[ROW][C]Winsorized Mean ( 27 / 28 )[/C][C]14811.5476190476[/C][C]44.4001306535744[/C][C]333.592433198284[/C][/ROW]
[ROW][C]Winsorized Mean ( 28 / 28 )[/C][C]14807.2142857143[/C][C]42.166738908464[/C][C]351.158630451786[/C][/ROW]
[ROW][C]Trimmed Mean ( 1 / 28 )[/C][C]14794.7682926829[/C][C]87.6284161966719[/C][C]168.835281234318[/C][/ROW]
[ROW][C]Trimmed Mean ( 2 / 28 )[/C][C]14802.2375[/C][C]84.0943924960991[/C][C]176.019316635014[/C][/ROW]
[ROW][C]Trimmed Mean ( 3 / 28 )[/C][C]14803.8461538462[/C][C]81.8076658884091[/C][C]180.959155759798[/C][/ROW]
[ROW][C]Trimmed Mean ( 4 / 28 )[/C][C]14805.4473684211[/C][C]79.284485318304[/C][C]186.73826674893[/C][/ROW]
[ROW][C]Trimmed Mean ( 5 / 28 )[/C][C]14803.472972973[/C][C]77.6064107412689[/C][C]190.750645875456[/C][/ROW]
[ROW][C]Trimmed Mean ( 6 / 28 )[/C][C]14801.1944444444[/C][C]75.9561267578433[/C][C]194.865050078611[/C][/ROW]
[ROW][C]Trimmed Mean ( 7 / 28 )[/C][C]14798.4857142857[/C][C]74.1491606841816[/C][C]199.577251822389[/C][/ROW]
[ROW][C]Trimmed Mean ( 8 / 28 )[/C][C]14796.1176470588[/C][C]72.1761591503585[/C][C]205.000069569168[/C][/ROW]
[ROW][C]Trimmed Mean ( 9 / 28 )[/C][C]14797.2272727273[/C][C]70.7632936449727[/C][C]209.108797944971[/C][/ROW]
[ROW][C]Trimmed Mean ( 10 / 28 )[/C][C]14798.921875[/C][C]69.2161803007099[/C][C]213.807260249064[/C][/ROW]
[ROW][C]Trimmed Mean ( 11 / 28 )[/C][C]14800.5[/C][C]68.0662365603706[/C][C]217.442608081804[/C][/ROW]
[ROW][C]Trimmed Mean ( 12 / 28 )[/C][C]14801.75[/C][C]66.9330242230128[/C][C]221.142704544207[/C][/ROW]
[ROW][C]Trimmed Mean ( 13 / 28 )[/C][C]14802.3103448276[/C][C]65.7628105512611[/C][C]225.086340147969[/C][/ROW]
[ROW][C]Trimmed Mean ( 14 / 28 )[/C][C]14804.9464285714[/C][C]64.7924379287823[/C][C]228.49806091329[/C][/ROW]
[ROW][C]Trimmed Mean ( 15 / 28 )[/C][C]14808.2962962963[/C][C]63.6885801445701[/C][C]232.511013162519[/C][/ROW]
[ROW][C]Trimmed Mean ( 16 / 28 )[/C][C]14810.7115384615[/C][C]63.1612371851519[/C][C]234.490522961815[/C][/ROW]
[ROW][C]Trimmed Mean ( 17 / 28 )[/C][C]14812.94[/C][C]62.7458652024179[/C][C]236.07834479951[/C][/ROW]
[ROW][C]Trimmed Mean ( 18 / 28 )[/C][C]14815.2708333333[/C][C]62.2760508279291[/C][C]237.89676185904[/C][/ROW]
[ROW][C]Trimmed Mean ( 19 / 28 )[/C][C]14817.6956521739[/C][C]61.7743585281191[/C][C]239.868061850113[/C][/ROW]
[ROW][C]Trimmed Mean ( 20 / 28 )[/C][C]14820.25[/C][C]61.1165154597759[/C][C]242.491737110798[/C][/ROW]
[ROW][C]Trimmed Mean ( 21 / 28 )[/C][C]14822[/C][C]60.6110483904698[/C][C]244.542874502243[/C][/ROW]
[ROW][C]Trimmed Mean ( 22 / 28 )[/C][C]14823.85[/C][C]59.9189254593666[/C][C]247.398461944259[/C][/ROW]
[ROW][C]Trimmed Mean ( 23 / 28 )[/C][C]14825.7631578947[/C][C]59.1373913748396[/C][C]250.700323656861[/C][/ROW]
[ROW][C]Trimmed Mean ( 24 / 28 )[/C][C]14827.6111111111[/C][C]58.1876449791422[/C][C]254.824045833547[/C][/ROW]
[ROW][C]Trimmed Mean ( 25 / 28 )[/C][C]14829.3235294118[/C][C]57.0312439089067[/C][C]260.021043081191[/C][/ROW]
[ROW][C]Trimmed Mean ( 26 / 28 )[/C][C]14831.0625[/C][C]55.8033871655944[/C][C]265.773517582175[/C][/ROW]
[ROW][C]Trimmed Mean ( 27 / 28 )[/C][C]14833.2333333333[/C][C]54.3262110133325[/C][C]273.040086114105[/C][/ROW]
[ROW][C]Trimmed Mean ( 28 / 28 )[/C][C]14835.6428571429[/C][C]53.3542174955774[/C][C]278.059421607534[/C][/ROW]
[ROW][C]Median[/C][C]14940.5[/C][C][/C][C][/C][/ROW]
[ROW][C]Midrange[/C][C]14596[/C][C][/C][C][/C][/ROW]
[ROW][C]Midmean - Weighted Average at Xnp[/C][C]14806.976744186[/C][C][/C][C][/C][/ROW]
[ROW][C]Midmean - Weighted Average at X(n+1)p[/C][C]14822[/C][C][/C][C][/C][/ROW]
[ROW][C]Midmean - Empirical Distribution Function[/C][C]14806.976744186[/C][C][/C][C][/C][/ROW]
[ROW][C]Midmean - Empirical Distribution Function - Averaging[/C][C]14822[/C][C][/C][C][/C][/ROW]
[ROW][C]Midmean - Empirical Distribution Function - Interpolation[/C][C]14822[/C][C][/C][C][/C][/ROW]
[ROW][C]Midmean - Closest Observation[/C][C]14806.976744186[/C][C][/C][C][/C][/ROW]
[ROW][C]Midmean - True Basic - Statistics Graphics Toolkit[/C][C]14822[/C][C][/C][C][/C][/ROW]
[ROW][C]Midmean - MS Excel (old versions)[/C][C]14820.25[/C][C][/C][C][/C][/ROW]
[ROW][C]Number of observations[/C][C]84[/C][C][/C][C][/C][/ROW]
[/TABLE]
Source: https://freestatistics.org/blog/index.php?pk=&T=1

Globally Unique Identifier (entire table): ba.freestatistics.org/blog/index.php?pk=&T=1

As an alternative you can also use a QR Code:  

The GUIDs for individual cells are displayed in the table below:

Central Tendency - Ungrouped Data
MeasureValueS.E.Value/S.E.
Arithmetic Mean14790.035714285792.5153542736058159.865741534595
Geometric Mean14765.7472458977
Harmonic Mean14741.1740104693
Quadratic Mean14814.0325693002
Winsorized Mean ( 1 / 28 )14787.654761904890.6575876088901163.115467242531
Winsorized Mean ( 2 / 28 )14799.2587.7552025859152168.642423057608
Winsorized Mean ( 3 / 28 )14799.587.4244227329488169.283359699238
Winsorized Mean ( 4 / 28 )14812.404761904883.8397699995443176.675159795706
Winsorized Mean ( 5 / 28 )14813.238095238182.7450542936182179.022640346259
Winsorized Mean ( 6 / 28 )14814.738095238182.189320300752180.251376225368
Winsorized Mean ( 7 / 28 )14811.904761904881.4831264171874181.778797809855
Winsorized Mean ( 8 / 28 )14789.142857142977.3799555962103191.123692734029
Winsorized Mean ( 9 / 28 )14785.607142857176.643308855184192.914520050201
Winsorized Mean ( 10 / 28 )14787.273809523873.0960440484552202.299235232503
Winsorized Mean ( 11 / 28 )14790.678571428671.6608461272596206.398324479206
Winsorized Mean ( 12 / 28 )14797.107142857170.4440123016149210.05486001424
Winsorized Mean ( 13 / 28 )14779.464285714367.7769460346035218.060345743059
Winsorized Mean ( 14 / 28 )14774.797619047667.0460057747702220.368050986976
Winsorized Mean ( 15 / 28 )14785.86904761962.2308358493694237.597146909748
Winsorized Mean ( 16 / 28 )14789.488095238160.4553041682784244.635078736372
Winsorized Mean ( 17 / 28 )14790.297619047659.6837543995999247.81111322224
Winsorized Mean ( 18 / 28 )14791.36904761958.6715303518434252.104708346922
Winsorized Mean ( 19 / 28 )14792.273809523858.2440764994354253.970441263108
Winsorized Mean ( 20 / 28 )14802.7555.991557112403264.374680101921
Winsorized Mean ( 21 / 28 )14803.555.5643102205105266.421016318773
Winsorized Mean ( 22 / 28 )14804.809523809554.3691945514762272.301431829976
Winsorized Mean ( 23 / 28 )14807.547619047653.3707773519072277.446729348012
Winsorized Mean ( 24 / 28 )14810.976190476252.26114414804283.403213456659
Winsorized Mean ( 25 / 28 )14812.761904761950.2869779826958294.564567189921
Winsorized Mean ( 26 / 28 )14810.904761904848.8079403070732303.452771592543
Winsorized Mean ( 27 / 28 )14811.547619047644.4001306535744333.592433198284
Winsorized Mean ( 28 / 28 )14807.214285714342.166738908464351.158630451786
Trimmed Mean ( 1 / 28 )14794.768292682987.6284161966719168.835281234318
Trimmed Mean ( 2 / 28 )14802.237584.0943924960991176.019316635014
Trimmed Mean ( 3 / 28 )14803.846153846281.8076658884091180.959155759798
Trimmed Mean ( 4 / 28 )14805.447368421179.284485318304186.73826674893
Trimmed Mean ( 5 / 28 )14803.47297297377.6064107412689190.750645875456
Trimmed Mean ( 6 / 28 )14801.194444444475.9561267578433194.865050078611
Trimmed Mean ( 7 / 28 )14798.485714285774.1491606841816199.577251822389
Trimmed Mean ( 8 / 28 )14796.117647058872.1761591503585205.000069569168
Trimmed Mean ( 9 / 28 )14797.227272727370.7632936449727209.108797944971
Trimmed Mean ( 10 / 28 )14798.92187569.2161803007099213.807260249064
Trimmed Mean ( 11 / 28 )14800.568.0662365603706217.442608081804
Trimmed Mean ( 12 / 28 )14801.7566.9330242230128221.142704544207
Trimmed Mean ( 13 / 28 )14802.310344827665.7628105512611225.086340147969
Trimmed Mean ( 14 / 28 )14804.946428571464.7924379287823228.49806091329
Trimmed Mean ( 15 / 28 )14808.296296296363.6885801445701232.511013162519
Trimmed Mean ( 16 / 28 )14810.711538461563.1612371851519234.490522961815
Trimmed Mean ( 17 / 28 )14812.9462.7458652024179236.07834479951
Trimmed Mean ( 18 / 28 )14815.270833333362.2760508279291237.89676185904
Trimmed Mean ( 19 / 28 )14817.695652173961.7743585281191239.868061850113
Trimmed Mean ( 20 / 28 )14820.2561.1165154597759242.491737110798
Trimmed Mean ( 21 / 28 )1482260.6110483904698244.542874502243
Trimmed Mean ( 22 / 28 )14823.8559.9189254593666247.398461944259
Trimmed Mean ( 23 / 28 )14825.763157894759.1373913748396250.700323656861
Trimmed Mean ( 24 / 28 )14827.611111111158.1876449791422254.824045833547
Trimmed Mean ( 25 / 28 )14829.323529411857.0312439089067260.021043081191
Trimmed Mean ( 26 / 28 )14831.062555.8033871655944265.773517582175
Trimmed Mean ( 27 / 28 )14833.233333333354.3262110133325273.040086114105
Trimmed Mean ( 28 / 28 )14835.642857142953.3542174955774278.059421607534
Median14940.5
Midrange14596
Midmean - Weighted Average at Xnp14806.976744186
Midmean - Weighted Average at X(n+1)p14822
Midmean - Empirical Distribution Function14806.976744186
Midmean - Empirical Distribution Function - Averaging14822
Midmean - Empirical Distribution Function - Interpolation14822
Midmean - Closest Observation14806.976744186
Midmean - True Basic - Statistics Graphics Toolkit14822
Midmean - MS Excel (old versions)14820.25
Number of observations84


Parameters (Session):
Parameters (R input):
R code (references can be found in the software module):
geomean <- function(x) {
return(exp(mean(log(x))))
}
harmean <- function(x) {
return(1/mean(1/x))
}
quamean <- function(x) {
return(sqrt(mean(x*x)))
}
winmean <- function(x) {
x <-sort(x[!is.na(x)])
n<-length(x)
denom <- 3
nodenom <- n/denom
if (nodenom>40) denom <- n/40
sqrtn = sqrt(n)
roundnodenom = floor(nodenom)
win <- array(NA,dim=c(roundnodenom,2))
for (j in 1:roundnodenom) {
win[j,1] <- (j*x[j+1]+sum(x[(j+1):(n-j)])+j*x[n-j])/n
win[j,2] <- sd(c(rep(x[j+1],j),x[(j+1):(n-j)],rep(x[n-j],j)))/sqrtn
}
return(win)
}
trimean <- function(x) {
x <-sort(x[!is.na(x)])
n<-length(x)
denom <- 3
nodenom <- n/denom
if (nodenom>40) denom <- n/40
sqrtn = sqrt(n)
roundnodenom = floor(nodenom)
tri <- array(NA,dim=c(roundnodenom,2))
for (j in 1:roundnodenom) {
tri[j,1] <- mean(x,trim=j/n)
tri[j,2] <- sd(x[(j+1):(n-j)]) / sqrt(n-j*2)
}
return(tri)
}
midrange <- function(x) {
return((max(x)+min(x))/2)
}
q1 <- function(data,n,p,i,f) {
np <- n*p;
i <<- floor(np)
f <<- np - i
qvalue <- (1-f)*data[i] + f*data[i+1]
}
q2 <- function(data,n,p,i,f) {
np <- (n+1)*p
i <<- floor(np)
f <<- np - i
qvalue <- (1-f)*data[i] + f*data[i+1]
}
q3 <- function(data,n,p,i,f) {
np <- n*p
i <<- floor(np)
f <<- np - i
if (f==0) {
qvalue <- data[i]
} else {
qvalue <- data[i+1]
}
}
q4 <- function(data,n,p,i,f) {
np <- n*p
i <<- floor(np)
f <<- np - i
if (f==0) {
qvalue <- (data[i]+data[i+1])/2
} else {
qvalue <- data[i+1]
}
}
q5 <- function(data,n,p,i,f) {
np <- (n-1)*p
i <<- floor(np)
f <<- np - i
if (f==0) {
qvalue <- data[i+1]
} else {
qvalue <- data[i+1] + f*(data[i+2]-data[i+1])
}
}
q6 <- function(data,n,p,i,f) {
np <- n*p+0.5
i <<- floor(np)
f <<- np - i
qvalue <- data[i]
}
q7 <- function(data,n,p,i,f) {
np <- (n+1)*p
i <<- floor(np)
f <<- np - i
if (f==0) {
qvalue <- data[i]
} else {
qvalue <- f*data[i] + (1-f)*data[i+1]
}
}
q8 <- function(data,n,p,i,f) {
np <- (n+1)*p
i <<- floor(np)
f <<- np - i
if (f==0) {
qvalue <- data[i]
} else {
if (f == 0.5) {
qvalue <- (data[i]+data[i+1])/2
} else {
if (f < 0.5) {
qvalue <- data[i]
} else {
qvalue <- data[i+1]
}
}
}
}
midmean <- function(x,def) {
x <-sort(x[!is.na(x)])
n<-length(x)
if (def==1) {
qvalue1 <- q1(x,n,0.25,i,f)
qvalue3 <- q1(x,n,0.75,i,f)
}
if (def==2) {
qvalue1 <- q2(x,n,0.25,i,f)
qvalue3 <- q2(x,n,0.75,i,f)
}
if (def==3) {
qvalue1 <- q3(x,n,0.25,i,f)
qvalue3 <- q3(x,n,0.75,i,f)
}
if (def==4) {
qvalue1 <- q4(x,n,0.25,i,f)
qvalue3 <- q4(x,n,0.75,i,f)
}
if (def==5) {
qvalue1 <- q5(x,n,0.25,i,f)
qvalue3 <- q5(x,n,0.75,i,f)
}
if (def==6) {
qvalue1 <- q6(x,n,0.25,i,f)
qvalue3 <- q6(x,n,0.75,i,f)
}
if (def==7) {
qvalue1 <- q7(x,n,0.25,i,f)
qvalue3 <- q7(x,n,0.75,i,f)
}
if (def==8) {
qvalue1 <- q8(x,n,0.25,i,f)
qvalue3 <- q8(x,n,0.75,i,f)
}
midm <- 0
myn <- 0
roundno4 <- round(n/4)
round3no4 <- round(3*n/4)
for (i in 1:n) {
if ((x[i]>=qvalue1) & (x[i]<=qvalue3)){
midm = midm + x[i]
myn = myn + 1
}
}
midm = midm / myn
return(midm)
}
(arm <- mean(x))
sqrtn <- sqrt(length(x))
(armse <- sd(x) / sqrtn)
(armose <- arm / armse)
(geo <- geomean(x))
(har <- harmean(x))
(qua <- quamean(x))
(win <- winmean(x))
(tri <- trimean(x))
(midr <- midrange(x))
midm <- array(NA,dim=8)
for (j in 1:8) midm[j] <- midmean(x,j)
midm
bitmap(file='test1.png')
lb <- win[,1] - 2*win[,2]
ub <- win[,1] + 2*win[,2]
if ((ylimmin == '') | (ylimmax == '')) plot(win[,1],type='b',main=main, xlab='j', pch=19, ylab='Winsorized Mean(j/n)', ylim=c(min(lb),max(ub))) else plot(win[,1],type='l',main=main, xlab='j', pch=19, ylab='Winsorized Mean(j/n)', ylim=c(ylimmin,ylimmax))
lines(ub,lty=3)
lines(lb,lty=3)
grid()
dev.off()
bitmap(file='test2.png')
lb <- tri[,1] - 2*tri[,2]
ub <- tri[,1] + 2*tri[,2]
if ((ylimmin == '') | (ylimmax == '')) plot(tri[,1],type='b',main=main, xlab='j', pch=19, ylab='Trimmed Mean(j/n)', ylim=c(min(lb),max(ub))) else plot(tri[,1],type='l',main=main, xlab='j', pch=19, ylab='Trimmed Mean(j/n)', ylim=c(ylimmin,ylimmax))
lines(ub,lty=3)
lines(lb,lty=3)
grid()
dev.off()
load(file='createtable')
a<-table.start()
a<-table.row.start(a)
a<-table.element(a,'Central Tendency - Ungrouped Data',4,TRUE)
a<-table.row.end(a)
a<-table.row.start(a)
a<-table.element(a,'Measure',header=TRUE)
a<-table.element(a,'Value',header=TRUE)
a<-table.element(a,'S.E.',header=TRUE)
a<-table.element(a,'Value/S.E.',header=TRUE)
a<-table.row.end(a)
a<-table.row.start(a)
a<-table.element(a,hyperlink('arithmetic_mean.htm', 'Arithmetic Mean', 'click to view the definition of the Arithmetic Mean'),header=TRUE)
a<-table.element(a,arm)
a<-table.element(a,hyperlink('arithmetic_mean_standard_error.htm', armse, 'click to view the definition of the Standard Error of the Arithmetic Mean'))
a<-table.element(a,armose)
a<-table.row.end(a)
a<-table.row.start(a)
a<-table.element(a,hyperlink('geometric_mean.htm', 'Geometric Mean', 'click to view the definition of the Geometric Mean'),header=TRUE)
a<-table.element(a,geo)
a<-table.element(a,'')
a<-table.row.end(a)
a<-table.row.start(a)
a<-table.element(a,hyperlink('harmonic_mean.htm', 'Harmonic Mean', 'click to view the definition of the Harmonic Mean'),header=TRUE)
a<-table.element(a,har)
a<-table.element(a,'')
a<-table.row.end(a)
a<-table.row.start(a)
a<-table.element(a,hyperlink('quadratic_mean.htm', 'Quadratic Mean', 'click to view the definition of the Quadratic Mean'),header=TRUE)
a<-table.element(a,qua)
a<-table.element(a,'')
a<-table.row.end(a)
for (j in 1:length(win[,1])) {
a<-table.row.start(a)
mylabel <- paste('Winsorized Mean (',j)
mylabel <- paste(mylabel,'/')
mylabel <- paste(mylabel,length(win[,1]))
mylabel <- paste(mylabel,')')
a<-table.element(a,hyperlink('winsorized_mean.htm', mylabel, 'click to view the definition of the Winsorized Mean'),header=TRUE)
a<-table.element(a,win[j,1])
a<-table.element(a,win[j,2])
a<-table.element(a,win[j,1]/win[j,2])
a<-table.row.end(a)
}
for (j in 1:length(tri[,1])) {
a<-table.row.start(a)
mylabel <- paste('Trimmed Mean (',j)
mylabel <- paste(mylabel,'/')
mylabel <- paste(mylabel,length(tri[,1]))
mylabel <- paste(mylabel,')')
a<-table.element(a,hyperlink('arithmetic_mean.htm', mylabel, 'click to view the definition of the Trimmed Mean'),header=TRUE)
a<-table.element(a,tri[j,1])
a<-table.element(a,tri[j,2])
a<-table.element(a,tri[j,1]/tri[j,2])
a<-table.row.end(a)
}
a<-table.row.start(a)
a<-table.element(a,hyperlink('median_1.htm', 'Median', 'click to view the definition of the Median'),header=TRUE)
a<-table.element(a,median(x))
a<-table.element(a,'')
a<-table.row.end(a)
a<-table.row.start(a)
a<-table.element(a,hyperlink('midrange.htm', 'Midrange', 'click to view the definition of the Midrange'),header=TRUE)
a<-table.element(a,midr)
a<-table.element(a,'')
a<-table.row.end(a)
a<-table.row.start(a)
mymid <- hyperlink('midmean.htm', 'Midmean', 'click to view the definition of the Midmean')
mylabel <- paste(mymid,hyperlink('method_1.htm','Weighted Average at Xnp',''),sep=' - ')
a<-table.element(a,mylabel,header=TRUE)
a<-table.element(a,midm[1])
a<-table.element(a,'')
a<-table.row.end(a)
a<-table.row.start(a)
mymid <- hyperlink('midmean.htm', 'Midmean', 'click to view the definition of the Midmean')
mylabel <- paste(mymid,hyperlink('method_2.htm','Weighted Average at X(n+1)p',''),sep=' - ')
a<-table.element(a,mylabel,header=TRUE)
a<-table.element(a,midm[2])
a<-table.element(a,'')
a<-table.row.end(a)
a<-table.row.start(a)
mymid <- hyperlink('midmean.htm', 'Midmean', 'click to view the definition of the Midmean')
mylabel <- paste(mymid,hyperlink('method_3.htm','Empirical Distribution Function',''),sep=' - ')
a<-table.element(a,mylabel,header=TRUE)
a<-table.element(a,midm[3])
a<-table.element(a,'')
a<-table.row.end(a)
a<-table.row.start(a)
mymid <- hyperlink('midmean.htm', 'Midmean', 'click to view the definition of the Midmean')
mylabel <- paste(mymid,hyperlink('method_4.htm','Empirical Distribution Function - Averaging',''),sep=' - ')
a<-table.element(a,mylabel,header=TRUE)
a<-table.element(a,midm[4])
a<-table.element(a,'')
a<-table.row.end(a)
a<-table.row.start(a)
mymid <- hyperlink('midmean.htm', 'Midmean', 'click to view the definition of the Midmean')
mylabel <- paste(mymid,hyperlink('method_5.htm','Empirical Distribution Function - Interpolation',''),sep=' - ')
a<-table.element(a,mylabel,header=TRUE)
a<-table.element(a,midm[5])
a<-table.element(a,'')
a<-table.row.end(a)
a<-table.row.start(a)
mymid <- hyperlink('midmean.htm', 'Midmean', 'click to view the definition of the Midmean')
mylabel <- paste(mymid,hyperlink('method_6.htm','Closest Observation',''),sep=' - ')
a<-table.element(a,mylabel,header=TRUE)
a<-table.element(a,midm[6])
a<-table.element(a,'')
a<-table.row.end(a)
a<-table.row.start(a)
mymid <- hyperlink('midmean.htm', 'Midmean', 'click to view the definition of the Midmean')
mylabel <- paste(mymid,hyperlink('method_7.htm','True Basic - Statistics Graphics Toolkit',''),sep=' - ')
a<-table.element(a,mylabel,header=TRUE)
a<-table.element(a,midm[7])
a<-table.element(a,'')
a<-table.row.end(a)
a<-table.row.start(a)
mymid <- hyperlink('midmean.htm', 'Midmean', 'click to view the definition of the Midmean')
mylabel <- paste(mymid,hyperlink('method_8.htm','MS Excel (old versions)',''),sep=' - ')
a<-table.element(a,mylabel,header=TRUE)
a<-table.element(a,midm[8])
a<-table.element(a,'')
a<-table.row.end(a)
a<-table.row.start(a)
a<-table.element(a,'Number of observations',header=TRUE)
a<-table.element(a,length(x))
a<-table.element(a,'')
a<-table.row.end(a)
a<-table.end(a)
table.save(a,file='mytable.tab')