Free Statistics

of Irreproducible Research!

Author's title

Author*Unverified author*
R Software Modulerwasp_centraltendency.wasp
Title produced by softwareCentral Tendency
Date of computationThu, 13 Oct 2016 15:18:07 +0100
Cite this page as followsStatistical Computations at FreeStatistics.org, Office for Research Development and Education, URL https://freestatistics.org/blog/index.php?v=date/2016/Oct/13/t1476368322025rpisc8xvj468.htm/, Retrieved Tue, 30 Apr 2024 10:07:17 +0200
Statistical Computations at FreeStatistics.org, Office for Research Development and Education, URL https://freestatistics.org/blog/index.php?pk=, Retrieved Tue, 30 Apr 2024 10:07:17 +0200
QR Codes:

Original text written by user:
IsPrivate?No (this computation is public)
User-defined keywords
Estimated Impact0
Dataseries X:
89,8
101,7
92,7
116,2
134,2
153,3
129,7
137,6
158,8
197,1
171,1
184,4
216,6
219,3
184,2
205,3
216,8
219,4
172,1
165,3
178,9
163
116,2
121,8
124,1
125,7
81,8
94,8
121,5
136,3
109,6
120,7
154,1
154,4
153,3
157,3
192,1
223
220,6
221,7
239,2
251,2
238,3
240,6
250,3
256,7
239,2
189,9
155,9
138,4
124,7
119,4
116
124,9
123,4
124,4
135,5
143,6
130,6
116,6
118,2
116,1
106
94,9
97,1
96,8
93,7
91
105,7
112,9
112,1
112,9
127
136,5
130,9
136,3


Summary of computational transaction
Raw Inputview raw input (R code)
Raw Outputview raw output of R engine
Computing time1 seconds
R Server'Gertrude Mary Cox' @ cox.wessa.net

\begin{tabular}{lllllllll}
\hline
Summary of computational transaction \tabularnewline
Raw Input & view raw input (R code)  \tabularnewline
Raw Output & view raw output of R engine  \tabularnewline
Computing time & 1 seconds \tabularnewline
R Server & 'Gertrude Mary Cox' @ cox.wessa.net \tabularnewline
\hline
\end{tabular}
%Source: https://freestatistics.org/blog/index.php?pk=&T=0

[TABLE]
[ROW][C]Summary of computational transaction[/C][/ROW]
[ROW][C]Raw Input[/C][C]view raw input (R code) [/C][/ROW]
[ROW][C]Raw Output[/C][C]view raw output of R engine [/C][/ROW]
[ROW][C]Computing time[/C][C]1 seconds[/C][/ROW]
[ROW][C]R Server[/C][C]'Gertrude Mary Cox' @ cox.wessa.net[/C][/ROW]
[/TABLE]
Source: https://freestatistics.org/blog/index.php?pk=&T=0

Globally Unique Identifier (entire table): ba.freestatistics.org/blog/index.php?pk=&T=0

As an alternative you can also use a QR Code:  

The GUIDs for individual cells are displayed in the table below:

Summary of computational transaction
Raw Inputview raw input (R code)
Raw Outputview raw output of R engine
Computing time1 seconds
R Server'Gertrude Mary Cox' @ cox.wessa.net


Central Tendency - Ungrouped Data
MeasureValueS.E.Value/S.E.
Arithmetic Mean151.0973684210535.4594196638066427.6764523934213
Geometric Mean144.274025121284
Harmonic Mean138.135623924742
Quadratic Mean158.321854062174
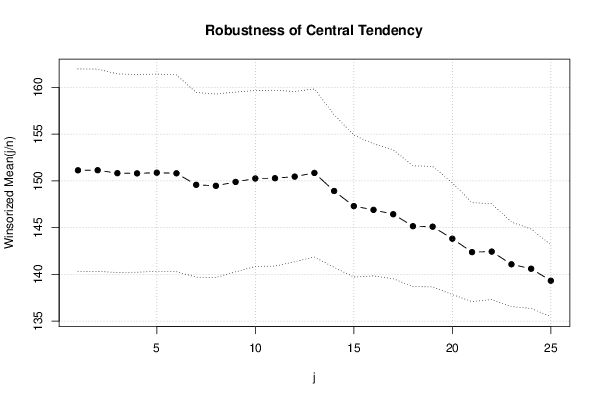
Winsorized Mean ( 1 / 25 )151.1302631578955.4243405354651827.8614998763042
Winsorized Mean ( 2 / 25 )151.1381578947375.4138166214691527.9171180817946
Winsorized Mean ( 3 / 25 )150.8223684210535.314039200736328.3818697461161
Winsorized Mean ( 4 / 25 )150.8013157894745.2899058106631628.507372567106
Winsorized Mean ( 5 / 25 )150.8736842105265.2795738027154728.5768681049457
Winsorized Mean ( 6 / 25 )150.8105263157895.2626561164316428.6567320720258
Winsorized Mean ( 7 / 25 )149.5763157894744.9415051575941930.2693837240263
Winsorized Mean ( 8 / 25 )149.4710526315794.910035486272430.4419495642086
Winsorized Mean ( 9 / 25 )149.8855263157894.8093471504821131.1654620941148
Winsorized Mean ( 10 / 25 )150.2539473684214.7100502626250531.9007099692138
Winsorized Mean ( 11 / 25 )150.2828947368424.7017527109515231.963164372043
Winsorized Mean ( 12 / 25 )150.4565789473684.5550836591875733.030475443387
Winsorized Mean ( 13 / 25 )150.854.4982926585656133.5349456893946
Winsorized Mean ( 14 / 25 )148.9157894736844.0863147952311336.4425642506725
Winsorized Mean ( 15 / 25 )147.2973684210533.7955985468324438.8074151161159
Winsorized Mean ( 16 / 25 )146.8973684210533.5362384483804641.540572154666
Winsorized Mean ( 17 / 25 )146.4276315789473.4503463333330242.438531507502
Winsorized Mean ( 18 / 25 )145.1486842105263.2325518101008344.9021988625138
Winsorized Mean ( 19 / 25 )145.0986842105263.224462143872544.9993449252489
Winsorized Mean ( 20 / 25 )143.8092105263162.9897651011594248.100504775625
Winsorized Mean ( 21 / 25 )142.3723684210532.648007260474153.7658527399817
Winsorized Mean ( 22 / 25 )142.4302631578952.5627965945508755.5761091070341
Winsorized Mean ( 23 / 25 )141.0684210526322.2588043806219562.452695002207
Winsorized Mean ( 24 / 25 )140.5947368421052.1254711714890566.1475623513672
Winsorized Mean ( 25 / 25 )139.3118421052631.9229509186292572.4469047834929
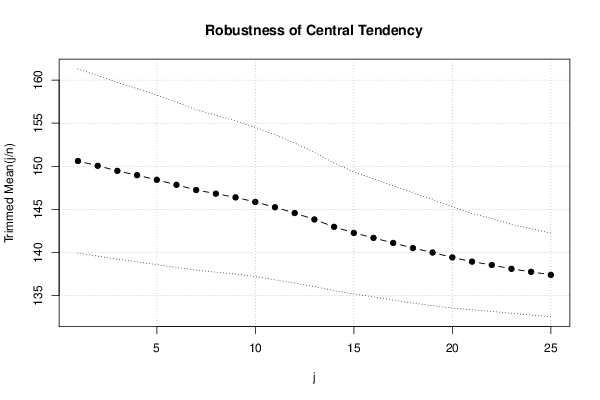
Trimmed Mean ( 1 / 25 )150.6067567567575.3378654529487828.2147907406616
Trimmed Mean ( 2 / 25 )150.0541666666675.234704575556228.6652598061321
Trimmed Mean ( 3 / 25 )149.4657142857145.1180441907394129.2036779510731
Trimmed Mean ( 4 / 25 )148.9602941176475.0235106335736229.6526284073335
Trimmed Mean ( 5 / 25 )148.4303030303034.9179330136544630.1814405804617
Trimmed Mean ( 6 / 25 )147.854.7928652745182130.8479357402472
Trimmed Mean ( 7 / 25 )147.2451612903234.6453758800836131.6971468168196
Trimmed Mean ( 8 / 25 )146.8233333333334.5510148906414232.2616684105466
Trimmed Mean ( 9 / 25 )146.3896551724144.4419259253761332.9563476815562
Trimmed Mean ( 10 / 25 )145.86254.3286200693229533.6972286003411
Trimmed Mean ( 11 / 25 )145.2444444444444.2075932713053734.5196018434034
Trimmed Mean ( 12 / 25 )144.5754.0556432156824435.6478596147103
Trimmed Mean ( 13 / 25 )143.833.894175923407836.934643639349
Trimmed Mean ( 14 / 25 )142.9753.6958819569510538.6849476431732
Trimmed Mean ( 15 / 25 )142.2739130434783.54436401602540.1408863198646
Trimmed Mean ( 16 / 25 )141.6954545454553.4193330991547541.4395001705103
Trimmed Mean ( 17 / 25 )141.1071428571433.3134319833388842.5864009180451
Trimmed Mean ( 18 / 25 )140.51253.1910636188002844.0331239941958
Trimmed Mean ( 19 / 25 )139.9973684210533.0823235006665245.4194273867684
Trimmed Mean ( 20 / 25 )139.4305555555562.9312568934347347.5668154053111
Trimmed Mean ( 21 / 25 )138.9411764705882.7908435644434449.7846522968035
Trimmed Mean ( 22 / 25 )138.5531252.6949249809079651.4126092494491
Trimmed Mean ( 23 / 25 )138.1066666666672.5758379211760653.6162099064102
Trimmed Mean ( 24 / 25 )137.7571428571432.5003990611205755.0940627834848
Trimmed Mean ( 25 / 25 )137.4115384615382.4248414820391456.6682562465832
Median135.9
Midrange169.25
Midmean - Weighted Average at Xnp139.38717948718
Midmean - Weighted Average at X(n+1)p139.38717948718
Midmean - Empirical Distribution Function139.38717948718
Midmean - Empirical Distribution Function - Averaging139.38717948718
Midmean - Empirical Distribution Function - Interpolation139.38717948718
Midmean - Closest Observation139.38717948718
Midmean - True Basic - Statistics Graphics Toolkit139.38717948718
Midmean - MS Excel (old versions)140.5125
Number of observations76

\begin{tabular}{lllllllll}
\hline
Central Tendency - Ungrouped Data \tabularnewline
Measure & Value & S.E. & Value/S.E. \tabularnewline
Arithmetic Mean & 151.097368421053 & 5.45941966380664 & 27.6764523934213 \tabularnewline
Geometric Mean & 144.274025121284 &  &  \tabularnewline
Harmonic Mean & 138.135623924742 &  &  \tabularnewline
Quadratic Mean & 158.321854062174 &  &  \tabularnewline
Winsorized Mean ( 1 / 25 ) & 151.130263157895 & 5.42434053546518 & 27.8614998763042 \tabularnewline
Winsorized Mean ( 2 / 25 ) & 151.138157894737 & 5.41381662146915 & 27.9171180817946 \tabularnewline
Winsorized Mean ( 3 / 25 ) & 150.822368421053 & 5.3140392007363 & 28.3818697461161 \tabularnewline
Winsorized Mean ( 4 / 25 ) & 150.801315789474 & 5.28990581066316 & 28.507372567106 \tabularnewline
Winsorized Mean ( 5 / 25 ) & 150.873684210526 & 5.27957380271547 & 28.5768681049457 \tabularnewline
Winsorized Mean ( 6 / 25 ) & 150.810526315789 & 5.26265611643164 & 28.6567320720258 \tabularnewline
Winsorized Mean ( 7 / 25 ) & 149.576315789474 & 4.94150515759419 & 30.2693837240263 \tabularnewline
Winsorized Mean ( 8 / 25 ) & 149.471052631579 & 4.9100354862724 & 30.4419495642086 \tabularnewline
Winsorized Mean ( 9 / 25 ) & 149.885526315789 & 4.80934715048211 & 31.1654620941148 \tabularnewline
Winsorized Mean ( 10 / 25 ) & 150.253947368421 & 4.71005026262505 & 31.9007099692138 \tabularnewline
Winsorized Mean ( 11 / 25 ) & 150.282894736842 & 4.70175271095152 & 31.963164372043 \tabularnewline
Winsorized Mean ( 12 / 25 ) & 150.456578947368 & 4.55508365918757 & 33.030475443387 \tabularnewline
Winsorized Mean ( 13 / 25 ) & 150.85 & 4.49829265856561 & 33.5349456893946 \tabularnewline
Winsorized Mean ( 14 / 25 ) & 148.915789473684 & 4.08631479523113 & 36.4425642506725 \tabularnewline
Winsorized Mean ( 15 / 25 ) & 147.297368421053 & 3.79559854683244 & 38.8074151161159 \tabularnewline
Winsorized Mean ( 16 / 25 ) & 146.897368421053 & 3.53623844838046 & 41.540572154666 \tabularnewline
Winsorized Mean ( 17 / 25 ) & 146.427631578947 & 3.45034633333302 & 42.438531507502 \tabularnewline
Winsorized Mean ( 18 / 25 ) & 145.148684210526 & 3.23255181010083 & 44.9021988625138 \tabularnewline
Winsorized Mean ( 19 / 25 ) & 145.098684210526 & 3.2244621438725 & 44.9993449252489 \tabularnewline
Winsorized Mean ( 20 / 25 ) & 143.809210526316 & 2.98976510115942 & 48.100504775625 \tabularnewline
Winsorized Mean ( 21 / 25 ) & 142.372368421053 & 2.6480072604741 & 53.7658527399817 \tabularnewline
Winsorized Mean ( 22 / 25 ) & 142.430263157895 & 2.56279659455087 & 55.5761091070341 \tabularnewline
Winsorized Mean ( 23 / 25 ) & 141.068421052632 & 2.25880438062195 & 62.452695002207 \tabularnewline
Winsorized Mean ( 24 / 25 ) & 140.594736842105 & 2.12547117148905 & 66.1475623513672 \tabularnewline
Winsorized Mean ( 25 / 25 ) & 139.311842105263 & 1.92295091862925 & 72.4469047834929 \tabularnewline
Trimmed Mean ( 1 / 25 ) & 150.606756756757 & 5.33786545294878 & 28.2147907406616 \tabularnewline
Trimmed Mean ( 2 / 25 ) & 150.054166666667 & 5.2347045755562 & 28.6652598061321 \tabularnewline
Trimmed Mean ( 3 / 25 ) & 149.465714285714 & 5.11804419073941 & 29.2036779510731 \tabularnewline
Trimmed Mean ( 4 / 25 ) & 148.960294117647 & 5.02351063357362 & 29.6526284073335 \tabularnewline
Trimmed Mean ( 5 / 25 ) & 148.430303030303 & 4.91793301365446 & 30.1814405804617 \tabularnewline
Trimmed Mean ( 6 / 25 ) & 147.85 & 4.79286527451821 & 30.8479357402472 \tabularnewline
Trimmed Mean ( 7 / 25 ) & 147.245161290323 & 4.64537588008361 & 31.6971468168196 \tabularnewline
Trimmed Mean ( 8 / 25 ) & 146.823333333333 & 4.55101489064142 & 32.2616684105466 \tabularnewline
Trimmed Mean ( 9 / 25 ) & 146.389655172414 & 4.44192592537613 & 32.9563476815562 \tabularnewline
Trimmed Mean ( 10 / 25 ) & 145.8625 & 4.32862006932295 & 33.6972286003411 \tabularnewline
Trimmed Mean ( 11 / 25 ) & 145.244444444444 & 4.20759327130537 & 34.5196018434034 \tabularnewline
Trimmed Mean ( 12 / 25 ) & 144.575 & 4.05564321568244 & 35.6478596147103 \tabularnewline
Trimmed Mean ( 13 / 25 ) & 143.83 & 3.8941759234078 & 36.934643639349 \tabularnewline
Trimmed Mean ( 14 / 25 ) & 142.975 & 3.69588195695105 & 38.6849476431732 \tabularnewline
Trimmed Mean ( 15 / 25 ) & 142.273913043478 & 3.544364016025 & 40.1408863198646 \tabularnewline
Trimmed Mean ( 16 / 25 ) & 141.695454545455 & 3.41933309915475 & 41.4395001705103 \tabularnewline
Trimmed Mean ( 17 / 25 ) & 141.107142857143 & 3.31343198333888 & 42.5864009180451 \tabularnewline
Trimmed Mean ( 18 / 25 ) & 140.5125 & 3.19106361880028 & 44.0331239941958 \tabularnewline
Trimmed Mean ( 19 / 25 ) & 139.997368421053 & 3.08232350066652 & 45.4194273867684 \tabularnewline
Trimmed Mean ( 20 / 25 ) & 139.430555555556 & 2.93125689343473 & 47.5668154053111 \tabularnewline
Trimmed Mean ( 21 / 25 ) & 138.941176470588 & 2.79084356444344 & 49.7846522968035 \tabularnewline
Trimmed Mean ( 22 / 25 ) & 138.553125 & 2.69492498090796 & 51.4126092494491 \tabularnewline
Trimmed Mean ( 23 / 25 ) & 138.106666666667 & 2.57583792117606 & 53.6162099064102 \tabularnewline
Trimmed Mean ( 24 / 25 ) & 137.757142857143 & 2.50039906112057 & 55.0940627834848 \tabularnewline
Trimmed Mean ( 25 / 25 ) & 137.411538461538 & 2.42484148203914 & 56.6682562465832 \tabularnewline
Median & 135.9 &  &  \tabularnewline
Midrange & 169.25 &  &  \tabularnewline
Midmean - Weighted Average at Xnp & 139.38717948718 &  &  \tabularnewline
Midmean - Weighted Average at X(n+1)p & 139.38717948718 &  &  \tabularnewline
Midmean - Empirical Distribution Function & 139.38717948718 &  &  \tabularnewline
Midmean - Empirical Distribution Function - Averaging & 139.38717948718 &  &  \tabularnewline
Midmean - Empirical Distribution Function - Interpolation & 139.38717948718 &  &  \tabularnewline
Midmean - Closest Observation & 139.38717948718 &  &  \tabularnewline
Midmean - True Basic - Statistics Graphics Toolkit & 139.38717948718 &  &  \tabularnewline
Midmean - MS Excel (old versions) & 140.5125 &  &  \tabularnewline
Number of observations & 76 &  &  \tabularnewline
\hline
\end{tabular}
%Source: https://freestatistics.org/blog/index.php?pk=&T=1

[TABLE]
[ROW][C]Central Tendency - Ungrouped Data[/C][/ROW]
[ROW][C]Measure[/C][C]Value[/C][C]S.E.[/C][C]Value/S.E.[/C][/ROW]
[ROW][C]Arithmetic Mean[/C][C]151.097368421053[/C][C]5.45941966380664[/C][C]27.6764523934213[/C][/ROW]
[ROW][C]Geometric Mean[/C][C]144.274025121284[/C][C][/C][C][/C][/ROW]
[ROW][C]Harmonic Mean[/C][C]138.135623924742[/C][C][/C][C][/C][/ROW]
[ROW][C]Quadratic Mean[/C][C]158.321854062174[/C][C][/C][C][/C][/ROW]
[ROW][C]Winsorized Mean ( 1 / 25 )[/C][C]151.130263157895[/C][C]5.42434053546518[/C][C]27.8614998763042[/C][/ROW]
[ROW][C]Winsorized Mean ( 2 / 25 )[/C][C]151.138157894737[/C][C]5.41381662146915[/C][C]27.9171180817946[/C][/ROW]
[ROW][C]Winsorized Mean ( 3 / 25 )[/C][C]150.822368421053[/C][C]5.3140392007363[/C][C]28.3818697461161[/C][/ROW]
[ROW][C]Winsorized Mean ( 4 / 25 )[/C][C]150.801315789474[/C][C]5.28990581066316[/C][C]28.507372567106[/C][/ROW]
[ROW][C]Winsorized Mean ( 5 / 25 )[/C][C]150.873684210526[/C][C]5.27957380271547[/C][C]28.5768681049457[/C][/ROW]
[ROW][C]Winsorized Mean ( 6 / 25 )[/C][C]150.810526315789[/C][C]5.26265611643164[/C][C]28.6567320720258[/C][/ROW]
[ROW][C]Winsorized Mean ( 7 / 25 )[/C][C]149.576315789474[/C][C]4.94150515759419[/C][C]30.2693837240263[/C][/ROW]
[ROW][C]Winsorized Mean ( 8 / 25 )[/C][C]149.471052631579[/C][C]4.9100354862724[/C][C]30.4419495642086[/C][/ROW]
[ROW][C]Winsorized Mean ( 9 / 25 )[/C][C]149.885526315789[/C][C]4.80934715048211[/C][C]31.1654620941148[/C][/ROW]
[ROW][C]Winsorized Mean ( 10 / 25 )[/C][C]150.253947368421[/C][C]4.71005026262505[/C][C]31.9007099692138[/C][/ROW]
[ROW][C]Winsorized Mean ( 11 / 25 )[/C][C]150.282894736842[/C][C]4.70175271095152[/C][C]31.963164372043[/C][/ROW]
[ROW][C]Winsorized Mean ( 12 / 25 )[/C][C]150.456578947368[/C][C]4.55508365918757[/C][C]33.030475443387[/C][/ROW]
[ROW][C]Winsorized Mean ( 13 / 25 )[/C][C]150.85[/C][C]4.49829265856561[/C][C]33.5349456893946[/C][/ROW]
[ROW][C]Winsorized Mean ( 14 / 25 )[/C][C]148.915789473684[/C][C]4.08631479523113[/C][C]36.4425642506725[/C][/ROW]
[ROW][C]Winsorized Mean ( 15 / 25 )[/C][C]147.297368421053[/C][C]3.79559854683244[/C][C]38.8074151161159[/C][/ROW]
[ROW][C]Winsorized Mean ( 16 / 25 )[/C][C]146.897368421053[/C][C]3.53623844838046[/C][C]41.540572154666[/C][/ROW]
[ROW][C]Winsorized Mean ( 17 / 25 )[/C][C]146.427631578947[/C][C]3.45034633333302[/C][C]42.438531507502[/C][/ROW]
[ROW][C]Winsorized Mean ( 18 / 25 )[/C][C]145.148684210526[/C][C]3.23255181010083[/C][C]44.9021988625138[/C][/ROW]
[ROW][C]Winsorized Mean ( 19 / 25 )[/C][C]145.098684210526[/C][C]3.2244621438725[/C][C]44.9993449252489[/C][/ROW]
[ROW][C]Winsorized Mean ( 20 / 25 )[/C][C]143.809210526316[/C][C]2.98976510115942[/C][C]48.100504775625[/C][/ROW]
[ROW][C]Winsorized Mean ( 21 / 25 )[/C][C]142.372368421053[/C][C]2.6480072604741[/C][C]53.7658527399817[/C][/ROW]
[ROW][C]Winsorized Mean ( 22 / 25 )[/C][C]142.430263157895[/C][C]2.56279659455087[/C][C]55.5761091070341[/C][/ROW]
[ROW][C]Winsorized Mean ( 23 / 25 )[/C][C]141.068421052632[/C][C]2.25880438062195[/C][C]62.452695002207[/C][/ROW]
[ROW][C]Winsorized Mean ( 24 / 25 )[/C][C]140.594736842105[/C][C]2.12547117148905[/C][C]66.1475623513672[/C][/ROW]
[ROW][C]Winsorized Mean ( 25 / 25 )[/C][C]139.311842105263[/C][C]1.92295091862925[/C][C]72.4469047834929[/C][/ROW]
[ROW][C]Trimmed Mean ( 1 / 25 )[/C][C]150.606756756757[/C][C]5.33786545294878[/C][C]28.2147907406616[/C][/ROW]
[ROW][C]Trimmed Mean ( 2 / 25 )[/C][C]150.054166666667[/C][C]5.2347045755562[/C][C]28.6652598061321[/C][/ROW]
[ROW][C]Trimmed Mean ( 3 / 25 )[/C][C]149.465714285714[/C][C]5.11804419073941[/C][C]29.2036779510731[/C][/ROW]
[ROW][C]Trimmed Mean ( 4 / 25 )[/C][C]148.960294117647[/C][C]5.02351063357362[/C][C]29.6526284073335[/C][/ROW]
[ROW][C]Trimmed Mean ( 5 / 25 )[/C][C]148.430303030303[/C][C]4.91793301365446[/C][C]30.1814405804617[/C][/ROW]
[ROW][C]Trimmed Mean ( 6 / 25 )[/C][C]147.85[/C][C]4.79286527451821[/C][C]30.8479357402472[/C][/ROW]
[ROW][C]Trimmed Mean ( 7 / 25 )[/C][C]147.245161290323[/C][C]4.64537588008361[/C][C]31.6971468168196[/C][/ROW]
[ROW][C]Trimmed Mean ( 8 / 25 )[/C][C]146.823333333333[/C][C]4.55101489064142[/C][C]32.2616684105466[/C][/ROW]
[ROW][C]Trimmed Mean ( 9 / 25 )[/C][C]146.389655172414[/C][C]4.44192592537613[/C][C]32.9563476815562[/C][/ROW]
[ROW][C]Trimmed Mean ( 10 / 25 )[/C][C]145.8625[/C][C]4.32862006932295[/C][C]33.6972286003411[/C][/ROW]
[ROW][C]Trimmed Mean ( 11 / 25 )[/C][C]145.244444444444[/C][C]4.20759327130537[/C][C]34.5196018434034[/C][/ROW]
[ROW][C]Trimmed Mean ( 12 / 25 )[/C][C]144.575[/C][C]4.05564321568244[/C][C]35.6478596147103[/C][/ROW]
[ROW][C]Trimmed Mean ( 13 / 25 )[/C][C]143.83[/C][C]3.8941759234078[/C][C]36.934643639349[/C][/ROW]
[ROW][C]Trimmed Mean ( 14 / 25 )[/C][C]142.975[/C][C]3.69588195695105[/C][C]38.6849476431732[/C][/ROW]
[ROW][C]Trimmed Mean ( 15 / 25 )[/C][C]142.273913043478[/C][C]3.544364016025[/C][C]40.1408863198646[/C][/ROW]
[ROW][C]Trimmed Mean ( 16 / 25 )[/C][C]141.695454545455[/C][C]3.41933309915475[/C][C]41.4395001705103[/C][/ROW]
[ROW][C]Trimmed Mean ( 17 / 25 )[/C][C]141.107142857143[/C][C]3.31343198333888[/C][C]42.5864009180451[/C][/ROW]
[ROW][C]Trimmed Mean ( 18 / 25 )[/C][C]140.5125[/C][C]3.19106361880028[/C][C]44.0331239941958[/C][/ROW]
[ROW][C]Trimmed Mean ( 19 / 25 )[/C][C]139.997368421053[/C][C]3.08232350066652[/C][C]45.4194273867684[/C][/ROW]
[ROW][C]Trimmed Mean ( 20 / 25 )[/C][C]139.430555555556[/C][C]2.93125689343473[/C][C]47.5668154053111[/C][/ROW]
[ROW][C]Trimmed Mean ( 21 / 25 )[/C][C]138.941176470588[/C][C]2.79084356444344[/C][C]49.7846522968035[/C][/ROW]
[ROW][C]Trimmed Mean ( 22 / 25 )[/C][C]138.553125[/C][C]2.69492498090796[/C][C]51.4126092494491[/C][/ROW]
[ROW][C]Trimmed Mean ( 23 / 25 )[/C][C]138.106666666667[/C][C]2.57583792117606[/C][C]53.6162099064102[/C][/ROW]
[ROW][C]Trimmed Mean ( 24 / 25 )[/C][C]137.757142857143[/C][C]2.50039906112057[/C][C]55.0940627834848[/C][/ROW]
[ROW][C]Trimmed Mean ( 25 / 25 )[/C][C]137.411538461538[/C][C]2.42484148203914[/C][C]56.6682562465832[/C][/ROW]
[ROW][C]Median[/C][C]135.9[/C][C][/C][C][/C][/ROW]
[ROW][C]Midrange[/C][C]169.25[/C][C][/C][C][/C][/ROW]
[ROW][C]Midmean - Weighted Average at Xnp[/C][C]139.38717948718[/C][C][/C][C][/C][/ROW]
[ROW][C]Midmean - Weighted Average at X(n+1)p[/C][C]139.38717948718[/C][C][/C][C][/C][/ROW]
[ROW][C]Midmean - Empirical Distribution Function[/C][C]139.38717948718[/C][C][/C][C][/C][/ROW]
[ROW][C]Midmean - Empirical Distribution Function - Averaging[/C][C]139.38717948718[/C][C][/C][C][/C][/ROW]
[ROW][C]Midmean - Empirical Distribution Function - Interpolation[/C][C]139.38717948718[/C][C][/C][C][/C][/ROW]
[ROW][C]Midmean - Closest Observation[/C][C]139.38717948718[/C][C][/C][C][/C][/ROW]
[ROW][C]Midmean - True Basic - Statistics Graphics Toolkit[/C][C]139.38717948718[/C][C][/C][C][/C][/ROW]
[ROW][C]Midmean - MS Excel (old versions)[/C][C]140.5125[/C][C][/C][C][/C][/ROW]
[ROW][C]Number of observations[/C][C]76[/C][C][/C][C][/C][/ROW]
[/TABLE]
Source: https://freestatistics.org/blog/index.php?pk=&T=1

Globally Unique Identifier (entire table): ba.freestatistics.org/blog/index.php?pk=&T=1

As an alternative you can also use a QR Code:  

The GUIDs for individual cells are displayed in the table below:

Central Tendency - Ungrouped Data
MeasureValueS.E.Value/S.E.
Arithmetic Mean151.0973684210535.4594196638066427.6764523934213
Geometric Mean144.274025121284
Harmonic Mean138.135623924742
Quadratic Mean158.321854062174
Winsorized Mean ( 1 / 25 )151.1302631578955.4243405354651827.8614998763042
Winsorized Mean ( 2 / 25 )151.1381578947375.4138166214691527.9171180817946
Winsorized Mean ( 3 / 25 )150.8223684210535.314039200736328.3818697461161
Winsorized Mean ( 4 / 25 )150.8013157894745.2899058106631628.507372567106
Winsorized Mean ( 5 / 25 )150.8736842105265.2795738027154728.5768681049457
Winsorized Mean ( 6 / 25 )150.8105263157895.2626561164316428.6567320720258
Winsorized Mean ( 7 / 25 )149.5763157894744.9415051575941930.2693837240263
Winsorized Mean ( 8 / 25 )149.4710526315794.910035486272430.4419495642086
Winsorized Mean ( 9 / 25 )149.8855263157894.8093471504821131.1654620941148
Winsorized Mean ( 10 / 25 )150.2539473684214.7100502626250531.9007099692138
Winsorized Mean ( 11 / 25 )150.2828947368424.7017527109515231.963164372043
Winsorized Mean ( 12 / 25 )150.4565789473684.5550836591875733.030475443387
Winsorized Mean ( 13 / 25 )150.854.4982926585656133.5349456893946
Winsorized Mean ( 14 / 25 )148.9157894736844.0863147952311336.4425642506725
Winsorized Mean ( 15 / 25 )147.2973684210533.7955985468324438.8074151161159
Winsorized Mean ( 16 / 25 )146.8973684210533.5362384483804641.540572154666
Winsorized Mean ( 17 / 25 )146.4276315789473.4503463333330242.438531507502
Winsorized Mean ( 18 / 25 )145.1486842105263.2325518101008344.9021988625138
Winsorized Mean ( 19 / 25 )145.0986842105263.224462143872544.9993449252489
Winsorized Mean ( 20 / 25 )143.8092105263162.9897651011594248.100504775625
Winsorized Mean ( 21 / 25 )142.3723684210532.648007260474153.7658527399817
Winsorized Mean ( 22 / 25 )142.4302631578952.5627965945508755.5761091070341
Winsorized Mean ( 23 / 25 )141.0684210526322.2588043806219562.452695002207
Winsorized Mean ( 24 / 25 )140.5947368421052.1254711714890566.1475623513672
Winsorized Mean ( 25 / 25 )139.3118421052631.9229509186292572.4469047834929
Trimmed Mean ( 1 / 25 )150.6067567567575.3378654529487828.2147907406616
Trimmed Mean ( 2 / 25 )150.0541666666675.234704575556228.6652598061321
Trimmed Mean ( 3 / 25 )149.4657142857145.1180441907394129.2036779510731
Trimmed Mean ( 4 / 25 )148.9602941176475.0235106335736229.6526284073335
Trimmed Mean ( 5 / 25 )148.4303030303034.9179330136544630.1814405804617
Trimmed Mean ( 6 / 25 )147.854.7928652745182130.8479357402472
Trimmed Mean ( 7 / 25 )147.2451612903234.6453758800836131.6971468168196
Trimmed Mean ( 8 / 25 )146.8233333333334.5510148906414232.2616684105466
Trimmed Mean ( 9 / 25 )146.3896551724144.4419259253761332.9563476815562
Trimmed Mean ( 10 / 25 )145.86254.3286200693229533.6972286003411
Trimmed Mean ( 11 / 25 )145.2444444444444.2075932713053734.5196018434034
Trimmed Mean ( 12 / 25 )144.5754.0556432156824435.6478596147103
Trimmed Mean ( 13 / 25 )143.833.894175923407836.934643639349
Trimmed Mean ( 14 / 25 )142.9753.6958819569510538.6849476431732
Trimmed Mean ( 15 / 25 )142.2739130434783.54436401602540.1408863198646
Trimmed Mean ( 16 / 25 )141.6954545454553.4193330991547541.4395001705103
Trimmed Mean ( 17 / 25 )141.1071428571433.3134319833388842.5864009180451
Trimmed Mean ( 18 / 25 )140.51253.1910636188002844.0331239941958
Trimmed Mean ( 19 / 25 )139.9973684210533.0823235006665245.4194273867684
Trimmed Mean ( 20 / 25 )139.4305555555562.9312568934347347.5668154053111
Trimmed Mean ( 21 / 25 )138.9411764705882.7908435644434449.7846522968035
Trimmed Mean ( 22 / 25 )138.5531252.6949249809079651.4126092494491
Trimmed Mean ( 23 / 25 )138.1066666666672.5758379211760653.6162099064102
Trimmed Mean ( 24 / 25 )137.7571428571432.5003990611205755.0940627834848
Trimmed Mean ( 25 / 25 )137.4115384615382.4248414820391456.6682562465832
Median135.9
Midrange169.25
Midmean - Weighted Average at Xnp139.38717948718
Midmean - Weighted Average at X(n+1)p139.38717948718
Midmean - Empirical Distribution Function139.38717948718
Midmean - Empirical Distribution Function - Averaging139.38717948718
Midmean - Empirical Distribution Function - Interpolation139.38717948718
Midmean - Closest Observation139.38717948718
Midmean - True Basic - Statistics Graphics Toolkit139.38717948718
Midmean - MS Excel (old versions)140.5125
Number of observations76


Parameters (Session):
Parameters (R input):
R code (references can be found in the software module):
geomean <- function(x) {
return(exp(mean(log(x))))
}
harmean <- function(x) {
return(1/mean(1/x))
}
quamean <- function(x) {
return(sqrt(mean(x*x)))
}
winmean <- function(x) {
x <-sort(x[!is.na(x)])
n<-length(x)
denom <- 3
nodenom <- n/denom
if (nodenom>40) denom <- n/40
sqrtn = sqrt(n)
roundnodenom = floor(nodenom)
win <- array(NA,dim=c(roundnodenom,2))
for (j in 1:roundnodenom) {
win[j,1] <- (j*x[j+1]+sum(x[(j+1):(n-j)])+j*x[n-j])/n
win[j,2] <- sd(c(rep(x[j+1],j),x[(j+1):(n-j)],rep(x[n-j],j)))/sqrtn
}
return(win)
}
trimean <- function(x) {
x <-sort(x[!is.na(x)])
n<-length(x)
denom <- 3
nodenom <- n/denom
if (nodenom>40) denom <- n/40
sqrtn = sqrt(n)
roundnodenom = floor(nodenom)
tri <- array(NA,dim=c(roundnodenom,2))
for (j in 1:roundnodenom) {
tri[j,1] <- mean(x,trim=j/n)
tri[j,2] <- sd(x[(j+1):(n-j)]) / sqrt(n-j*2)
}
return(tri)
}
midrange <- function(x) {
return((max(x)+min(x))/2)
}
q1 <- function(data,n,p,i,f) {
np <- n*p;
i <<- floor(np)
f <<- np - i
qvalue <- (1-f)*data[i] + f*data[i+1]
}
q2 <- function(data,n,p,i,f) {
np <- (n+1)*p
i <<- floor(np)
f <<- np - i
qvalue <- (1-f)*data[i] + f*data[i+1]
}
q3 <- function(data,n,p,i,f) {
np <- n*p
i <<- floor(np)
f <<- np - i
if (f==0) {
qvalue <- data[i]
} else {
qvalue <- data[i+1]
}
}
q4 <- function(data,n,p,i,f) {
np <- n*p
i <<- floor(np)
f <<- np - i
if (f==0) {
qvalue <- (data[i]+data[i+1])/2
} else {
qvalue <- data[i+1]
}
}
q5 <- function(data,n,p,i,f) {
np <- (n-1)*p
i <<- floor(np)
f <<- np - i
if (f==0) {
qvalue <- data[i+1]
} else {
qvalue <- data[i+1] + f*(data[i+2]-data[i+1])
}
}
q6 <- function(data,n,p,i,f) {
np <- n*p+0.5
i <<- floor(np)
f <<- np - i
qvalue <- data[i]
}
q7 <- function(data,n,p,i,f) {
np <- (n+1)*p
i <<- floor(np)
f <<- np - i
if (f==0) {
qvalue <- data[i]
} else {
qvalue <- f*data[i] + (1-f)*data[i+1]
}
}
q8 <- function(data,n,p,i,f) {
np <- (n+1)*p
i <<- floor(np)
f <<- np - i
if (f==0) {
qvalue <- data[i]
} else {
if (f == 0.5) {
qvalue <- (data[i]+data[i+1])/2
} else {
if (f < 0.5) {
qvalue <- data[i]
} else {
qvalue <- data[i+1]
}
}
}
}
midmean <- function(x,def) {
x <-sort(x[!is.na(x)])
n<-length(x)
if (def==1) {
qvalue1 <- q1(x,n,0.25,i,f)
qvalue3 <- q1(x,n,0.75,i,f)
}
if (def==2) {
qvalue1 <- q2(x,n,0.25,i,f)
qvalue3 <- q2(x,n,0.75,i,f)
}
if (def==3) {
qvalue1 <- q3(x,n,0.25,i,f)
qvalue3 <- q3(x,n,0.75,i,f)
}
if (def==4) {
qvalue1 <- q4(x,n,0.25,i,f)
qvalue3 <- q4(x,n,0.75,i,f)
}
if (def==5) {
qvalue1 <- q5(x,n,0.25,i,f)
qvalue3 <- q5(x,n,0.75,i,f)
}
if (def==6) {
qvalue1 <- q6(x,n,0.25,i,f)
qvalue3 <- q6(x,n,0.75,i,f)
}
if (def==7) {
qvalue1 <- q7(x,n,0.25,i,f)
qvalue3 <- q7(x,n,0.75,i,f)
}
if (def==8) {
qvalue1 <- q8(x,n,0.25,i,f)
qvalue3 <- q8(x,n,0.75,i,f)
}
midm <- 0
myn <- 0
roundno4 <- round(n/4)
round3no4 <- round(3*n/4)
for (i in 1:n) {
if ((x[i]>=qvalue1) & (x[i]<=qvalue3)){
midm = midm + x[i]
myn = myn + 1
}
}
midm = midm / myn
return(midm)
}
(arm <- mean(x))
sqrtn <- sqrt(length(x))
(armse <- sd(x) / sqrtn)
(armose <- arm / armse)
(geo <- geomean(x))
(har <- harmean(x))
(qua <- quamean(x))
(win <- winmean(x))
(tri <- trimean(x))
(midr <- midrange(x))
midm <- array(NA,dim=8)
for (j in 1:8) midm[j] <- midmean(x,j)
midm
bitmap(file='test1.png')
lb <- win[,1] - 2*win[,2]
ub <- win[,1] + 2*win[,2]
if ((ylimmin == '') | (ylimmax == '')) plot(win[,1],type='b',main=main, xlab='j', pch=19, ylab='Winsorized Mean(j/n)', ylim=c(min(lb),max(ub))) else plot(win[,1],type='l',main=main, xlab='j', pch=19, ylab='Winsorized Mean(j/n)', ylim=c(ylimmin,ylimmax))
lines(ub,lty=3)
lines(lb,lty=3)
grid()
dev.off()
bitmap(file='test2.png')
lb <- tri[,1] - 2*tri[,2]
ub <- tri[,1] + 2*tri[,2]
if ((ylimmin == '') | (ylimmax == '')) plot(tri[,1],type='b',main=main, xlab='j', pch=19, ylab='Trimmed Mean(j/n)', ylim=c(min(lb),max(ub))) else plot(tri[,1],type='l',main=main, xlab='j', pch=19, ylab='Trimmed Mean(j/n)', ylim=c(ylimmin,ylimmax))
lines(ub,lty=3)
lines(lb,lty=3)
grid()
dev.off()
load(file='createtable')
a<-table.start()
a<-table.row.start(a)
a<-table.element(a,'Central Tendency - Ungrouped Data',4,TRUE)
a<-table.row.end(a)
a<-table.row.start(a)
a<-table.element(a,'Measure',header=TRUE)
a<-table.element(a,'Value',header=TRUE)
a<-table.element(a,'S.E.',header=TRUE)
a<-table.element(a,'Value/S.E.',header=TRUE)
a<-table.row.end(a)
a<-table.row.start(a)
a<-table.element(a,hyperlink('arithmetic_mean.htm', 'Arithmetic Mean', 'click to view the definition of the Arithmetic Mean'),header=TRUE)
a<-table.element(a,arm)
a<-table.element(a,hyperlink('arithmetic_mean_standard_error.htm', armse, 'click to view the definition of the Standard Error of the Arithmetic Mean'))
a<-table.element(a,armose)
a<-table.row.end(a)
a<-table.row.start(a)
a<-table.element(a,hyperlink('geometric_mean.htm', 'Geometric Mean', 'click to view the definition of the Geometric Mean'),header=TRUE)
a<-table.element(a,geo)
a<-table.element(a,'')
a<-table.row.end(a)
a<-table.row.start(a)
a<-table.element(a,hyperlink('harmonic_mean.htm', 'Harmonic Mean', 'click to view the definition of the Harmonic Mean'),header=TRUE)
a<-table.element(a,har)
a<-table.element(a,'')
a<-table.row.end(a)
a<-table.row.start(a)
a<-table.element(a,hyperlink('quadratic_mean.htm', 'Quadratic Mean', 'click to view the definition of the Quadratic Mean'),header=TRUE)
a<-table.element(a,qua)
a<-table.element(a,'')
a<-table.row.end(a)
for (j in 1:length(win[,1])) {
a<-table.row.start(a)
mylabel <- paste('Winsorized Mean (',j)
mylabel <- paste(mylabel,'/')
mylabel <- paste(mylabel,length(win[,1]))
mylabel <- paste(mylabel,')')
a<-table.element(a,hyperlink('winsorized_mean.htm', mylabel, 'click to view the definition of the Winsorized Mean'),header=TRUE)
a<-table.element(a,win[j,1])
a<-table.element(a,win[j,2])
a<-table.element(a,win[j,1]/win[j,2])
a<-table.row.end(a)
}
for (j in 1:length(tri[,1])) {
a<-table.row.start(a)
mylabel <- paste('Trimmed Mean (',j)
mylabel <- paste(mylabel,'/')
mylabel <- paste(mylabel,length(tri[,1]))
mylabel <- paste(mylabel,')')
a<-table.element(a,hyperlink('arithmetic_mean.htm', mylabel, 'click to view the definition of the Trimmed Mean'),header=TRUE)
a<-table.element(a,tri[j,1])
a<-table.element(a,tri[j,2])
a<-table.element(a,tri[j,1]/tri[j,2])
a<-table.row.end(a)
}
a<-table.row.start(a)
a<-table.element(a,hyperlink('median_1.htm', 'Median', 'click to view the definition of the Median'),header=TRUE)
a<-table.element(a,median(x))
a<-table.element(a,'')
a<-table.row.end(a)
a<-table.row.start(a)
a<-table.element(a,hyperlink('midrange.htm', 'Midrange', 'click to view the definition of the Midrange'),header=TRUE)
a<-table.element(a,midr)
a<-table.element(a,'')
a<-table.row.end(a)
a<-table.row.start(a)
mymid <- hyperlink('midmean.htm', 'Midmean', 'click to view the definition of the Midmean')
mylabel <- paste(mymid,hyperlink('method_1.htm','Weighted Average at Xnp',''),sep=' - ')
a<-table.element(a,mylabel,header=TRUE)
a<-table.element(a,midm[1])
a<-table.element(a,'')
a<-table.row.end(a)
a<-table.row.start(a)
mymid <- hyperlink('midmean.htm', 'Midmean', 'click to view the definition of the Midmean')
mylabel <- paste(mymid,hyperlink('method_2.htm','Weighted Average at X(n+1)p',''),sep=' - ')
a<-table.element(a,mylabel,header=TRUE)
a<-table.element(a,midm[2])
a<-table.element(a,'')
a<-table.row.end(a)
a<-table.row.start(a)
mymid <- hyperlink('midmean.htm', 'Midmean', 'click to view the definition of the Midmean')
mylabel <- paste(mymid,hyperlink('method_3.htm','Empirical Distribution Function',''),sep=' - ')
a<-table.element(a,mylabel,header=TRUE)
a<-table.element(a,midm[3])
a<-table.element(a,'')
a<-table.row.end(a)
a<-table.row.start(a)
mymid <- hyperlink('midmean.htm', 'Midmean', 'click to view the definition of the Midmean')
mylabel <- paste(mymid,hyperlink('method_4.htm','Empirical Distribution Function - Averaging',''),sep=' - ')
a<-table.element(a,mylabel,header=TRUE)
a<-table.element(a,midm[4])
a<-table.element(a,'')
a<-table.row.end(a)
a<-table.row.start(a)
mymid <- hyperlink('midmean.htm', 'Midmean', 'click to view the definition of the Midmean')
mylabel <- paste(mymid,hyperlink('method_5.htm','Empirical Distribution Function - Interpolation',''),sep=' - ')
a<-table.element(a,mylabel,header=TRUE)
a<-table.element(a,midm[5])
a<-table.element(a,'')
a<-table.row.end(a)
a<-table.row.start(a)
mymid <- hyperlink('midmean.htm', 'Midmean', 'click to view the definition of the Midmean')
mylabel <- paste(mymid,hyperlink('method_6.htm','Closest Observation',''),sep=' - ')
a<-table.element(a,mylabel,header=TRUE)
a<-table.element(a,midm[6])
a<-table.element(a,'')
a<-table.row.end(a)
a<-table.row.start(a)
mymid <- hyperlink('midmean.htm', 'Midmean', 'click to view the definition of the Midmean')
mylabel <- paste(mymid,hyperlink('method_7.htm','True Basic - Statistics Graphics Toolkit',''),sep=' - ')
a<-table.element(a,mylabel,header=TRUE)
a<-table.element(a,midm[7])
a<-table.element(a,'')
a<-table.row.end(a)
a<-table.row.start(a)
mymid <- hyperlink('midmean.htm', 'Midmean', 'click to view the definition of the Midmean')
mylabel <- paste(mymid,hyperlink('method_8.htm','MS Excel (old versions)',''),sep=' - ')
a<-table.element(a,mylabel,header=TRUE)
a<-table.element(a,midm[8])
a<-table.element(a,'')
a<-table.row.end(a)
a<-table.row.start(a)
a<-table.element(a,'Number of observations',header=TRUE)
a<-table.element(a,length(x))
a<-table.element(a,'')
a<-table.row.end(a)
a<-table.end(a)
table.save(a,file='mytable.tab')