Free Statistics

of Irreproducible Research!

Author's title

Author*Unverified author*
R Software Modulerwasp_centraltendency.wasp
Title produced by softwareCentral Tendency
Date of computationThu, 13 Oct 2016 16:49:49 +0100
Cite this page as followsStatistical Computations at FreeStatistics.org, Office for Research Development and Education, URL https://freestatistics.org/blog/index.php?v=date/2016/Oct/13/t1476373810qtoc09285538t3g.htm/, Retrieved Tue, 30 Apr 2024 11:15:38 +0200
Statistical Computations at FreeStatistics.org, Office for Research Development and Education, URL https://freestatistics.org/blog/index.php?pk=, Retrieved Tue, 30 Apr 2024 11:15:38 +0200
QR Codes:

Original text written by user:
IsPrivate?No (this computation is public)
User-defined keywords
Estimated Impact0
Dataseries X:
97,78
97,73
97,61
97,69
97,68
97,67
97,67
97,96
98,27
99,52
99,59
99,75
99,75
99,8
99,99
100,25
100,08
100,08
100,08
100,06
101
101,81
101,82
101,96
101,96
101,93
102,03
102,11
102,07
102,34
102,34
102,33
102,77
103,08
103,38
103,44
99,1
99,15
99,21
99,01
99,08
99,11
100,11
100,31
100,55
101,38
101,49
101,5
100,69
100,8
100,58
100,34
100,38
100,33
101,06
101,15
101,36
101,98
102,24
102,34
101,91
101,8
101,8
101,73
101,8
101,81
102,28
101,7
101,7
102,37
102,43
102,41


Summary of computational transaction
Raw Inputview raw input (R code)
Raw Outputview raw output of R engine
Computing time2 seconds
R Server'Sir Maurice George Kendall' @ kendall.wessa.net

\begin{tabular}{lllllllll}
\hline
Summary of computational transaction \tabularnewline
Raw Input & view raw input (R code)  \tabularnewline
Raw Output & view raw output of R engine  \tabularnewline
Computing time & 2 seconds \tabularnewline
R Server & 'Sir Maurice George Kendall' @ kendall.wessa.net \tabularnewline
\hline
\end{tabular}
%Source: https://freestatistics.org/blog/index.php?pk=&T=0

[TABLE]
[ROW][C]Summary of computational transaction[/C][/ROW]
[ROW][C]Raw Input[/C][C]view raw input (R code) [/C][/ROW]
[ROW][C]Raw Output[/C][C]view raw output of R engine [/C][/ROW]
[ROW][C]Computing time[/C][C]2 seconds[/C][/ROW]
[ROW][C]R Server[/C][C]'Sir Maurice George Kendall' @ kendall.wessa.net[/C][/ROW]
[/TABLE]
Source: https://freestatistics.org/blog/index.php?pk=&T=0

Globally Unique Identifier (entire table): ba.freestatistics.org/blog/index.php?pk=&T=0

As an alternative you can also use a QR Code:  

The GUIDs for individual cells are displayed in the table below:

Summary of computational transaction
Raw Inputview raw input (R code)
Raw Outputview raw output of R engine
Computing time2 seconds
R Server'Sir Maurice George Kendall' @ kendall.wessa.net


Central Tendency - Ungrouped Data
MeasureValueS.E.Value/S.E.
Arithmetic Mean100.7273611111110.18542848836667543.2140551776
Geometric Mean100.715176814136
Harmonic Mean100.702926571527
Quadratic Mean100.739478462186
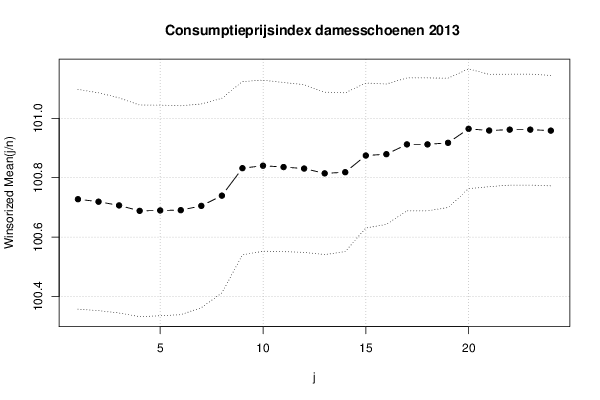
Winsorized Mean ( 1 / 24 )100.7273611111110.185062903599178544.287154000748
Winsorized Mean ( 2 / 24 )100.7190277777780.18346614477939548.978820582336
Winsorized Mean ( 3 / 24 )100.7065277777780.181160854146817555.895633480304
Winsorized Mean ( 4 / 24 )100.6881944444440.17821266664734564.988989495867
Winsorized Mean ( 5 / 24 )100.6895833333330.177366674728884567.69166748626
Winsorized Mean ( 6 / 24 )100.6904166666670.175939845751783572.300244077293
Winsorized Mean ( 7 / 24 )100.7050.171536369713788587.076665829109
Winsorized Mean ( 8 / 24 )100.7394444444440.163997033362907614.276016941838
Winsorized Mean ( 9 / 24 )100.8319444444440.145959353851932690.822080143852
Winsorized Mean ( 10 / 24 )100.8402777777780.144065844718059699.959646751282
Winsorized Mean ( 11 / 24 )100.8356944444440.142438909617286707.922397857274
Winsorized Mean ( 12 / 24 )100.8306944444440.141208223479661714.056815954259
Winsorized Mean ( 13 / 24 )100.8144444444440.136752361900922737.204411266295
Winsorized Mean ( 14 / 24 )100.8183333333330.133732530340832753.88039900529
Winsorized Mean ( 15 / 24 )100.8745833333330.122093107173374826.210305141062
Winsorized Mean ( 16 / 24 )100.8790277777780.118213448450052853.363378705609
Winsorized Mean ( 17 / 24 )100.9120833333330.111925447727417901.600890434626
Winsorized Mean ( 18 / 24 )100.9120833333330.111925447727417901.600890434626
Winsorized Mean ( 19 / 24 )100.9173611111110.108967625422783926.122421403256
Winsorized Mean ( 20 / 24 )100.9645833333330.100825027303111001.38414076302
Winsorized Mean ( 21 / 24 )100.958750.09465217965508491066.62889716747
Winsorized Mean ( 22 / 24 )100.9618055555560.09344630285657211080.42589668335
Winsorized Mean ( 23 / 24 )100.9618055555560.09344630285657211080.42589668335
Winsorized Mean ( 24 / 24 )100.9584722222220.09302086774357511085.33143875338
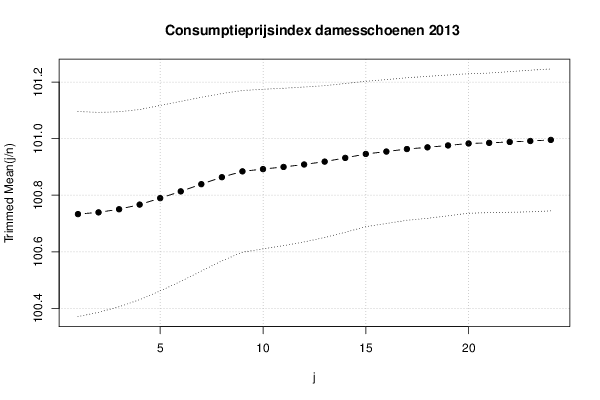
Trimmed Mean ( 1 / 24 )100.7331428571430.181260201295802555.737785443338
Trimmed Mean ( 2 / 24 )100.7392647058820.176729919013866570.018168219602
Trimmed Mean ( 3 / 24 )100.7503030303030.172322807841629584.660291299899
Trimmed Mean ( 4 / 24 )100.766718750.168051546131293599.617921225636
Trimmed Mean ( 5 / 24 )100.7895161290320.163905989264363614.922716255776
Trimmed Mean ( 6 / 24 )100.81350.159078352758583633.73487499581
Trimmed Mean ( 7 / 24 )100.8389655172410.153523388156794656.831292794646
Trimmed Mean ( 8 / 24 )100.8635714285710.147869156924537682.11365727909
Trimmed Mean ( 9 / 24 )100.8842592592590.142866139732374706.145343103987
Trimmed Mean ( 10 / 24 )100.8923076923080.141074473925689715.170539962125
Trimmed Mean ( 11 / 24 )100.89980.139131266751062725.212975890842
Trimmed Mean ( 12 / 24 )100.9085416666670.13689502293176737.123523599308
Trimmed Mean ( 13 / 24 )100.9186956521740.134174379540894752.145797114835
Trimmed Mean ( 14 / 24 )100.9318181818180.131487373780797767.616047682892
Trimmed Mean ( 15 / 24 )100.9457142857140.128518830381911785.454660501816
Trimmed Mean ( 16 / 24 )100.954250.127176380396555793.812889509904
Trimmed Mean ( 17 / 24 )100.9631578947370.125980707764151801.41761136753
Trimmed Mean ( 18 / 24 )100.9691666666670.125508726693368804.479252772167
Trimmed Mean ( 19 / 24 )100.9758823529410.124453971509274811.351225906171
Trimmed Mean ( 20 / 24 )100.98281250.123310546188926818.930866993992
Trimmed Mean ( 21 / 24 )100.9850.123355154950547818.652451455997
Trimmed Mean ( 22 / 24 )100.9882142857140.124324687528058812.294133157765
Trimmed Mean ( 23 / 24 )100.9915384615380.125175190842143806.801553743168
Trimmed Mean ( 24 / 24 )100.9954166666670.125423888761195805.232700597891
Median101.03
Midrange100.525
Midmean - Weighted Average at Xnp100.963157894737
Midmean - Weighted Average at X(n+1)p100.963157894737
Midmean - Empirical Distribution Function100.963157894737
Midmean - Empirical Distribution Function - Averaging100.963157894737
Midmean - Empirical Distribution Function - Interpolation100.963157894737
Midmean - Closest Observation100.963157894737
Midmean - True Basic - Statistics Graphics Toolkit100.963157894737
Midmean - MS Excel (old versions)100.963157894737
Number of observations72

\begin{tabular}{lllllllll}
\hline
Central Tendency - Ungrouped Data \tabularnewline
Measure & Value & S.E. & Value/S.E. \tabularnewline
Arithmetic Mean & 100.727361111111 & 0.18542848836667 & 543.2140551776 \tabularnewline
Geometric Mean & 100.715176814136 &  &  \tabularnewline
Harmonic Mean & 100.702926571527 &  &  \tabularnewline
Quadratic Mean & 100.739478462186 &  &  \tabularnewline
Winsorized Mean ( 1 / 24 ) & 100.727361111111 & 0.185062903599178 & 544.287154000748 \tabularnewline
Winsorized Mean ( 2 / 24 ) & 100.719027777778 & 0.18346614477939 & 548.978820582336 \tabularnewline
Winsorized Mean ( 3 / 24 ) & 100.706527777778 & 0.181160854146817 & 555.895633480304 \tabularnewline
Winsorized Mean ( 4 / 24 ) & 100.688194444444 & 0.17821266664734 & 564.988989495867 \tabularnewline
Winsorized Mean ( 5 / 24 ) & 100.689583333333 & 0.177366674728884 & 567.69166748626 \tabularnewline
Winsorized Mean ( 6 / 24 ) & 100.690416666667 & 0.175939845751783 & 572.300244077293 \tabularnewline
Winsorized Mean ( 7 / 24 ) & 100.705 & 0.171536369713788 & 587.076665829109 \tabularnewline
Winsorized Mean ( 8 / 24 ) & 100.739444444444 & 0.163997033362907 & 614.276016941838 \tabularnewline
Winsorized Mean ( 9 / 24 ) & 100.831944444444 & 0.145959353851932 & 690.822080143852 \tabularnewline
Winsorized Mean ( 10 / 24 ) & 100.840277777778 & 0.144065844718059 & 699.959646751282 \tabularnewline
Winsorized Mean ( 11 / 24 ) & 100.835694444444 & 0.142438909617286 & 707.922397857274 \tabularnewline
Winsorized Mean ( 12 / 24 ) & 100.830694444444 & 0.141208223479661 & 714.056815954259 \tabularnewline
Winsorized Mean ( 13 / 24 ) & 100.814444444444 & 0.136752361900922 & 737.204411266295 \tabularnewline
Winsorized Mean ( 14 / 24 ) & 100.818333333333 & 0.133732530340832 & 753.88039900529 \tabularnewline
Winsorized Mean ( 15 / 24 ) & 100.874583333333 & 0.122093107173374 & 826.210305141062 \tabularnewline
Winsorized Mean ( 16 / 24 ) & 100.879027777778 & 0.118213448450052 & 853.363378705609 \tabularnewline
Winsorized Mean ( 17 / 24 ) & 100.912083333333 & 0.111925447727417 & 901.600890434626 \tabularnewline
Winsorized Mean ( 18 / 24 ) & 100.912083333333 & 0.111925447727417 & 901.600890434626 \tabularnewline
Winsorized Mean ( 19 / 24 ) & 100.917361111111 & 0.108967625422783 & 926.122421403256 \tabularnewline
Winsorized Mean ( 20 / 24 ) & 100.964583333333 & 0.10082502730311 & 1001.38414076302 \tabularnewline
Winsorized Mean ( 21 / 24 ) & 100.95875 & 0.0946521796550849 & 1066.62889716747 \tabularnewline
Winsorized Mean ( 22 / 24 ) & 100.961805555556 & 0.0934463028565721 & 1080.42589668335 \tabularnewline
Winsorized Mean ( 23 / 24 ) & 100.961805555556 & 0.0934463028565721 & 1080.42589668335 \tabularnewline
Winsorized Mean ( 24 / 24 ) & 100.958472222222 & 0.0930208677435751 & 1085.33143875338 \tabularnewline
Trimmed Mean ( 1 / 24 ) & 100.733142857143 & 0.181260201295802 & 555.737785443338 \tabularnewline
Trimmed Mean ( 2 / 24 ) & 100.739264705882 & 0.176729919013866 & 570.018168219602 \tabularnewline
Trimmed Mean ( 3 / 24 ) & 100.750303030303 & 0.172322807841629 & 584.660291299899 \tabularnewline
Trimmed Mean ( 4 / 24 ) & 100.76671875 & 0.168051546131293 & 599.617921225636 \tabularnewline
Trimmed Mean ( 5 / 24 ) & 100.789516129032 & 0.163905989264363 & 614.922716255776 \tabularnewline
Trimmed Mean ( 6 / 24 ) & 100.8135 & 0.159078352758583 & 633.73487499581 \tabularnewline
Trimmed Mean ( 7 / 24 ) & 100.838965517241 & 0.153523388156794 & 656.831292794646 \tabularnewline
Trimmed Mean ( 8 / 24 ) & 100.863571428571 & 0.147869156924537 & 682.11365727909 \tabularnewline
Trimmed Mean ( 9 / 24 ) & 100.884259259259 & 0.142866139732374 & 706.145343103987 \tabularnewline
Trimmed Mean ( 10 / 24 ) & 100.892307692308 & 0.141074473925689 & 715.170539962125 \tabularnewline
Trimmed Mean ( 11 / 24 ) & 100.8998 & 0.139131266751062 & 725.212975890842 \tabularnewline
Trimmed Mean ( 12 / 24 ) & 100.908541666667 & 0.13689502293176 & 737.123523599308 \tabularnewline
Trimmed Mean ( 13 / 24 ) & 100.918695652174 & 0.134174379540894 & 752.145797114835 \tabularnewline
Trimmed Mean ( 14 / 24 ) & 100.931818181818 & 0.131487373780797 & 767.616047682892 \tabularnewline
Trimmed Mean ( 15 / 24 ) & 100.945714285714 & 0.128518830381911 & 785.454660501816 \tabularnewline
Trimmed Mean ( 16 / 24 ) & 100.95425 & 0.127176380396555 & 793.812889509904 \tabularnewline
Trimmed Mean ( 17 / 24 ) & 100.963157894737 & 0.125980707764151 & 801.41761136753 \tabularnewline
Trimmed Mean ( 18 / 24 ) & 100.969166666667 & 0.125508726693368 & 804.479252772167 \tabularnewline
Trimmed Mean ( 19 / 24 ) & 100.975882352941 & 0.124453971509274 & 811.351225906171 \tabularnewline
Trimmed Mean ( 20 / 24 ) & 100.9828125 & 0.123310546188926 & 818.930866993992 \tabularnewline
Trimmed Mean ( 21 / 24 ) & 100.985 & 0.123355154950547 & 818.652451455997 \tabularnewline
Trimmed Mean ( 22 / 24 ) & 100.988214285714 & 0.124324687528058 & 812.294133157765 \tabularnewline
Trimmed Mean ( 23 / 24 ) & 100.991538461538 & 0.125175190842143 & 806.801553743168 \tabularnewline
Trimmed Mean ( 24 / 24 ) & 100.995416666667 & 0.125423888761195 & 805.232700597891 \tabularnewline
Median & 101.03 &  &  \tabularnewline
Midrange & 100.525 &  &  \tabularnewline
Midmean - Weighted Average at Xnp & 100.963157894737 &  &  \tabularnewline
Midmean - Weighted Average at X(n+1)p & 100.963157894737 &  &  \tabularnewline
Midmean - Empirical Distribution Function & 100.963157894737 &  &  \tabularnewline
Midmean - Empirical Distribution Function - Averaging & 100.963157894737 &  &  \tabularnewline
Midmean - Empirical Distribution Function - Interpolation & 100.963157894737 &  &  \tabularnewline
Midmean - Closest Observation & 100.963157894737 &  &  \tabularnewline
Midmean - True Basic - Statistics Graphics Toolkit & 100.963157894737 &  &  \tabularnewline
Midmean - MS Excel (old versions) & 100.963157894737 &  &  \tabularnewline
Number of observations & 72 &  &  \tabularnewline
\hline
\end{tabular}
%Source: https://freestatistics.org/blog/index.php?pk=&T=1

[TABLE]
[ROW][C]Central Tendency - Ungrouped Data[/C][/ROW]
[ROW][C]Measure[/C][C]Value[/C][C]S.E.[/C][C]Value/S.E.[/C][/ROW]
[ROW][C]Arithmetic Mean[/C][C]100.727361111111[/C][C]0.18542848836667[/C][C]543.2140551776[/C][/ROW]
[ROW][C]Geometric Mean[/C][C]100.715176814136[/C][C][/C][C][/C][/ROW]
[ROW][C]Harmonic Mean[/C][C]100.702926571527[/C][C][/C][C][/C][/ROW]
[ROW][C]Quadratic Mean[/C][C]100.739478462186[/C][C][/C][C][/C][/ROW]
[ROW][C]Winsorized Mean ( 1 / 24 )[/C][C]100.727361111111[/C][C]0.185062903599178[/C][C]544.287154000748[/C][/ROW]
[ROW][C]Winsorized Mean ( 2 / 24 )[/C][C]100.719027777778[/C][C]0.18346614477939[/C][C]548.978820582336[/C][/ROW]
[ROW][C]Winsorized Mean ( 3 / 24 )[/C][C]100.706527777778[/C][C]0.181160854146817[/C][C]555.895633480304[/C][/ROW]
[ROW][C]Winsorized Mean ( 4 / 24 )[/C][C]100.688194444444[/C][C]0.17821266664734[/C][C]564.988989495867[/C][/ROW]
[ROW][C]Winsorized Mean ( 5 / 24 )[/C][C]100.689583333333[/C][C]0.177366674728884[/C][C]567.69166748626[/C][/ROW]
[ROW][C]Winsorized Mean ( 6 / 24 )[/C][C]100.690416666667[/C][C]0.175939845751783[/C][C]572.300244077293[/C][/ROW]
[ROW][C]Winsorized Mean ( 7 / 24 )[/C][C]100.705[/C][C]0.171536369713788[/C][C]587.076665829109[/C][/ROW]
[ROW][C]Winsorized Mean ( 8 / 24 )[/C][C]100.739444444444[/C][C]0.163997033362907[/C][C]614.276016941838[/C][/ROW]
[ROW][C]Winsorized Mean ( 9 / 24 )[/C][C]100.831944444444[/C][C]0.145959353851932[/C][C]690.822080143852[/C][/ROW]
[ROW][C]Winsorized Mean ( 10 / 24 )[/C][C]100.840277777778[/C][C]0.144065844718059[/C][C]699.959646751282[/C][/ROW]
[ROW][C]Winsorized Mean ( 11 / 24 )[/C][C]100.835694444444[/C][C]0.142438909617286[/C][C]707.922397857274[/C][/ROW]
[ROW][C]Winsorized Mean ( 12 / 24 )[/C][C]100.830694444444[/C][C]0.141208223479661[/C][C]714.056815954259[/C][/ROW]
[ROW][C]Winsorized Mean ( 13 / 24 )[/C][C]100.814444444444[/C][C]0.136752361900922[/C][C]737.204411266295[/C][/ROW]
[ROW][C]Winsorized Mean ( 14 / 24 )[/C][C]100.818333333333[/C][C]0.133732530340832[/C][C]753.88039900529[/C][/ROW]
[ROW][C]Winsorized Mean ( 15 / 24 )[/C][C]100.874583333333[/C][C]0.122093107173374[/C][C]826.210305141062[/C][/ROW]
[ROW][C]Winsorized Mean ( 16 / 24 )[/C][C]100.879027777778[/C][C]0.118213448450052[/C][C]853.363378705609[/C][/ROW]
[ROW][C]Winsorized Mean ( 17 / 24 )[/C][C]100.912083333333[/C][C]0.111925447727417[/C][C]901.600890434626[/C][/ROW]
[ROW][C]Winsorized Mean ( 18 / 24 )[/C][C]100.912083333333[/C][C]0.111925447727417[/C][C]901.600890434626[/C][/ROW]
[ROW][C]Winsorized Mean ( 19 / 24 )[/C][C]100.917361111111[/C][C]0.108967625422783[/C][C]926.122421403256[/C][/ROW]
[ROW][C]Winsorized Mean ( 20 / 24 )[/C][C]100.964583333333[/C][C]0.10082502730311[/C][C]1001.38414076302[/C][/ROW]
[ROW][C]Winsorized Mean ( 21 / 24 )[/C][C]100.95875[/C][C]0.0946521796550849[/C][C]1066.62889716747[/C][/ROW]
[ROW][C]Winsorized Mean ( 22 / 24 )[/C][C]100.961805555556[/C][C]0.0934463028565721[/C][C]1080.42589668335[/C][/ROW]
[ROW][C]Winsorized Mean ( 23 / 24 )[/C][C]100.961805555556[/C][C]0.0934463028565721[/C][C]1080.42589668335[/C][/ROW]
[ROW][C]Winsorized Mean ( 24 / 24 )[/C][C]100.958472222222[/C][C]0.0930208677435751[/C][C]1085.33143875338[/C][/ROW]
[ROW][C]Trimmed Mean ( 1 / 24 )[/C][C]100.733142857143[/C][C]0.181260201295802[/C][C]555.737785443338[/C][/ROW]
[ROW][C]Trimmed Mean ( 2 / 24 )[/C][C]100.739264705882[/C][C]0.176729919013866[/C][C]570.018168219602[/C][/ROW]
[ROW][C]Trimmed Mean ( 3 / 24 )[/C][C]100.750303030303[/C][C]0.172322807841629[/C][C]584.660291299899[/C][/ROW]
[ROW][C]Trimmed Mean ( 4 / 24 )[/C][C]100.76671875[/C][C]0.168051546131293[/C][C]599.617921225636[/C][/ROW]
[ROW][C]Trimmed Mean ( 5 / 24 )[/C][C]100.789516129032[/C][C]0.163905989264363[/C][C]614.922716255776[/C][/ROW]
[ROW][C]Trimmed Mean ( 6 / 24 )[/C][C]100.8135[/C][C]0.159078352758583[/C][C]633.73487499581[/C][/ROW]
[ROW][C]Trimmed Mean ( 7 / 24 )[/C][C]100.838965517241[/C][C]0.153523388156794[/C][C]656.831292794646[/C][/ROW]
[ROW][C]Trimmed Mean ( 8 / 24 )[/C][C]100.863571428571[/C][C]0.147869156924537[/C][C]682.11365727909[/C][/ROW]
[ROW][C]Trimmed Mean ( 9 / 24 )[/C][C]100.884259259259[/C][C]0.142866139732374[/C][C]706.145343103987[/C][/ROW]
[ROW][C]Trimmed Mean ( 10 / 24 )[/C][C]100.892307692308[/C][C]0.141074473925689[/C][C]715.170539962125[/C][/ROW]
[ROW][C]Trimmed Mean ( 11 / 24 )[/C][C]100.8998[/C][C]0.139131266751062[/C][C]725.212975890842[/C][/ROW]
[ROW][C]Trimmed Mean ( 12 / 24 )[/C][C]100.908541666667[/C][C]0.13689502293176[/C][C]737.123523599308[/C][/ROW]
[ROW][C]Trimmed Mean ( 13 / 24 )[/C][C]100.918695652174[/C][C]0.134174379540894[/C][C]752.145797114835[/C][/ROW]
[ROW][C]Trimmed Mean ( 14 / 24 )[/C][C]100.931818181818[/C][C]0.131487373780797[/C][C]767.616047682892[/C][/ROW]
[ROW][C]Trimmed Mean ( 15 / 24 )[/C][C]100.945714285714[/C][C]0.128518830381911[/C][C]785.454660501816[/C][/ROW]
[ROW][C]Trimmed Mean ( 16 / 24 )[/C][C]100.95425[/C][C]0.127176380396555[/C][C]793.812889509904[/C][/ROW]
[ROW][C]Trimmed Mean ( 17 / 24 )[/C][C]100.963157894737[/C][C]0.125980707764151[/C][C]801.41761136753[/C][/ROW]
[ROW][C]Trimmed Mean ( 18 / 24 )[/C][C]100.969166666667[/C][C]0.125508726693368[/C][C]804.479252772167[/C][/ROW]
[ROW][C]Trimmed Mean ( 19 / 24 )[/C][C]100.975882352941[/C][C]0.124453971509274[/C][C]811.351225906171[/C][/ROW]
[ROW][C]Trimmed Mean ( 20 / 24 )[/C][C]100.9828125[/C][C]0.123310546188926[/C][C]818.930866993992[/C][/ROW]
[ROW][C]Trimmed Mean ( 21 / 24 )[/C][C]100.985[/C][C]0.123355154950547[/C][C]818.652451455997[/C][/ROW]
[ROW][C]Trimmed Mean ( 22 / 24 )[/C][C]100.988214285714[/C][C]0.124324687528058[/C][C]812.294133157765[/C][/ROW]
[ROW][C]Trimmed Mean ( 23 / 24 )[/C][C]100.991538461538[/C][C]0.125175190842143[/C][C]806.801553743168[/C][/ROW]
[ROW][C]Trimmed Mean ( 24 / 24 )[/C][C]100.995416666667[/C][C]0.125423888761195[/C][C]805.232700597891[/C][/ROW]
[ROW][C]Median[/C][C]101.03[/C][C][/C][C][/C][/ROW]
[ROW][C]Midrange[/C][C]100.525[/C][C][/C][C][/C][/ROW]
[ROW][C]Midmean - Weighted Average at Xnp[/C][C]100.963157894737[/C][C][/C][C][/C][/ROW]
[ROW][C]Midmean - Weighted Average at X(n+1)p[/C][C]100.963157894737[/C][C][/C][C][/C][/ROW]
[ROW][C]Midmean - Empirical Distribution Function[/C][C]100.963157894737[/C][C][/C][C][/C][/ROW]
[ROW][C]Midmean - Empirical Distribution Function - Averaging[/C][C]100.963157894737[/C][C][/C][C][/C][/ROW]
[ROW][C]Midmean - Empirical Distribution Function - Interpolation[/C][C]100.963157894737[/C][C][/C][C][/C][/ROW]
[ROW][C]Midmean - Closest Observation[/C][C]100.963157894737[/C][C][/C][C][/C][/ROW]
[ROW][C]Midmean - True Basic - Statistics Graphics Toolkit[/C][C]100.963157894737[/C][C][/C][C][/C][/ROW]
[ROW][C]Midmean - MS Excel (old versions)[/C][C]100.963157894737[/C][C][/C][C][/C][/ROW]
[ROW][C]Number of observations[/C][C]72[/C][C][/C][C][/C][/ROW]
[/TABLE]
Source: https://freestatistics.org/blog/index.php?pk=&T=1

Globally Unique Identifier (entire table): ba.freestatistics.org/blog/index.php?pk=&T=1

As an alternative you can also use a QR Code:  

The GUIDs for individual cells are displayed in the table below:

Central Tendency - Ungrouped Data
MeasureValueS.E.Value/S.E.
Arithmetic Mean100.7273611111110.18542848836667543.2140551776
Geometric Mean100.715176814136
Harmonic Mean100.702926571527
Quadratic Mean100.739478462186
Winsorized Mean ( 1 / 24 )100.7273611111110.185062903599178544.287154000748
Winsorized Mean ( 2 / 24 )100.7190277777780.18346614477939548.978820582336
Winsorized Mean ( 3 / 24 )100.7065277777780.181160854146817555.895633480304
Winsorized Mean ( 4 / 24 )100.6881944444440.17821266664734564.988989495867
Winsorized Mean ( 5 / 24 )100.6895833333330.177366674728884567.69166748626
Winsorized Mean ( 6 / 24 )100.6904166666670.175939845751783572.300244077293
Winsorized Mean ( 7 / 24 )100.7050.171536369713788587.076665829109
Winsorized Mean ( 8 / 24 )100.7394444444440.163997033362907614.276016941838
Winsorized Mean ( 9 / 24 )100.8319444444440.145959353851932690.822080143852
Winsorized Mean ( 10 / 24 )100.8402777777780.144065844718059699.959646751282
Winsorized Mean ( 11 / 24 )100.8356944444440.142438909617286707.922397857274
Winsorized Mean ( 12 / 24 )100.8306944444440.141208223479661714.056815954259
Winsorized Mean ( 13 / 24 )100.8144444444440.136752361900922737.204411266295
Winsorized Mean ( 14 / 24 )100.8183333333330.133732530340832753.88039900529
Winsorized Mean ( 15 / 24 )100.8745833333330.122093107173374826.210305141062
Winsorized Mean ( 16 / 24 )100.8790277777780.118213448450052853.363378705609
Winsorized Mean ( 17 / 24 )100.9120833333330.111925447727417901.600890434626
Winsorized Mean ( 18 / 24 )100.9120833333330.111925447727417901.600890434626
Winsorized Mean ( 19 / 24 )100.9173611111110.108967625422783926.122421403256
Winsorized Mean ( 20 / 24 )100.9645833333330.100825027303111001.38414076302
Winsorized Mean ( 21 / 24 )100.958750.09465217965508491066.62889716747
Winsorized Mean ( 22 / 24 )100.9618055555560.09344630285657211080.42589668335
Winsorized Mean ( 23 / 24 )100.9618055555560.09344630285657211080.42589668335
Winsorized Mean ( 24 / 24 )100.9584722222220.09302086774357511085.33143875338
Trimmed Mean ( 1 / 24 )100.7331428571430.181260201295802555.737785443338
Trimmed Mean ( 2 / 24 )100.7392647058820.176729919013866570.018168219602
Trimmed Mean ( 3 / 24 )100.7503030303030.172322807841629584.660291299899
Trimmed Mean ( 4 / 24 )100.766718750.168051546131293599.617921225636
Trimmed Mean ( 5 / 24 )100.7895161290320.163905989264363614.922716255776
Trimmed Mean ( 6 / 24 )100.81350.159078352758583633.73487499581
Trimmed Mean ( 7 / 24 )100.8389655172410.153523388156794656.831292794646
Trimmed Mean ( 8 / 24 )100.8635714285710.147869156924537682.11365727909
Trimmed Mean ( 9 / 24 )100.8842592592590.142866139732374706.145343103987
Trimmed Mean ( 10 / 24 )100.8923076923080.141074473925689715.170539962125
Trimmed Mean ( 11 / 24 )100.89980.139131266751062725.212975890842
Trimmed Mean ( 12 / 24 )100.9085416666670.13689502293176737.123523599308
Trimmed Mean ( 13 / 24 )100.9186956521740.134174379540894752.145797114835
Trimmed Mean ( 14 / 24 )100.9318181818180.131487373780797767.616047682892
Trimmed Mean ( 15 / 24 )100.9457142857140.128518830381911785.454660501816
Trimmed Mean ( 16 / 24 )100.954250.127176380396555793.812889509904
Trimmed Mean ( 17 / 24 )100.9631578947370.125980707764151801.41761136753
Trimmed Mean ( 18 / 24 )100.9691666666670.125508726693368804.479252772167
Trimmed Mean ( 19 / 24 )100.9758823529410.124453971509274811.351225906171
Trimmed Mean ( 20 / 24 )100.98281250.123310546188926818.930866993992
Trimmed Mean ( 21 / 24 )100.9850.123355154950547818.652451455997
Trimmed Mean ( 22 / 24 )100.9882142857140.124324687528058812.294133157765
Trimmed Mean ( 23 / 24 )100.9915384615380.125175190842143806.801553743168
Trimmed Mean ( 24 / 24 )100.9954166666670.125423888761195805.232700597891
Median101.03
Midrange100.525
Midmean - Weighted Average at Xnp100.963157894737
Midmean - Weighted Average at X(n+1)p100.963157894737
Midmean - Empirical Distribution Function100.963157894737
Midmean - Empirical Distribution Function - Averaging100.963157894737
Midmean - Empirical Distribution Function - Interpolation100.963157894737
Midmean - Closest Observation100.963157894737
Midmean - True Basic - Statistics Graphics Toolkit100.963157894737
Midmean - MS Excel (old versions)100.963157894737
Number of observations72


Parameters (Session):
Parameters (R input):
R code (references can be found in the software module):
geomean <- function(x) {
return(exp(mean(log(x))))
}
harmean <- function(x) {
return(1/mean(1/x))
}
quamean <- function(x) {
return(sqrt(mean(x*x)))
}
winmean <- function(x) {
x <-sort(x[!is.na(x)])
n<-length(x)
denom <- 3
nodenom <- n/denom
if (nodenom>40) denom <- n/40
sqrtn = sqrt(n)
roundnodenom = floor(nodenom)
win <- array(NA,dim=c(roundnodenom,2))
for (j in 1:roundnodenom) {
win[j,1] <- (j*x[j+1]+sum(x[(j+1):(n-j)])+j*x[n-j])/n
win[j,2] <- sd(c(rep(x[j+1],j),x[(j+1):(n-j)],rep(x[n-j],j)))/sqrtn
}
return(win)
}
trimean <- function(x) {
x <-sort(x[!is.na(x)])
n<-length(x)
denom <- 3
nodenom <- n/denom
if (nodenom>40) denom <- n/40
sqrtn = sqrt(n)
roundnodenom = floor(nodenom)
tri <- array(NA,dim=c(roundnodenom,2))
for (j in 1:roundnodenom) {
tri[j,1] <- mean(x,trim=j/n)
tri[j,2] <- sd(x[(j+1):(n-j)]) / sqrt(n-j*2)
}
return(tri)
}
midrange <- function(x) {
return((max(x)+min(x))/2)
}
q1 <- function(data,n,p,i,f) {
np <- n*p;
i <<- floor(np)
f <<- np - i
qvalue <- (1-f)*data[i] + f*data[i+1]
}
q2 <- function(data,n,p,i,f) {
np <- (n+1)*p
i <<- floor(np)
f <<- np - i
qvalue <- (1-f)*data[i] + f*data[i+1]
}
q3 <- function(data,n,p,i,f) {
np <- n*p
i <<- floor(np)
f <<- np - i
if (f==0) {
qvalue <- data[i]
} else {
qvalue <- data[i+1]
}
}
q4 <- function(data,n,p,i,f) {
np <- n*p
i <<- floor(np)
f <<- np - i
if (f==0) {
qvalue <- (data[i]+data[i+1])/2
} else {
qvalue <- data[i+1]
}
}
q5 <- function(data,n,p,i,f) {
np <- (n-1)*p
i <<- floor(np)
f <<- np - i
if (f==0) {
qvalue <- data[i+1]
} else {
qvalue <- data[i+1] + f*(data[i+2]-data[i+1])
}
}
q6 <- function(data,n,p,i,f) {
np <- n*p+0.5
i <<- floor(np)
f <<- np - i
qvalue <- data[i]
}
q7 <- function(data,n,p,i,f) {
np <- (n+1)*p
i <<- floor(np)
f <<- np - i
if (f==0) {
qvalue <- data[i]
} else {
qvalue <- f*data[i] + (1-f)*data[i+1]
}
}
q8 <- function(data,n,p,i,f) {
np <- (n+1)*p
i <<- floor(np)
f <<- np - i
if (f==0) {
qvalue <- data[i]
} else {
if (f == 0.5) {
qvalue <- (data[i]+data[i+1])/2
} else {
if (f < 0.5) {
qvalue <- data[i]
} else {
qvalue <- data[i+1]
}
}
}
}
midmean <- function(x,def) {
x <-sort(x[!is.na(x)])
n<-length(x)
if (def==1) {
qvalue1 <- q1(x,n,0.25,i,f)
qvalue3 <- q1(x,n,0.75,i,f)
}
if (def==2) {
qvalue1 <- q2(x,n,0.25,i,f)
qvalue3 <- q2(x,n,0.75,i,f)
}
if (def==3) {
qvalue1 <- q3(x,n,0.25,i,f)
qvalue3 <- q3(x,n,0.75,i,f)
}
if (def==4) {
qvalue1 <- q4(x,n,0.25,i,f)
qvalue3 <- q4(x,n,0.75,i,f)
}
if (def==5) {
qvalue1 <- q5(x,n,0.25,i,f)
qvalue3 <- q5(x,n,0.75,i,f)
}
if (def==6) {
qvalue1 <- q6(x,n,0.25,i,f)
qvalue3 <- q6(x,n,0.75,i,f)
}
if (def==7) {
qvalue1 <- q7(x,n,0.25,i,f)
qvalue3 <- q7(x,n,0.75,i,f)
}
if (def==8) {
qvalue1 <- q8(x,n,0.25,i,f)
qvalue3 <- q8(x,n,0.75,i,f)
}
midm <- 0
myn <- 0
roundno4 <- round(n/4)
round3no4 <- round(3*n/4)
for (i in 1:n) {
if ((x[i]>=qvalue1) & (x[i]<=qvalue3)){
midm = midm + x[i]
myn = myn + 1
}
}
midm = midm / myn
return(midm)
}
(arm <- mean(x))
sqrtn <- sqrt(length(x))
(armse <- sd(x) / sqrtn)
(armose <- arm / armse)
(geo <- geomean(x))
(har <- harmean(x))
(qua <- quamean(x))
(win <- winmean(x))
(tri <- trimean(x))
(midr <- midrange(x))
midm <- array(NA,dim=8)
for (j in 1:8) midm[j] <- midmean(x,j)
midm
bitmap(file='test1.png')
lb <- win[,1] - 2*win[,2]
ub <- win[,1] + 2*win[,2]
if ((ylimmin == '') | (ylimmax == '')) plot(win[,1],type='b',main=main, xlab='j', pch=19, ylab='Winsorized Mean(j/n)', ylim=c(min(lb),max(ub))) else plot(win[,1],type='l',main=main, xlab='j', pch=19, ylab='Winsorized Mean(j/n)', ylim=c(ylimmin,ylimmax))
lines(ub,lty=3)
lines(lb,lty=3)
grid()
dev.off()
bitmap(file='test2.png')
lb <- tri[,1] - 2*tri[,2]
ub <- tri[,1] + 2*tri[,2]
if ((ylimmin == '') | (ylimmax == '')) plot(tri[,1],type='b',main=main, xlab='j', pch=19, ylab='Trimmed Mean(j/n)', ylim=c(min(lb),max(ub))) else plot(tri[,1],type='l',main=main, xlab='j', pch=19, ylab='Trimmed Mean(j/n)', ylim=c(ylimmin,ylimmax))
lines(ub,lty=3)
lines(lb,lty=3)
grid()
dev.off()
load(file='createtable')
a<-table.start()
a<-table.row.start(a)
a<-table.element(a,'Central Tendency - Ungrouped Data',4,TRUE)
a<-table.row.end(a)
a<-table.row.start(a)
a<-table.element(a,'Measure',header=TRUE)
a<-table.element(a,'Value',header=TRUE)
a<-table.element(a,'S.E.',header=TRUE)
a<-table.element(a,'Value/S.E.',header=TRUE)
a<-table.row.end(a)
a<-table.row.start(a)
a<-table.element(a,hyperlink('arithmetic_mean.htm', 'Arithmetic Mean', 'click to view the definition of the Arithmetic Mean'),header=TRUE)
a<-table.element(a,arm)
a<-table.element(a,hyperlink('arithmetic_mean_standard_error.htm', armse, 'click to view the definition of the Standard Error of the Arithmetic Mean'))
a<-table.element(a,armose)
a<-table.row.end(a)
a<-table.row.start(a)
a<-table.element(a,hyperlink('geometric_mean.htm', 'Geometric Mean', 'click to view the definition of the Geometric Mean'),header=TRUE)
a<-table.element(a,geo)
a<-table.element(a,'')
a<-table.row.end(a)
a<-table.row.start(a)
a<-table.element(a,hyperlink('harmonic_mean.htm', 'Harmonic Mean', 'click to view the definition of the Harmonic Mean'),header=TRUE)
a<-table.element(a,har)
a<-table.element(a,'')
a<-table.row.end(a)
a<-table.row.start(a)
a<-table.element(a,hyperlink('quadratic_mean.htm', 'Quadratic Mean', 'click to view the definition of the Quadratic Mean'),header=TRUE)
a<-table.element(a,qua)
a<-table.element(a,'')
a<-table.row.end(a)
for (j in 1:length(win[,1])) {
a<-table.row.start(a)
mylabel <- paste('Winsorized Mean (',j)
mylabel <- paste(mylabel,'/')
mylabel <- paste(mylabel,length(win[,1]))
mylabel <- paste(mylabel,')')
a<-table.element(a,hyperlink('winsorized_mean.htm', mylabel, 'click to view the definition of the Winsorized Mean'),header=TRUE)
a<-table.element(a,win[j,1])
a<-table.element(a,win[j,2])
a<-table.element(a,win[j,1]/win[j,2])
a<-table.row.end(a)
}
for (j in 1:length(tri[,1])) {
a<-table.row.start(a)
mylabel <- paste('Trimmed Mean (',j)
mylabel <- paste(mylabel,'/')
mylabel <- paste(mylabel,length(tri[,1]))
mylabel <- paste(mylabel,')')
a<-table.element(a,hyperlink('arithmetic_mean.htm', mylabel, 'click to view the definition of the Trimmed Mean'),header=TRUE)
a<-table.element(a,tri[j,1])
a<-table.element(a,tri[j,2])
a<-table.element(a,tri[j,1]/tri[j,2])
a<-table.row.end(a)
}
a<-table.row.start(a)
a<-table.element(a,hyperlink('median_1.htm', 'Median', 'click to view the definition of the Median'),header=TRUE)
a<-table.element(a,median(x))
a<-table.element(a,'')
a<-table.row.end(a)
a<-table.row.start(a)
a<-table.element(a,hyperlink('midrange.htm', 'Midrange', 'click to view the definition of the Midrange'),header=TRUE)
a<-table.element(a,midr)
a<-table.element(a,'')
a<-table.row.end(a)
a<-table.row.start(a)
mymid <- hyperlink('midmean.htm', 'Midmean', 'click to view the definition of the Midmean')
mylabel <- paste(mymid,hyperlink('method_1.htm','Weighted Average at Xnp',''),sep=' - ')
a<-table.element(a,mylabel,header=TRUE)
a<-table.element(a,midm[1])
a<-table.element(a,'')
a<-table.row.end(a)
a<-table.row.start(a)
mymid <- hyperlink('midmean.htm', 'Midmean', 'click to view the definition of the Midmean')
mylabel <- paste(mymid,hyperlink('method_2.htm','Weighted Average at X(n+1)p',''),sep=' - ')
a<-table.element(a,mylabel,header=TRUE)
a<-table.element(a,midm[2])
a<-table.element(a,'')
a<-table.row.end(a)
a<-table.row.start(a)
mymid <- hyperlink('midmean.htm', 'Midmean', 'click to view the definition of the Midmean')
mylabel <- paste(mymid,hyperlink('method_3.htm','Empirical Distribution Function',''),sep=' - ')
a<-table.element(a,mylabel,header=TRUE)
a<-table.element(a,midm[3])
a<-table.element(a,'')
a<-table.row.end(a)
a<-table.row.start(a)
mymid <- hyperlink('midmean.htm', 'Midmean', 'click to view the definition of the Midmean')
mylabel <- paste(mymid,hyperlink('method_4.htm','Empirical Distribution Function - Averaging',''),sep=' - ')
a<-table.element(a,mylabel,header=TRUE)
a<-table.element(a,midm[4])
a<-table.element(a,'')
a<-table.row.end(a)
a<-table.row.start(a)
mymid <- hyperlink('midmean.htm', 'Midmean', 'click to view the definition of the Midmean')
mylabel <- paste(mymid,hyperlink('method_5.htm','Empirical Distribution Function - Interpolation',''),sep=' - ')
a<-table.element(a,mylabel,header=TRUE)
a<-table.element(a,midm[5])
a<-table.element(a,'')
a<-table.row.end(a)
a<-table.row.start(a)
mymid <- hyperlink('midmean.htm', 'Midmean', 'click to view the definition of the Midmean')
mylabel <- paste(mymid,hyperlink('method_6.htm','Closest Observation',''),sep=' - ')
a<-table.element(a,mylabel,header=TRUE)
a<-table.element(a,midm[6])
a<-table.element(a,'')
a<-table.row.end(a)
a<-table.row.start(a)
mymid <- hyperlink('midmean.htm', 'Midmean', 'click to view the definition of the Midmean')
mylabel <- paste(mymid,hyperlink('method_7.htm','True Basic - Statistics Graphics Toolkit',''),sep=' - ')
a<-table.element(a,mylabel,header=TRUE)
a<-table.element(a,midm[7])
a<-table.element(a,'')
a<-table.row.end(a)
a<-table.row.start(a)
mymid <- hyperlink('midmean.htm', 'Midmean', 'click to view the definition of the Midmean')
mylabel <- paste(mymid,hyperlink('method_8.htm','MS Excel (old versions)',''),sep=' - ')
a<-table.element(a,mylabel,header=TRUE)
a<-table.element(a,midm[8])
a<-table.element(a,'')
a<-table.row.end(a)
a<-table.row.start(a)
a<-table.element(a,'Number of observations',header=TRUE)
a<-table.element(a,length(x))
a<-table.element(a,'')
a<-table.row.end(a)
a<-table.end(a)
table.save(a,file='mytable.tab')