Free Statistics

of Irreproducible Research!

Author's title

Author*Unverified author*
R Software Modulerwasp_autocorrelation.wasp
Title produced by software(Partial) Autocorrelation Function
Date of computationMon, 17 Oct 2016 16:19:20 +0100
Cite this page as followsStatistical Computations at FreeStatistics.org, Office for Research Development and Education, URL https://freestatistics.org/blog/index.php?v=date/2016/Oct/17/t1476717587ftv9ldjs9nhpefb.htm/, Retrieved Sun, 05 May 2024 02:44:18 +0200
Statistical Computations at FreeStatistics.org, Office for Research Development and Education, URL https://freestatistics.org/blog/index.php?pk=, Retrieved Sun, 05 May 2024 02:44:18 +0200
QR Codes:

Original text written by user:
IsPrivate?No (this computation is public)
User-defined keywords
Estimated Impact0
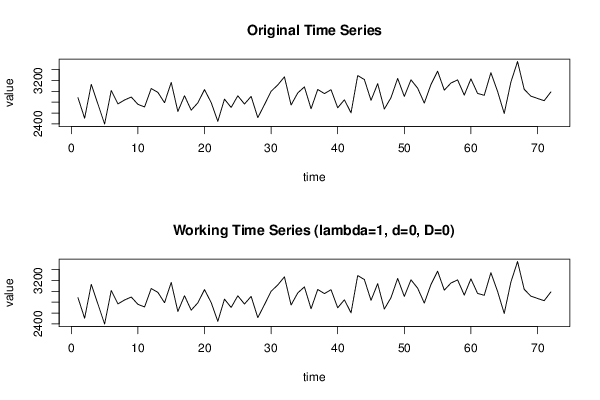
Dataseries X:
2884
2505
3128
2765
2398
3015
2769
2840
2895
2761
2712
3051
2980
2790
3164
2629
2919
2653
2788
3031
2794
2448
2856
2703
2918
2766
2907
2516
2754
3000
3117
3265
2748
2970
3081
2679
3034
2958
3029
2697
2844
2604
3289
3217
2834
3141
2674
2883
3237
2905
3211
3058
2784
3125
3370
3021
3152
3210
2930
3229
2961
2927
3342
2999
2593
3168
3547
3037
2911
2869
2827
2988


Summary of computational transaction
Raw Inputview raw input (R code)
Raw Outputview raw output of R engine
Computing time1 seconds
R Server'Herman Ole Andreas Wold' @ wold.wessa.net

\begin{tabular}{lllllllll}
\hline
Summary of computational transaction \tabularnewline
Raw Input & view raw input (R code)  \tabularnewline
Raw Output & view raw output of R engine  \tabularnewline
Computing time & 1 seconds \tabularnewline
R Server & 'Herman Ole Andreas Wold' @ wold.wessa.net \tabularnewline
\hline
\end{tabular}
%Source: https://freestatistics.org/blog/index.php?pk=&T=0

[TABLE]
[ROW][C]Summary of computational transaction[/C][/ROW]
[ROW][C]Raw Input[/C][C]view raw input (R code) [/C][/ROW]
[ROW][C]Raw Output[/C][C]view raw output of R engine [/C][/ROW]
[ROW][C]Computing time[/C][C]1 seconds[/C][/ROW]
[ROW][C]R Server[/C][C]'Herman Ole Andreas Wold' @ wold.wessa.net[/C][/ROW]
[/TABLE]
Source: https://freestatistics.org/blog/index.php?pk=&T=0

Globally Unique Identifier (entire table): ba.freestatistics.org/blog/index.php?pk=&T=0

As an alternative you can also use a QR Code:  

The GUIDs for individual cells are displayed in the table below:

Summary of computational transaction
Raw Inputview raw input (R code)
Raw Outputview raw output of R engine
Computing time1 seconds
R Server'Herman Ole Andreas Wold' @ wold.wessa.net


Autocorrelation Function
Time lag kACF(k)T-STATP-value
10.0716290.60780.27262
20.0123940.10520.458266
30.267692.27140.013056
40.0296290.25140.401107
50.2340511.9860.025421
60.3251022.75860.003677
70.0407420.34570.365286
80.1034920.87820.19139
90.1507731.27940.102441
10-0.152097-1.29060.100489
110.1885691.60010.056982
120.3634273.08380.001449
13-0.070488-0.59810.275821
140.195411.65810.050823
15-0.058188-0.49370.311495
16-0.065228-0.55350.290826
170.2533182.14950.017479
180.0858260.72830.234409
190.0660710.56060.288395
200.1399481.18750.119467
21-0.111888-0.94940.172795
22-0.07701-0.65340.257775
230.1748731.48380.071107
240.1207481.02460.154495
25-0.067819-0.57550.283385
260.0152640.12950.448653
27-0.273733-2.32270.011513
28-0.003901-0.03310.486844
290.0443890.37670.35377
30-0.216559-1.83760.035126
310.0738270.62640.266503
32-0.046076-0.3910.348489
33-0.209772-1.780.03965
34-0.065219-0.55340.290851
35-0.043078-0.36550.357895
36-0.037612-0.31910.375269
370.0343870.29180.385646
38-0.156631-1.32910.094012
39-0.230986-1.960.026934
400.0207620.17620.430328
41-0.17914-1.52010.066439
42-0.078259-0.66410.254389
430.0735090.62370.267384
44-0.211986-1.79880.038124
45-0.10974-0.93120.177438
46-0.052927-0.44910.327353
47-0.109168-0.92630.178686
48-0.001898-0.01610.493596

\begin{tabular}{lllllllll}
\hline
Autocorrelation Function \tabularnewline
Time lag k & ACF(k) & T-STAT & P-value \tabularnewline
1 & 0.071629 & 0.6078 & 0.27262 \tabularnewline
2 & 0.012394 & 0.1052 & 0.458266 \tabularnewline
3 & 0.26769 & 2.2714 & 0.013056 \tabularnewline
4 & 0.029629 & 0.2514 & 0.401107 \tabularnewline
5 & 0.234051 & 1.986 & 0.025421 \tabularnewline
6 & 0.325102 & 2.7586 & 0.003677 \tabularnewline
7 & 0.040742 & 0.3457 & 0.365286 \tabularnewline
8 & 0.103492 & 0.8782 & 0.19139 \tabularnewline
9 & 0.150773 & 1.2794 & 0.102441 \tabularnewline
10 & -0.152097 & -1.2906 & 0.100489 \tabularnewline
11 & 0.188569 & 1.6001 & 0.056982 \tabularnewline
12 & 0.363427 & 3.0838 & 0.001449 \tabularnewline
13 & -0.070488 & -0.5981 & 0.275821 \tabularnewline
14 & 0.19541 & 1.6581 & 0.050823 \tabularnewline
15 & -0.058188 & -0.4937 & 0.311495 \tabularnewline
16 & -0.065228 & -0.5535 & 0.290826 \tabularnewline
17 & 0.253318 & 2.1495 & 0.017479 \tabularnewline
18 & 0.085826 & 0.7283 & 0.234409 \tabularnewline
19 & 0.066071 & 0.5606 & 0.288395 \tabularnewline
20 & 0.139948 & 1.1875 & 0.119467 \tabularnewline
21 & -0.111888 & -0.9494 & 0.172795 \tabularnewline
22 & -0.07701 & -0.6534 & 0.257775 \tabularnewline
23 & 0.174873 & 1.4838 & 0.071107 \tabularnewline
24 & 0.120748 & 1.0246 & 0.154495 \tabularnewline
25 & -0.067819 & -0.5755 & 0.283385 \tabularnewline
26 & 0.015264 & 0.1295 & 0.448653 \tabularnewline
27 & -0.273733 & -2.3227 & 0.011513 \tabularnewline
28 & -0.003901 & -0.0331 & 0.486844 \tabularnewline
29 & 0.044389 & 0.3767 & 0.35377 \tabularnewline
30 & -0.216559 & -1.8376 & 0.035126 \tabularnewline
31 & 0.073827 & 0.6264 & 0.266503 \tabularnewline
32 & -0.046076 & -0.391 & 0.348489 \tabularnewline
33 & -0.209772 & -1.78 & 0.03965 \tabularnewline
34 & -0.065219 & -0.5534 & 0.290851 \tabularnewline
35 & -0.043078 & -0.3655 & 0.357895 \tabularnewline
36 & -0.037612 & -0.3191 & 0.375269 \tabularnewline
37 & 0.034387 & 0.2918 & 0.385646 \tabularnewline
38 & -0.156631 & -1.3291 & 0.094012 \tabularnewline
39 & -0.230986 & -1.96 & 0.026934 \tabularnewline
40 & 0.020762 & 0.1762 & 0.430328 \tabularnewline
41 & -0.17914 & -1.5201 & 0.066439 \tabularnewline
42 & -0.078259 & -0.6641 & 0.254389 \tabularnewline
43 & 0.073509 & 0.6237 & 0.267384 \tabularnewline
44 & -0.211986 & -1.7988 & 0.038124 \tabularnewline
45 & -0.10974 & -0.9312 & 0.177438 \tabularnewline
46 & -0.052927 & -0.4491 & 0.327353 \tabularnewline
47 & -0.109168 & -0.9263 & 0.178686 \tabularnewline
48 & -0.001898 & -0.0161 & 0.493596 \tabularnewline
\hline
\end{tabular}
%Source: https://freestatistics.org/blog/index.php?pk=&T=1

[TABLE]
[ROW][C]Autocorrelation Function[/C][/ROW]
[ROW][C]Time lag k[/C][C]ACF(k)[/C][C]T-STAT[/C][C]P-value[/C][/ROW]
[ROW][C]1[/C][C]0.071629[/C][C]0.6078[/C][C]0.27262[/C][/ROW]
[ROW][C]2[/C][C]0.012394[/C][C]0.1052[/C][C]0.458266[/C][/ROW]
[ROW][C]3[/C][C]0.26769[/C][C]2.2714[/C][C]0.013056[/C][/ROW]
[ROW][C]4[/C][C]0.029629[/C][C]0.2514[/C][C]0.401107[/C][/ROW]
[ROW][C]5[/C][C]0.234051[/C][C]1.986[/C][C]0.025421[/C][/ROW]
[ROW][C]6[/C][C]0.325102[/C][C]2.7586[/C][C]0.003677[/C][/ROW]
[ROW][C]7[/C][C]0.040742[/C][C]0.3457[/C][C]0.365286[/C][/ROW]
[ROW][C]8[/C][C]0.103492[/C][C]0.8782[/C][C]0.19139[/C][/ROW]
[ROW][C]9[/C][C]0.150773[/C][C]1.2794[/C][C]0.102441[/C][/ROW]
[ROW][C]10[/C][C]-0.152097[/C][C]-1.2906[/C][C]0.100489[/C][/ROW]
[ROW][C]11[/C][C]0.188569[/C][C]1.6001[/C][C]0.056982[/C][/ROW]
[ROW][C]12[/C][C]0.363427[/C][C]3.0838[/C][C]0.001449[/C][/ROW]
[ROW][C]13[/C][C]-0.070488[/C][C]-0.5981[/C][C]0.275821[/C][/ROW]
[ROW][C]14[/C][C]0.19541[/C][C]1.6581[/C][C]0.050823[/C][/ROW]
[ROW][C]15[/C][C]-0.058188[/C][C]-0.4937[/C][C]0.311495[/C][/ROW]
[ROW][C]16[/C][C]-0.065228[/C][C]-0.5535[/C][C]0.290826[/C][/ROW]
[ROW][C]17[/C][C]0.253318[/C][C]2.1495[/C][C]0.017479[/C][/ROW]
[ROW][C]18[/C][C]0.085826[/C][C]0.7283[/C][C]0.234409[/C][/ROW]
[ROW][C]19[/C][C]0.066071[/C][C]0.5606[/C][C]0.288395[/C][/ROW]
[ROW][C]20[/C][C]0.139948[/C][C]1.1875[/C][C]0.119467[/C][/ROW]
[ROW][C]21[/C][C]-0.111888[/C][C]-0.9494[/C][C]0.172795[/C][/ROW]
[ROW][C]22[/C][C]-0.07701[/C][C]-0.6534[/C][C]0.257775[/C][/ROW]
[ROW][C]23[/C][C]0.174873[/C][C]1.4838[/C][C]0.071107[/C][/ROW]
[ROW][C]24[/C][C]0.120748[/C][C]1.0246[/C][C]0.154495[/C][/ROW]
[ROW][C]25[/C][C]-0.067819[/C][C]-0.5755[/C][C]0.283385[/C][/ROW]
[ROW][C]26[/C][C]0.015264[/C][C]0.1295[/C][C]0.448653[/C][/ROW]
[ROW][C]27[/C][C]-0.273733[/C][C]-2.3227[/C][C]0.011513[/C][/ROW]
[ROW][C]28[/C][C]-0.003901[/C][C]-0.0331[/C][C]0.486844[/C][/ROW]
[ROW][C]29[/C][C]0.044389[/C][C]0.3767[/C][C]0.35377[/C][/ROW]
[ROW][C]30[/C][C]-0.216559[/C][C]-1.8376[/C][C]0.035126[/C][/ROW]
[ROW][C]31[/C][C]0.073827[/C][C]0.6264[/C][C]0.266503[/C][/ROW]
[ROW][C]32[/C][C]-0.046076[/C][C]-0.391[/C][C]0.348489[/C][/ROW]
[ROW][C]33[/C][C]-0.209772[/C][C]-1.78[/C][C]0.03965[/C][/ROW]
[ROW][C]34[/C][C]-0.065219[/C][C]-0.5534[/C][C]0.290851[/C][/ROW]
[ROW][C]35[/C][C]-0.043078[/C][C]-0.3655[/C][C]0.357895[/C][/ROW]
[ROW][C]36[/C][C]-0.037612[/C][C]-0.3191[/C][C]0.375269[/C][/ROW]
[ROW][C]37[/C][C]0.034387[/C][C]0.2918[/C][C]0.385646[/C][/ROW]
[ROW][C]38[/C][C]-0.156631[/C][C]-1.3291[/C][C]0.094012[/C][/ROW]
[ROW][C]39[/C][C]-0.230986[/C][C]-1.96[/C][C]0.026934[/C][/ROW]
[ROW][C]40[/C][C]0.020762[/C][C]0.1762[/C][C]0.430328[/C][/ROW]
[ROW][C]41[/C][C]-0.17914[/C][C]-1.5201[/C][C]0.066439[/C][/ROW]
[ROW][C]42[/C][C]-0.078259[/C][C]-0.6641[/C][C]0.254389[/C][/ROW]
[ROW][C]43[/C][C]0.073509[/C][C]0.6237[/C][C]0.267384[/C][/ROW]
[ROW][C]44[/C][C]-0.211986[/C][C]-1.7988[/C][C]0.038124[/C][/ROW]
[ROW][C]45[/C][C]-0.10974[/C][C]-0.9312[/C][C]0.177438[/C][/ROW]
[ROW][C]46[/C][C]-0.052927[/C][C]-0.4491[/C][C]0.327353[/C][/ROW]
[ROW][C]47[/C][C]-0.109168[/C][C]-0.9263[/C][C]0.178686[/C][/ROW]
[ROW][C]48[/C][C]-0.001898[/C][C]-0.0161[/C][C]0.493596[/C][/ROW]
[/TABLE]
Source: https://freestatistics.org/blog/index.php?pk=&T=1

Globally Unique Identifier (entire table): ba.freestatistics.org/blog/index.php?pk=&T=1

As an alternative you can also use a QR Code:  

The GUIDs for individual cells are displayed in the table below:

Autocorrelation Function
Time lag kACF(k)T-STATP-value
10.0716290.60780.27262
20.0123940.10520.458266
30.267692.27140.013056
40.0296290.25140.401107
50.2340511.9860.025421
60.3251022.75860.003677
70.0407420.34570.365286
80.1034920.87820.19139
90.1507731.27940.102441
10-0.152097-1.29060.100489
110.1885691.60010.056982
120.3634273.08380.001449
13-0.070488-0.59810.275821
140.195411.65810.050823
15-0.058188-0.49370.311495
16-0.065228-0.55350.290826
170.2533182.14950.017479
180.0858260.72830.234409
190.0660710.56060.288395
200.1399481.18750.119467
21-0.111888-0.94940.172795
22-0.07701-0.65340.257775
230.1748731.48380.071107
240.1207481.02460.154495
25-0.067819-0.57550.283385
260.0152640.12950.448653
27-0.273733-2.32270.011513
28-0.003901-0.03310.486844
290.0443890.37670.35377
30-0.216559-1.83760.035126
310.0738270.62640.266503
32-0.046076-0.3910.348489
33-0.209772-1.780.03965
34-0.065219-0.55340.290851
35-0.043078-0.36550.357895
36-0.037612-0.31910.375269
370.0343870.29180.385646
38-0.156631-1.32910.094012
39-0.230986-1.960.026934
400.0207620.17620.430328
41-0.17914-1.52010.066439
42-0.078259-0.66410.254389
430.0735090.62370.267384
44-0.211986-1.79880.038124
45-0.10974-0.93120.177438
46-0.052927-0.44910.327353
47-0.109168-0.92630.178686
48-0.001898-0.01610.493596


Partial Autocorrelation Function
Time lag kPACF(k)T-STATP-value
10.0716290.60780.27262
20.0073010.0620.475386
30.2676732.27130.01306
4-0.008565-0.07270.471133
50.2516482.13530.018069
60.2542472.15740.017158
70.0361140.30640.380078
80.0173590.14730.441656
90.019810.16810.433491
10-0.270836-2.29810.012231
110.057310.48630.314118
120.2660122.25720.013515
13-0.044206-0.37510.354344
140.174021.47660.072071
15-0.203707-1.72850.044092
16-0.006089-0.05170.47947
170.002110.01790.492883
18-0.001063-0.0090.496413
190.1013990.86040.196213
200.02410.20450.419273
21-0.098083-0.83230.204007
22-0.035251-0.29910.382856
23-0.053217-0.45160.326471
240.1339571.13670.129724
25-0.186477-1.58230.058981
26-0.10577-0.89750.186225
27-0.198855-1.68730.047933
28-8.9e-05-8e-040.499698
29-0.03415-0.28980.38641
30-0.18863-1.60060.056925
310.0803130.68150.248878
320.0241440.20490.419125
330.0615820.52250.301449
340.0171210.14530.442449
35-0.044192-0.3750.354388
36-0.025457-0.2160.414797
370.0131780.11180.455639
38-0.136562-1.15880.12519
390.0865760.73460.232477
40-0.10736-0.9110.182674
41-0.057821-0.49060.31259
420.0178310.15130.440081
430.0342990.2910.38593
440.0691060.58640.279725
450.0020270.01720.493162
460.0508270.43130.333777
470.1098610.93220.177175
48-0.09925-0.84220.201242

\begin{tabular}{lllllllll}
\hline
Partial Autocorrelation Function \tabularnewline
Time lag k & PACF(k) & T-STAT & P-value \tabularnewline
1 & 0.071629 & 0.6078 & 0.27262 \tabularnewline
2 & 0.007301 & 0.062 & 0.475386 \tabularnewline
3 & 0.267673 & 2.2713 & 0.01306 \tabularnewline
4 & -0.008565 & -0.0727 & 0.471133 \tabularnewline
5 & 0.251648 & 2.1353 & 0.018069 \tabularnewline
6 & 0.254247 & 2.1574 & 0.017158 \tabularnewline
7 & 0.036114 & 0.3064 & 0.380078 \tabularnewline
8 & 0.017359 & 0.1473 & 0.441656 \tabularnewline
9 & 0.01981 & 0.1681 & 0.433491 \tabularnewline
10 & -0.270836 & -2.2981 & 0.012231 \tabularnewline
11 & 0.05731 & 0.4863 & 0.314118 \tabularnewline
12 & 0.266012 & 2.2572 & 0.013515 \tabularnewline
13 & -0.044206 & -0.3751 & 0.354344 \tabularnewline
14 & 0.17402 & 1.4766 & 0.072071 \tabularnewline
15 & -0.203707 & -1.7285 & 0.044092 \tabularnewline
16 & -0.006089 & -0.0517 & 0.47947 \tabularnewline
17 & 0.00211 & 0.0179 & 0.492883 \tabularnewline
18 & -0.001063 & -0.009 & 0.496413 \tabularnewline
19 & 0.101399 & 0.8604 & 0.196213 \tabularnewline
20 & 0.0241 & 0.2045 & 0.419273 \tabularnewline
21 & -0.098083 & -0.8323 & 0.204007 \tabularnewline
22 & -0.035251 & -0.2991 & 0.382856 \tabularnewline
23 & -0.053217 & -0.4516 & 0.326471 \tabularnewline
24 & 0.133957 & 1.1367 & 0.129724 \tabularnewline
25 & -0.186477 & -1.5823 & 0.058981 \tabularnewline
26 & -0.10577 & -0.8975 & 0.186225 \tabularnewline
27 & -0.198855 & -1.6873 & 0.047933 \tabularnewline
28 & -8.9e-05 & -8e-04 & 0.499698 \tabularnewline
29 & -0.03415 & -0.2898 & 0.38641 \tabularnewline
30 & -0.18863 & -1.6006 & 0.056925 \tabularnewline
31 & 0.080313 & 0.6815 & 0.248878 \tabularnewline
32 & 0.024144 & 0.2049 & 0.419125 \tabularnewline
33 & 0.061582 & 0.5225 & 0.301449 \tabularnewline
34 & 0.017121 & 0.1453 & 0.442449 \tabularnewline
35 & -0.044192 & -0.375 & 0.354388 \tabularnewline
36 & -0.025457 & -0.216 & 0.414797 \tabularnewline
37 & 0.013178 & 0.1118 & 0.455639 \tabularnewline
38 & -0.136562 & -1.1588 & 0.12519 \tabularnewline
39 & 0.086576 & 0.7346 & 0.232477 \tabularnewline
40 & -0.10736 & -0.911 & 0.182674 \tabularnewline
41 & -0.057821 & -0.4906 & 0.31259 \tabularnewline
42 & 0.017831 & 0.1513 & 0.440081 \tabularnewline
43 & 0.034299 & 0.291 & 0.38593 \tabularnewline
44 & 0.069106 & 0.5864 & 0.279725 \tabularnewline
45 & 0.002027 & 0.0172 & 0.493162 \tabularnewline
46 & 0.050827 & 0.4313 & 0.333777 \tabularnewline
47 & 0.109861 & 0.9322 & 0.177175 \tabularnewline
48 & -0.09925 & -0.8422 & 0.201242 \tabularnewline
\hline
\end{tabular}
%Source: https://freestatistics.org/blog/index.php?pk=&T=2

[TABLE]
[ROW][C]Partial Autocorrelation Function[/C][/ROW]
[ROW][C]Time lag k[/C][C]PACF(k)[/C][C]T-STAT[/C][C]P-value[/C][/ROW]
[ROW][C]1[/C][C]0.071629[/C][C]0.6078[/C][C]0.27262[/C][/ROW]
[ROW][C]2[/C][C]0.007301[/C][C]0.062[/C][C]0.475386[/C][/ROW]
[ROW][C]3[/C][C]0.267673[/C][C]2.2713[/C][C]0.01306[/C][/ROW]
[ROW][C]4[/C][C]-0.008565[/C][C]-0.0727[/C][C]0.471133[/C][/ROW]
[ROW][C]5[/C][C]0.251648[/C][C]2.1353[/C][C]0.018069[/C][/ROW]
[ROW][C]6[/C][C]0.254247[/C][C]2.1574[/C][C]0.017158[/C][/ROW]
[ROW][C]7[/C][C]0.036114[/C][C]0.3064[/C][C]0.380078[/C][/ROW]
[ROW][C]8[/C][C]0.017359[/C][C]0.1473[/C][C]0.441656[/C][/ROW]
[ROW][C]9[/C][C]0.01981[/C][C]0.1681[/C][C]0.433491[/C][/ROW]
[ROW][C]10[/C][C]-0.270836[/C][C]-2.2981[/C][C]0.012231[/C][/ROW]
[ROW][C]11[/C][C]0.05731[/C][C]0.4863[/C][C]0.314118[/C][/ROW]
[ROW][C]12[/C][C]0.266012[/C][C]2.2572[/C][C]0.013515[/C][/ROW]
[ROW][C]13[/C][C]-0.044206[/C][C]-0.3751[/C][C]0.354344[/C][/ROW]
[ROW][C]14[/C][C]0.17402[/C][C]1.4766[/C][C]0.072071[/C][/ROW]
[ROW][C]15[/C][C]-0.203707[/C][C]-1.7285[/C][C]0.044092[/C][/ROW]
[ROW][C]16[/C][C]-0.006089[/C][C]-0.0517[/C][C]0.47947[/C][/ROW]
[ROW][C]17[/C][C]0.00211[/C][C]0.0179[/C][C]0.492883[/C][/ROW]
[ROW][C]18[/C][C]-0.001063[/C][C]-0.009[/C][C]0.496413[/C][/ROW]
[ROW][C]19[/C][C]0.101399[/C][C]0.8604[/C][C]0.196213[/C][/ROW]
[ROW][C]20[/C][C]0.0241[/C][C]0.2045[/C][C]0.419273[/C][/ROW]
[ROW][C]21[/C][C]-0.098083[/C][C]-0.8323[/C][C]0.204007[/C][/ROW]
[ROW][C]22[/C][C]-0.035251[/C][C]-0.2991[/C][C]0.382856[/C][/ROW]
[ROW][C]23[/C][C]-0.053217[/C][C]-0.4516[/C][C]0.326471[/C][/ROW]
[ROW][C]24[/C][C]0.133957[/C][C]1.1367[/C][C]0.129724[/C][/ROW]
[ROW][C]25[/C][C]-0.186477[/C][C]-1.5823[/C][C]0.058981[/C][/ROW]
[ROW][C]26[/C][C]-0.10577[/C][C]-0.8975[/C][C]0.186225[/C][/ROW]
[ROW][C]27[/C][C]-0.198855[/C][C]-1.6873[/C][C]0.047933[/C][/ROW]
[ROW][C]28[/C][C]-8.9e-05[/C][C]-8e-04[/C][C]0.499698[/C][/ROW]
[ROW][C]29[/C][C]-0.03415[/C][C]-0.2898[/C][C]0.38641[/C][/ROW]
[ROW][C]30[/C][C]-0.18863[/C][C]-1.6006[/C][C]0.056925[/C][/ROW]
[ROW][C]31[/C][C]0.080313[/C][C]0.6815[/C][C]0.248878[/C][/ROW]
[ROW][C]32[/C][C]0.024144[/C][C]0.2049[/C][C]0.419125[/C][/ROW]
[ROW][C]33[/C][C]0.061582[/C][C]0.5225[/C][C]0.301449[/C][/ROW]
[ROW][C]34[/C][C]0.017121[/C][C]0.1453[/C][C]0.442449[/C][/ROW]
[ROW][C]35[/C][C]-0.044192[/C][C]-0.375[/C][C]0.354388[/C][/ROW]
[ROW][C]36[/C][C]-0.025457[/C][C]-0.216[/C][C]0.414797[/C][/ROW]
[ROW][C]37[/C][C]0.013178[/C][C]0.1118[/C][C]0.455639[/C][/ROW]
[ROW][C]38[/C][C]-0.136562[/C][C]-1.1588[/C][C]0.12519[/C][/ROW]
[ROW][C]39[/C][C]0.086576[/C][C]0.7346[/C][C]0.232477[/C][/ROW]
[ROW][C]40[/C][C]-0.10736[/C][C]-0.911[/C][C]0.182674[/C][/ROW]
[ROW][C]41[/C][C]-0.057821[/C][C]-0.4906[/C][C]0.31259[/C][/ROW]
[ROW][C]42[/C][C]0.017831[/C][C]0.1513[/C][C]0.440081[/C][/ROW]
[ROW][C]43[/C][C]0.034299[/C][C]0.291[/C][C]0.38593[/C][/ROW]
[ROW][C]44[/C][C]0.069106[/C][C]0.5864[/C][C]0.279725[/C][/ROW]
[ROW][C]45[/C][C]0.002027[/C][C]0.0172[/C][C]0.493162[/C][/ROW]
[ROW][C]46[/C][C]0.050827[/C][C]0.4313[/C][C]0.333777[/C][/ROW]
[ROW][C]47[/C][C]0.109861[/C][C]0.9322[/C][C]0.177175[/C][/ROW]
[ROW][C]48[/C][C]-0.09925[/C][C]-0.8422[/C][C]0.201242[/C][/ROW]
[/TABLE]
Source: https://freestatistics.org/blog/index.php?pk=&T=2

Globally Unique Identifier (entire table): ba.freestatistics.org/blog/index.php?pk=&T=2

As an alternative you can also use a QR Code:  

The GUIDs for individual cells are displayed in the table below:

Partial Autocorrelation Function
Time lag kPACF(k)T-STATP-value
10.0716290.60780.27262
20.0073010.0620.475386
30.2676732.27130.01306
4-0.008565-0.07270.471133
50.2516482.13530.018069
60.2542472.15740.017158
70.0361140.30640.380078
80.0173590.14730.441656
90.019810.16810.433491
10-0.270836-2.29810.012231
110.057310.48630.314118
120.2660122.25720.013515
13-0.044206-0.37510.354344
140.174021.47660.072071
15-0.203707-1.72850.044092
16-0.006089-0.05170.47947
170.002110.01790.492883
18-0.001063-0.0090.496413
190.1013990.86040.196213
200.02410.20450.419273
21-0.098083-0.83230.204007
22-0.035251-0.29910.382856
23-0.053217-0.45160.326471
240.1339571.13670.129724
25-0.186477-1.58230.058981
26-0.10577-0.89750.186225
27-0.198855-1.68730.047933
28-8.9e-05-8e-040.499698
29-0.03415-0.28980.38641
30-0.18863-1.60060.056925
310.0803130.68150.248878
320.0241440.20490.419125
330.0615820.52250.301449
340.0171210.14530.442449
35-0.044192-0.3750.354388
36-0.025457-0.2160.414797
370.0131780.11180.455639
38-0.136562-1.15880.12519
390.0865760.73460.232477
40-0.10736-0.9110.182674
41-0.057821-0.49060.31259
420.0178310.15130.440081
430.0342990.2910.38593
440.0691060.58640.279725
450.0020270.01720.493162
460.0508270.43130.333777
470.1098610.93220.177175
48-0.09925-0.84220.201242


Parameters (Session):
par1 = 48 ; par2 = 1 ; par3 = 0 ; par4 = 0 ; par5 = 12 ; par6 = White Noise ; par7 = 0.95 ;
Parameters (R input):
par1 = 48 ; par2 = 1 ; par3 = 0 ; par4 = 0 ; par5 = 12 ; par6 = White Noise ; par7 = 0.95 ; par8 = ;
R code (references can be found in the software module):
if (par1 == 'Default') {
par1 = 10*log10(length(x))
} else {
par1 <- as.numeric(par1)
}
par2 <- as.numeric(par2)
par3 <- as.numeric(par3)
par4 <- as.numeric(par4)
par5 <- as.numeric(par5)
if (par6 == 'White Noise') par6 <- 'white' else par6 <- 'ma'
par7 <- as.numeric(par7)
if (par8 != '') par8 <- as.numeric(par8)
x <- na.omit(x)
ox <- x
if (par8 == '') {
if (par2 == 0) {
x <- log(x)
} else {
x <- (x ^ par2 - 1) / par2
}
} else {
x <- log(x,base=par8)
}
if (par3 > 0) x <- diff(x,lag=1,difference=par3)
if (par4 > 0) x <- diff(x,lag=par5,difference=par4)
bitmap(file='picts.png')
op <- par(mfrow=c(2,1))
plot(ox,type='l',main='Original Time Series',xlab='time',ylab='value')
if (par8=='') {
mytitle <- paste('Working Time Series (lambda=',par2,', d=',par3,', D=',par4,')',sep='')
mysub <- paste('(lambda=',par2,', d=',par3,', D=',par4,', CI=', par7, ', CI type=',par6,')',sep='')
} else {
mytitle <- paste('Working Time Series (base=',par8,', d=',par3,', D=',par4,')',sep='')
mysub <- paste('(base=',par8,', d=',par3,', D=',par4,', CI=', par7, ', CI type=',par6,')',sep='')
}
plot(x,type='l', main=mytitle,xlab='time',ylab='value')
par(op)
dev.off()
bitmap(file='pic1.png')
racf <- acf(x, par1, main='Autocorrelation', xlab='time lag', ylab='ACF', ci.type=par6, ci=par7, sub=mysub)
dev.off()
bitmap(file='pic2.png')
rpacf <- pacf(x,par1,main='Partial Autocorrelation',xlab='lags',ylab='PACF',sub=mysub)
dev.off()
(myacf <- c(racf$acf))
(mypacf <- c(rpacf$acf))
lengthx <- length(x)
sqrtn <- sqrt(lengthx)
load(file='createtable')
a<-table.start()
a<-table.row.start(a)
a<-table.element(a,'Autocorrelation Function',4,TRUE)
a<-table.row.end(a)
a<-table.row.start(a)
a<-table.element(a,'Time lag k',header=TRUE)
a<-table.element(a,hyperlink('basics.htm','ACF(k)','click here for more information about the Autocorrelation Function'),header=TRUE)
a<-table.element(a,'T-STAT',header=TRUE)
a<-table.element(a,'P-value',header=TRUE)
a<-table.row.end(a)
for (i in 2:(par1+1)) {
a<-table.row.start(a)
a<-table.element(a,i-1,header=TRUE)
a<-table.element(a,round(myacf[i],6))
mytstat <- myacf[i]*sqrtn
a<-table.element(a,round(mytstat,4))
a<-table.element(a,round(1-pt(abs(mytstat),lengthx),6))
a<-table.row.end(a)
}
a<-table.end(a)
table.save(a,file='mytable.tab')
a<-table.start()
a<-table.row.start(a)
a<-table.element(a,'Partial Autocorrelation Function',4,TRUE)
a<-table.row.end(a)
a<-table.row.start(a)
a<-table.element(a,'Time lag k',header=TRUE)
a<-table.element(a,hyperlink('basics.htm','PACF(k)','click here for more information about the Partial Autocorrelation Function'),header=TRUE)
a<-table.element(a,'T-STAT',header=TRUE)
a<-table.element(a,'P-value',header=TRUE)
a<-table.row.end(a)
for (i in 1:par1) {
a<-table.row.start(a)
a<-table.element(a,i,header=TRUE)
a<-table.element(a,round(mypacf[i],6))
mytstat <- mypacf[i]*sqrtn
a<-table.element(a,round(mytstat,4))
a<-table.element(a,round(1-pt(abs(mytstat),lengthx),6))
a<-table.row.end(a)
}
a<-table.end(a)
table.save(a,file='mytable1.tab')