Free Statistics

of Irreproducible Research!

Author's title

Author*Unverified author*
R Software Modulerwasp_autocorrelation.wasp
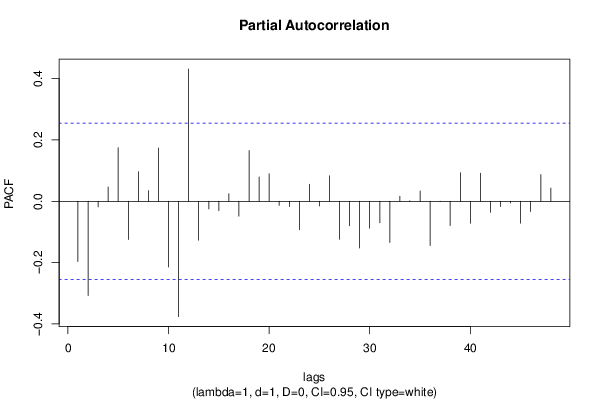
Title produced by software(Partial) Autocorrelation Function
Date of computationMon, 17 Oct 2016 16:46:29 +0100
Cite this page as followsStatistical Computations at FreeStatistics.org, Office for Research Development and Education, URL https://freestatistics.org/blog/index.php?v=date/2016/Oct/17/t1476719238uhb8ptlh20gg3ur.htm/, Retrieved Sat, 04 May 2024 22:09:24 +0200
Statistical Computations at FreeStatistics.org, Office for Research Development and Education, URL https://freestatistics.org/blog/index.php?pk=, Retrieved Sat, 04 May 2024 22:09:24 +0200
QR Codes:

Original text written by user:
IsPrivate?No (this computation is public)
User-defined keywords
Estimated Impact0
Dataseries X:
70
65
62
58
55
67
64
60
71
71
73
69
81
84
84
80
76
87
83
78
87
85
81
78
87
89
88
84
82
91
93
90
100
98
95
89
99
100
99
94
86
90
86
82
86
84
82
80
86
80
79
78
73
80
79
74
82
81
76
69


Summary of computational transaction
Raw Inputview raw input (R code)
Raw Outputview raw output of R engine
Computing time1 seconds
R Server'Sir Ronald Aylmer Fisher' @ fisher.wessa.net

\begin{tabular}{lllllllll}
\hline
Summary of computational transaction \tabularnewline
Raw Input & view raw input (R code)  \tabularnewline
Raw Output & view raw output of R engine  \tabularnewline
Computing time & 1 seconds \tabularnewline
R Server & 'Sir Ronald Aylmer Fisher' @ fisher.wessa.net \tabularnewline
\hline
\end{tabular}
%Source: https://freestatistics.org/blog/index.php?pk=&T=0

[TABLE]
[ROW][C]Summary of computational transaction[/C][/ROW]
[ROW][C]Raw Input[/C][C]view raw input (R code) [/C][/ROW]
[ROW][C]Raw Output[/C][C]view raw output of R engine [/C][/ROW]
[ROW][C]Computing time[/C][C]1 seconds[/C][/ROW]
[ROW][C]R Server[/C][C]'Sir Ronald Aylmer Fisher' @ fisher.wessa.net[/C][/ROW]
[/TABLE]
Source: https://freestatistics.org/blog/index.php?pk=&T=0

Globally Unique Identifier (entire table): ba.freestatistics.org/blog/index.php?pk=&T=0

As an alternative you can also use a QR Code:  

The GUIDs for individual cells are displayed in the table below:

Summary of computational transaction
Raw Inputview raw input (R code)
Raw Outputview raw output of R engine
Computing time1 seconds
R Server'Sir Ronald Aylmer Fisher' @ fisher.wessa.net


Autocorrelation Function
Time lag kACF(k)T-STATP-value
1-0.197047-1.51350.06774
2-0.256799-1.97250.026622
30.1107740.85090.199141
40.095340.73230.233435
50.0861560.66180.255346
6-0.210105-1.61380.055949
70.1072480.82380.206689
80.1003520.77080.221945
90.0547770.42080.337733
10-0.24609-1.89030.031819
11-0.261948-2.01210.024393
120.6205074.76626e-06
13-0.189197-1.45330.075726
14-0.243879-1.87330.032993
150.0974920.74890.228461
160.0803980.61750.269625
170.0199310.15310.439424
18-0.127572-0.97990.165569
190.1265710.97220.167457
200.1111770.8540.19829
210.0405880.31180.37816
22-0.169053-1.29850.099581
23-0.214048-1.64410.052734
240.4775133.66780.000263
25-0.114477-0.87930.191399
26-0.160593-1.23350.111133
270.0411760.31630.376453
280.0165970.12750.449495
29-0.0752-0.57760.282859
30-0.165838-1.27380.10386
310.0757020.58150.281567
32-0.00016-0.00120.499513
330.0466220.35810.360769
34-0.111746-0.85830.197091
35-0.197748-1.51890.067061
360.2647512.03360.023249
37-0.083951-0.64480.260765
38-0.082763-0.63570.26371
390.0791290.60780.272826
400.0266970.20510.419114
41-0.024006-0.18440.427168
42-0.071223-0.54710.293196
430.0643230.49410.311544
440.014180.10890.456818
450.0165170.12690.449738
46-0.044433-0.34130.367046
47-0.115669-0.88850.188949
480.1508271.15850.12566

\begin{tabular}{lllllllll}
\hline
Autocorrelation Function \tabularnewline
Time lag k & ACF(k) & T-STAT & P-value \tabularnewline
1 & -0.197047 & -1.5135 & 0.06774 \tabularnewline
2 & -0.256799 & -1.9725 & 0.026622 \tabularnewline
3 & 0.110774 & 0.8509 & 0.199141 \tabularnewline
4 & 0.09534 & 0.7323 & 0.233435 \tabularnewline
5 & 0.086156 & 0.6618 & 0.255346 \tabularnewline
6 & -0.210105 & -1.6138 & 0.055949 \tabularnewline
7 & 0.107248 & 0.8238 & 0.206689 \tabularnewline
8 & 0.100352 & 0.7708 & 0.221945 \tabularnewline
9 & 0.054777 & 0.4208 & 0.337733 \tabularnewline
10 & -0.24609 & -1.8903 & 0.031819 \tabularnewline
11 & -0.261948 & -2.0121 & 0.024393 \tabularnewline
12 & 0.620507 & 4.7662 & 6e-06 \tabularnewline
13 & -0.189197 & -1.4533 & 0.075726 \tabularnewline
14 & -0.243879 & -1.8733 & 0.032993 \tabularnewline
15 & 0.097492 & 0.7489 & 0.228461 \tabularnewline
16 & 0.080398 & 0.6175 & 0.269625 \tabularnewline
17 & 0.019931 & 0.1531 & 0.439424 \tabularnewline
18 & -0.127572 & -0.9799 & 0.165569 \tabularnewline
19 & 0.126571 & 0.9722 & 0.167457 \tabularnewline
20 & 0.111177 & 0.854 & 0.19829 \tabularnewline
21 & 0.040588 & 0.3118 & 0.37816 \tabularnewline
22 & -0.169053 & -1.2985 & 0.099581 \tabularnewline
23 & -0.214048 & -1.6441 & 0.052734 \tabularnewline
24 & 0.477513 & 3.6678 & 0.000263 \tabularnewline
25 & -0.114477 & -0.8793 & 0.191399 \tabularnewline
26 & -0.160593 & -1.2335 & 0.111133 \tabularnewline
27 & 0.041176 & 0.3163 & 0.376453 \tabularnewline
28 & 0.016597 & 0.1275 & 0.449495 \tabularnewline
29 & -0.0752 & -0.5776 & 0.282859 \tabularnewline
30 & -0.165838 & -1.2738 & 0.10386 \tabularnewline
31 & 0.075702 & 0.5815 & 0.281567 \tabularnewline
32 & -0.00016 & -0.0012 & 0.499513 \tabularnewline
33 & 0.046622 & 0.3581 & 0.360769 \tabularnewline
34 & -0.111746 & -0.8583 & 0.197091 \tabularnewline
35 & -0.197748 & -1.5189 & 0.067061 \tabularnewline
36 & 0.264751 & 2.0336 & 0.023249 \tabularnewline
37 & -0.083951 & -0.6448 & 0.260765 \tabularnewline
38 & -0.082763 & -0.6357 & 0.26371 \tabularnewline
39 & 0.079129 & 0.6078 & 0.272826 \tabularnewline
40 & 0.026697 & 0.2051 & 0.419114 \tabularnewline
41 & -0.024006 & -0.1844 & 0.427168 \tabularnewline
42 & -0.071223 & -0.5471 & 0.293196 \tabularnewline
43 & 0.064323 & 0.4941 & 0.311544 \tabularnewline
44 & 0.01418 & 0.1089 & 0.456818 \tabularnewline
45 & 0.016517 & 0.1269 & 0.449738 \tabularnewline
46 & -0.044433 & -0.3413 & 0.367046 \tabularnewline
47 & -0.115669 & -0.8885 & 0.188949 \tabularnewline
48 & 0.150827 & 1.1585 & 0.12566 \tabularnewline
\hline
\end{tabular}
%Source: https://freestatistics.org/blog/index.php?pk=&T=1

[TABLE]
[ROW][C]Autocorrelation Function[/C][/ROW]
[ROW][C]Time lag k[/C][C]ACF(k)[/C][C]T-STAT[/C][C]P-value[/C][/ROW]
[ROW][C]1[/C][C]-0.197047[/C][C]-1.5135[/C][C]0.06774[/C][/ROW]
[ROW][C]2[/C][C]-0.256799[/C][C]-1.9725[/C][C]0.026622[/C][/ROW]
[ROW][C]3[/C][C]0.110774[/C][C]0.8509[/C][C]0.199141[/C][/ROW]
[ROW][C]4[/C][C]0.09534[/C][C]0.7323[/C][C]0.233435[/C][/ROW]
[ROW][C]5[/C][C]0.086156[/C][C]0.6618[/C][C]0.255346[/C][/ROW]
[ROW][C]6[/C][C]-0.210105[/C][C]-1.6138[/C][C]0.055949[/C][/ROW]
[ROW][C]7[/C][C]0.107248[/C][C]0.8238[/C][C]0.206689[/C][/ROW]
[ROW][C]8[/C][C]0.100352[/C][C]0.7708[/C][C]0.221945[/C][/ROW]
[ROW][C]9[/C][C]0.054777[/C][C]0.4208[/C][C]0.337733[/C][/ROW]
[ROW][C]10[/C][C]-0.24609[/C][C]-1.8903[/C][C]0.031819[/C][/ROW]
[ROW][C]11[/C][C]-0.261948[/C][C]-2.0121[/C][C]0.024393[/C][/ROW]
[ROW][C]12[/C][C]0.620507[/C][C]4.7662[/C][C]6e-06[/C][/ROW]
[ROW][C]13[/C][C]-0.189197[/C][C]-1.4533[/C][C]0.075726[/C][/ROW]
[ROW][C]14[/C][C]-0.243879[/C][C]-1.8733[/C][C]0.032993[/C][/ROW]
[ROW][C]15[/C][C]0.097492[/C][C]0.7489[/C][C]0.228461[/C][/ROW]
[ROW][C]16[/C][C]0.080398[/C][C]0.6175[/C][C]0.269625[/C][/ROW]
[ROW][C]17[/C][C]0.019931[/C][C]0.1531[/C][C]0.439424[/C][/ROW]
[ROW][C]18[/C][C]-0.127572[/C][C]-0.9799[/C][C]0.165569[/C][/ROW]
[ROW][C]19[/C][C]0.126571[/C][C]0.9722[/C][C]0.167457[/C][/ROW]
[ROW][C]20[/C][C]0.111177[/C][C]0.854[/C][C]0.19829[/C][/ROW]
[ROW][C]21[/C][C]0.040588[/C][C]0.3118[/C][C]0.37816[/C][/ROW]
[ROW][C]22[/C][C]-0.169053[/C][C]-1.2985[/C][C]0.099581[/C][/ROW]
[ROW][C]23[/C][C]-0.214048[/C][C]-1.6441[/C][C]0.052734[/C][/ROW]
[ROW][C]24[/C][C]0.477513[/C][C]3.6678[/C][C]0.000263[/C][/ROW]
[ROW][C]25[/C][C]-0.114477[/C][C]-0.8793[/C][C]0.191399[/C][/ROW]
[ROW][C]26[/C][C]-0.160593[/C][C]-1.2335[/C][C]0.111133[/C][/ROW]
[ROW][C]27[/C][C]0.041176[/C][C]0.3163[/C][C]0.376453[/C][/ROW]
[ROW][C]28[/C][C]0.016597[/C][C]0.1275[/C][C]0.449495[/C][/ROW]
[ROW][C]29[/C][C]-0.0752[/C][C]-0.5776[/C][C]0.282859[/C][/ROW]
[ROW][C]30[/C][C]-0.165838[/C][C]-1.2738[/C][C]0.10386[/C][/ROW]
[ROW][C]31[/C][C]0.075702[/C][C]0.5815[/C][C]0.281567[/C][/ROW]
[ROW][C]32[/C][C]-0.00016[/C][C]-0.0012[/C][C]0.499513[/C][/ROW]
[ROW][C]33[/C][C]0.046622[/C][C]0.3581[/C][C]0.360769[/C][/ROW]
[ROW][C]34[/C][C]-0.111746[/C][C]-0.8583[/C][C]0.197091[/C][/ROW]
[ROW][C]35[/C][C]-0.197748[/C][C]-1.5189[/C][C]0.067061[/C][/ROW]
[ROW][C]36[/C][C]0.264751[/C][C]2.0336[/C][C]0.023249[/C][/ROW]
[ROW][C]37[/C][C]-0.083951[/C][C]-0.6448[/C][C]0.260765[/C][/ROW]
[ROW][C]38[/C][C]-0.082763[/C][C]-0.6357[/C][C]0.26371[/C][/ROW]
[ROW][C]39[/C][C]0.079129[/C][C]0.6078[/C][C]0.272826[/C][/ROW]
[ROW][C]40[/C][C]0.026697[/C][C]0.2051[/C][C]0.419114[/C][/ROW]
[ROW][C]41[/C][C]-0.024006[/C][C]-0.1844[/C][C]0.427168[/C][/ROW]
[ROW][C]42[/C][C]-0.071223[/C][C]-0.5471[/C][C]0.293196[/C][/ROW]
[ROW][C]43[/C][C]0.064323[/C][C]0.4941[/C][C]0.311544[/C][/ROW]
[ROW][C]44[/C][C]0.01418[/C][C]0.1089[/C][C]0.456818[/C][/ROW]
[ROW][C]45[/C][C]0.016517[/C][C]0.1269[/C][C]0.449738[/C][/ROW]
[ROW][C]46[/C][C]-0.044433[/C][C]-0.3413[/C][C]0.367046[/C][/ROW]
[ROW][C]47[/C][C]-0.115669[/C][C]-0.8885[/C][C]0.188949[/C][/ROW]
[ROW][C]48[/C][C]0.150827[/C][C]1.1585[/C][C]0.12566[/C][/ROW]
[/TABLE]
Source: https://freestatistics.org/blog/index.php?pk=&T=1

Globally Unique Identifier (entire table): ba.freestatistics.org/blog/index.php?pk=&T=1

As an alternative you can also use a QR Code:  

The GUIDs for individual cells are displayed in the table below:

Autocorrelation Function
Time lag kACF(k)T-STATP-value
1-0.197047-1.51350.06774
2-0.256799-1.97250.026622
30.1107740.85090.199141
40.095340.73230.233435
50.0861560.66180.255346
6-0.210105-1.61380.055949
70.1072480.82380.206689
80.1003520.77080.221945
90.0547770.42080.337733
10-0.24609-1.89030.031819
11-0.261948-2.01210.024393
120.6205074.76626e-06
13-0.189197-1.45330.075726
14-0.243879-1.87330.032993
150.0974920.74890.228461
160.0803980.61750.269625
170.0199310.15310.439424
18-0.127572-0.97990.165569
190.1265710.97220.167457
200.1111770.8540.19829
210.0405880.31180.37816
22-0.169053-1.29850.099581
23-0.214048-1.64410.052734
240.4775133.66780.000263
25-0.114477-0.87930.191399
26-0.160593-1.23350.111133
270.0411760.31630.376453
280.0165970.12750.449495
29-0.0752-0.57760.282859
30-0.165838-1.27380.10386
310.0757020.58150.281567
32-0.00016-0.00120.499513
330.0466220.35810.360769
34-0.111746-0.85830.197091
35-0.197748-1.51890.067061
360.2647512.03360.023249
37-0.083951-0.64480.260765
38-0.082763-0.63570.26371
390.0791290.60780.272826
400.0266970.20510.419114
41-0.024006-0.18440.427168
42-0.071223-0.54710.293196
430.0643230.49410.311544
440.014180.10890.456818
450.0165170.12690.449738
46-0.044433-0.34130.367046
47-0.115669-0.88850.188949
480.1508271.15850.12566


Partial Autocorrelation Function
Time lag kPACF(k)T-STATP-value
1-0.197047-1.51350.06774
2-0.307569-2.36250.010735
3-0.018382-0.14120.444099
40.0467680.35920.360352
50.1748891.34330.092152
6-0.125187-0.96160.170093
70.0965860.74190.230547
80.0347940.26730.395103
90.1741611.33780.093054
10-0.214796-1.64990.052141
11-0.376825-2.89440.002658
120.4319813.31810.000778
13-0.127089-0.97620.166478
14-0.024953-0.19170.424331
15-0.031057-0.23860.406139
160.0242560.18630.426418
17-0.048695-0.3740.354859
180.165331.26990.104548
190.0789260.60620.27334
200.0898620.69020.246375
21-0.013582-0.10430.458631
22-0.016926-0.130.4485
23-0.09314-0.71540.238585
240.055710.42790.335134
25-0.015338-0.11780.453307
260.0828240.63620.263559
27-0.124044-0.95280.172289
28-0.079894-0.61370.270893
29-0.152924-1.17460.122431
30-0.087818-0.67450.251301
31-0.070267-0.53970.295708
32-0.134736-1.03490.152463
330.0163490.12560.450246
340.0015070.01160.495402
350.0334580.2570.399038
36-0.144654-1.11110.135514
37-0.001393-0.01070.495751
38-0.079208-0.60840.272625
390.0928190.7130.239342
40-0.07192-0.55240.29137
410.091530.70310.242394
42-0.036027-0.27670.391478
43-0.017145-0.13170.447838
44-0.00559-0.04290.482947
45-0.071399-0.54840.292734
46-0.033738-0.25910.398213
470.0870280.66850.253219
480.0428930.32950.371484

\begin{tabular}{lllllllll}
\hline
Partial Autocorrelation Function \tabularnewline
Time lag k & PACF(k) & T-STAT & P-value \tabularnewline
1 & -0.197047 & -1.5135 & 0.06774 \tabularnewline
2 & -0.307569 & -2.3625 & 0.010735 \tabularnewline
3 & -0.018382 & -0.1412 & 0.444099 \tabularnewline
4 & 0.046768 & 0.3592 & 0.360352 \tabularnewline
5 & 0.174889 & 1.3433 & 0.092152 \tabularnewline
6 & -0.125187 & -0.9616 & 0.170093 \tabularnewline
7 & 0.096586 & 0.7419 & 0.230547 \tabularnewline
8 & 0.034794 & 0.2673 & 0.395103 \tabularnewline
9 & 0.174161 & 1.3378 & 0.093054 \tabularnewline
10 & -0.214796 & -1.6499 & 0.052141 \tabularnewline
11 & -0.376825 & -2.8944 & 0.002658 \tabularnewline
12 & 0.431981 & 3.3181 & 0.000778 \tabularnewline
13 & -0.127089 & -0.9762 & 0.166478 \tabularnewline
14 & -0.024953 & -0.1917 & 0.424331 \tabularnewline
15 & -0.031057 & -0.2386 & 0.406139 \tabularnewline
16 & 0.024256 & 0.1863 & 0.426418 \tabularnewline
17 & -0.048695 & -0.374 & 0.354859 \tabularnewline
18 & 0.16533 & 1.2699 & 0.104548 \tabularnewline
19 & 0.078926 & 0.6062 & 0.27334 \tabularnewline
20 & 0.089862 & 0.6902 & 0.246375 \tabularnewline
21 & -0.013582 & -0.1043 & 0.458631 \tabularnewline
22 & -0.016926 & -0.13 & 0.4485 \tabularnewline
23 & -0.09314 & -0.7154 & 0.238585 \tabularnewline
24 & 0.05571 & 0.4279 & 0.335134 \tabularnewline
25 & -0.015338 & -0.1178 & 0.453307 \tabularnewline
26 & 0.082824 & 0.6362 & 0.263559 \tabularnewline
27 & -0.124044 & -0.9528 & 0.172289 \tabularnewline
28 & -0.079894 & -0.6137 & 0.270893 \tabularnewline
29 & -0.152924 & -1.1746 & 0.122431 \tabularnewline
30 & -0.087818 & -0.6745 & 0.251301 \tabularnewline
31 & -0.070267 & -0.5397 & 0.295708 \tabularnewline
32 & -0.134736 & -1.0349 & 0.152463 \tabularnewline
33 & 0.016349 & 0.1256 & 0.450246 \tabularnewline
34 & 0.001507 & 0.0116 & 0.495402 \tabularnewline
35 & 0.033458 & 0.257 & 0.399038 \tabularnewline
36 & -0.144654 & -1.1111 & 0.135514 \tabularnewline
37 & -0.001393 & -0.0107 & 0.495751 \tabularnewline
38 & -0.079208 & -0.6084 & 0.272625 \tabularnewline
39 & 0.092819 & 0.713 & 0.239342 \tabularnewline
40 & -0.07192 & -0.5524 & 0.29137 \tabularnewline
41 & 0.09153 & 0.7031 & 0.242394 \tabularnewline
42 & -0.036027 & -0.2767 & 0.391478 \tabularnewline
43 & -0.017145 & -0.1317 & 0.447838 \tabularnewline
44 & -0.00559 & -0.0429 & 0.482947 \tabularnewline
45 & -0.071399 & -0.5484 & 0.292734 \tabularnewline
46 & -0.033738 & -0.2591 & 0.398213 \tabularnewline
47 & 0.087028 & 0.6685 & 0.253219 \tabularnewline
48 & 0.042893 & 0.3295 & 0.371484 \tabularnewline
\hline
\end{tabular}
%Source: https://freestatistics.org/blog/index.php?pk=&T=2

[TABLE]
[ROW][C]Partial Autocorrelation Function[/C][/ROW]
[ROW][C]Time lag k[/C][C]PACF(k)[/C][C]T-STAT[/C][C]P-value[/C][/ROW]
[ROW][C]1[/C][C]-0.197047[/C][C]-1.5135[/C][C]0.06774[/C][/ROW]
[ROW][C]2[/C][C]-0.307569[/C][C]-2.3625[/C][C]0.010735[/C][/ROW]
[ROW][C]3[/C][C]-0.018382[/C][C]-0.1412[/C][C]0.444099[/C][/ROW]
[ROW][C]4[/C][C]0.046768[/C][C]0.3592[/C][C]0.360352[/C][/ROW]
[ROW][C]5[/C][C]0.174889[/C][C]1.3433[/C][C]0.092152[/C][/ROW]
[ROW][C]6[/C][C]-0.125187[/C][C]-0.9616[/C][C]0.170093[/C][/ROW]
[ROW][C]7[/C][C]0.096586[/C][C]0.7419[/C][C]0.230547[/C][/ROW]
[ROW][C]8[/C][C]0.034794[/C][C]0.2673[/C][C]0.395103[/C][/ROW]
[ROW][C]9[/C][C]0.174161[/C][C]1.3378[/C][C]0.093054[/C][/ROW]
[ROW][C]10[/C][C]-0.214796[/C][C]-1.6499[/C][C]0.052141[/C][/ROW]
[ROW][C]11[/C][C]-0.376825[/C][C]-2.8944[/C][C]0.002658[/C][/ROW]
[ROW][C]12[/C][C]0.431981[/C][C]3.3181[/C][C]0.000778[/C][/ROW]
[ROW][C]13[/C][C]-0.127089[/C][C]-0.9762[/C][C]0.166478[/C][/ROW]
[ROW][C]14[/C][C]-0.024953[/C][C]-0.1917[/C][C]0.424331[/C][/ROW]
[ROW][C]15[/C][C]-0.031057[/C][C]-0.2386[/C][C]0.406139[/C][/ROW]
[ROW][C]16[/C][C]0.024256[/C][C]0.1863[/C][C]0.426418[/C][/ROW]
[ROW][C]17[/C][C]-0.048695[/C][C]-0.374[/C][C]0.354859[/C][/ROW]
[ROW][C]18[/C][C]0.16533[/C][C]1.2699[/C][C]0.104548[/C][/ROW]
[ROW][C]19[/C][C]0.078926[/C][C]0.6062[/C][C]0.27334[/C][/ROW]
[ROW][C]20[/C][C]0.089862[/C][C]0.6902[/C][C]0.246375[/C][/ROW]
[ROW][C]21[/C][C]-0.013582[/C][C]-0.1043[/C][C]0.458631[/C][/ROW]
[ROW][C]22[/C][C]-0.016926[/C][C]-0.13[/C][C]0.4485[/C][/ROW]
[ROW][C]23[/C][C]-0.09314[/C][C]-0.7154[/C][C]0.238585[/C][/ROW]
[ROW][C]24[/C][C]0.05571[/C][C]0.4279[/C][C]0.335134[/C][/ROW]
[ROW][C]25[/C][C]-0.015338[/C][C]-0.1178[/C][C]0.453307[/C][/ROW]
[ROW][C]26[/C][C]0.082824[/C][C]0.6362[/C][C]0.263559[/C][/ROW]
[ROW][C]27[/C][C]-0.124044[/C][C]-0.9528[/C][C]0.172289[/C][/ROW]
[ROW][C]28[/C][C]-0.079894[/C][C]-0.6137[/C][C]0.270893[/C][/ROW]
[ROW][C]29[/C][C]-0.152924[/C][C]-1.1746[/C][C]0.122431[/C][/ROW]
[ROW][C]30[/C][C]-0.087818[/C][C]-0.6745[/C][C]0.251301[/C][/ROW]
[ROW][C]31[/C][C]-0.070267[/C][C]-0.5397[/C][C]0.295708[/C][/ROW]
[ROW][C]32[/C][C]-0.134736[/C][C]-1.0349[/C][C]0.152463[/C][/ROW]
[ROW][C]33[/C][C]0.016349[/C][C]0.1256[/C][C]0.450246[/C][/ROW]
[ROW][C]34[/C][C]0.001507[/C][C]0.0116[/C][C]0.495402[/C][/ROW]
[ROW][C]35[/C][C]0.033458[/C][C]0.257[/C][C]0.399038[/C][/ROW]
[ROW][C]36[/C][C]-0.144654[/C][C]-1.1111[/C][C]0.135514[/C][/ROW]
[ROW][C]37[/C][C]-0.001393[/C][C]-0.0107[/C][C]0.495751[/C][/ROW]
[ROW][C]38[/C][C]-0.079208[/C][C]-0.6084[/C][C]0.272625[/C][/ROW]
[ROW][C]39[/C][C]0.092819[/C][C]0.713[/C][C]0.239342[/C][/ROW]
[ROW][C]40[/C][C]-0.07192[/C][C]-0.5524[/C][C]0.29137[/C][/ROW]
[ROW][C]41[/C][C]0.09153[/C][C]0.7031[/C][C]0.242394[/C][/ROW]
[ROW][C]42[/C][C]-0.036027[/C][C]-0.2767[/C][C]0.391478[/C][/ROW]
[ROW][C]43[/C][C]-0.017145[/C][C]-0.1317[/C][C]0.447838[/C][/ROW]
[ROW][C]44[/C][C]-0.00559[/C][C]-0.0429[/C][C]0.482947[/C][/ROW]
[ROW][C]45[/C][C]-0.071399[/C][C]-0.5484[/C][C]0.292734[/C][/ROW]
[ROW][C]46[/C][C]-0.033738[/C][C]-0.2591[/C][C]0.398213[/C][/ROW]
[ROW][C]47[/C][C]0.087028[/C][C]0.6685[/C][C]0.253219[/C][/ROW]
[ROW][C]48[/C][C]0.042893[/C][C]0.3295[/C][C]0.371484[/C][/ROW]
[/TABLE]
Source: https://freestatistics.org/blog/index.php?pk=&T=2

Globally Unique Identifier (entire table): ba.freestatistics.org/blog/index.php?pk=&T=2

As an alternative you can also use a QR Code:  

The GUIDs for individual cells are displayed in the table below:

Partial Autocorrelation Function
Time lag kPACF(k)T-STATP-value
1-0.197047-1.51350.06774
2-0.307569-2.36250.010735
3-0.018382-0.14120.444099
40.0467680.35920.360352
50.1748891.34330.092152
6-0.125187-0.96160.170093
70.0965860.74190.230547
80.0347940.26730.395103
90.1741611.33780.093054
10-0.214796-1.64990.052141
11-0.376825-2.89440.002658
120.4319813.31810.000778
13-0.127089-0.97620.166478
14-0.024953-0.19170.424331
15-0.031057-0.23860.406139
160.0242560.18630.426418
17-0.048695-0.3740.354859
180.165331.26990.104548
190.0789260.60620.27334
200.0898620.69020.246375
21-0.013582-0.10430.458631
22-0.016926-0.130.4485
23-0.09314-0.71540.238585
240.055710.42790.335134
25-0.015338-0.11780.453307
260.0828240.63620.263559
27-0.124044-0.95280.172289
28-0.079894-0.61370.270893
29-0.152924-1.17460.122431
30-0.087818-0.67450.251301
31-0.070267-0.53970.295708
32-0.134736-1.03490.152463
330.0163490.12560.450246
340.0015070.01160.495402
350.0334580.2570.399038
36-0.144654-1.11110.135514
37-0.001393-0.01070.495751
38-0.079208-0.60840.272625
390.0928190.7130.239342
40-0.07192-0.55240.29137
410.091530.70310.242394
42-0.036027-0.27670.391478
43-0.017145-0.13170.447838
44-0.00559-0.04290.482947
45-0.071399-0.54840.292734
46-0.033738-0.25910.398213
470.0870280.66850.253219
480.0428930.32950.371484


Parameters (Session):
par1 = 48 ; par2 = 1 ; par3 = 1 ; par4 = 0 ; par5 = 12 ; par6 = White Noise ; par7 = 0.95 ;
Parameters (R input):
par1 = 48 ; par2 = 1 ; par3 = 1 ; par4 = 0 ; par5 = 12 ; par6 = White Noise ; par7 = 0.95 ; par8 = ;
R code (references can be found in the software module):
if (par1 == 'Default') {
par1 = 10*log10(length(x))
} else {
par1 <- as.numeric(par1)
}
par2 <- as.numeric(par2)
par3 <- as.numeric(par3)
par4 <- as.numeric(par4)
par5 <- as.numeric(par5)
if (par6 == 'White Noise') par6 <- 'white' else par6 <- 'ma'
par7 <- as.numeric(par7)
if (par8 != '') par8 <- as.numeric(par8)
x <- na.omit(x)
ox <- x
if (par8 == '') {
if (par2 == 0) {
x <- log(x)
} else {
x <- (x ^ par2 - 1) / par2
}
} else {
x <- log(x,base=par8)
}
if (par3 > 0) x <- diff(x,lag=1,difference=par3)
if (par4 > 0) x <- diff(x,lag=par5,difference=par4)
bitmap(file='picts.png')
op <- par(mfrow=c(2,1))
plot(ox,type='l',main='Original Time Series',xlab='time',ylab='value')
if (par8=='') {
mytitle <- paste('Working Time Series (lambda=',par2,', d=',par3,', D=',par4,')',sep='')
mysub <- paste('(lambda=',par2,', d=',par3,', D=',par4,', CI=', par7, ', CI type=',par6,')',sep='')
} else {
mytitle <- paste('Working Time Series (base=',par8,', d=',par3,', D=',par4,')',sep='')
mysub <- paste('(base=',par8,', d=',par3,', D=',par4,', CI=', par7, ', CI type=',par6,')',sep='')
}
plot(x,type='l', main=mytitle,xlab='time',ylab='value')
par(op)
dev.off()
bitmap(file='pic1.png')
racf <- acf(x, par1, main='Autocorrelation', xlab='time lag', ylab='ACF', ci.type=par6, ci=par7, sub=mysub)
dev.off()
bitmap(file='pic2.png')
rpacf <- pacf(x,par1,main='Partial Autocorrelation',xlab='lags',ylab='PACF',sub=mysub)
dev.off()
(myacf <- c(racf$acf))
(mypacf <- c(rpacf$acf))
lengthx <- length(x)
sqrtn <- sqrt(lengthx)
load(file='createtable')
a<-table.start()
a<-table.row.start(a)
a<-table.element(a,'Autocorrelation Function',4,TRUE)
a<-table.row.end(a)
a<-table.row.start(a)
a<-table.element(a,'Time lag k',header=TRUE)
a<-table.element(a,hyperlink('basics.htm','ACF(k)','click here for more information about the Autocorrelation Function'),header=TRUE)
a<-table.element(a,'T-STAT',header=TRUE)
a<-table.element(a,'P-value',header=TRUE)
a<-table.row.end(a)
for (i in 2:(par1+1)) {
a<-table.row.start(a)
a<-table.element(a,i-1,header=TRUE)
a<-table.element(a,round(myacf[i],6))
mytstat <- myacf[i]*sqrtn
a<-table.element(a,round(mytstat,4))
a<-table.element(a,round(1-pt(abs(mytstat),lengthx),6))
a<-table.row.end(a)
}
a<-table.end(a)
table.save(a,file='mytable.tab')
a<-table.start()
a<-table.row.start(a)
a<-table.element(a,'Partial Autocorrelation Function',4,TRUE)
a<-table.row.end(a)
a<-table.row.start(a)
a<-table.element(a,'Time lag k',header=TRUE)
a<-table.element(a,hyperlink('basics.htm','PACF(k)','click here for more information about the Partial Autocorrelation Function'),header=TRUE)
a<-table.element(a,'T-STAT',header=TRUE)
a<-table.element(a,'P-value',header=TRUE)
a<-table.row.end(a)
for (i in 1:par1) {
a<-table.row.start(a)
a<-table.element(a,i,header=TRUE)
a<-table.element(a,round(mypacf[i],6))
mytstat <- mypacf[i]*sqrtn
a<-table.element(a,round(mytstat,4))
a<-table.element(a,round(1-pt(abs(mytstat),lengthx),6))
a<-table.row.end(a)
}
a<-table.end(a)
table.save(a,file='mytable1.tab')