Free Statistics

of Irreproducible Research!

Author's title

Author*Unverified author*
R Software Modulerwasp_autocorrelation.wasp
Title produced by software(Partial) Autocorrelation Function
Date of computationMon, 17 Oct 2016 17:40:52 +0100
Cite this page as followsStatistical Computations at FreeStatistics.org, Office for Research Development and Education, URL https://freestatistics.org/blog/index.php?v=date/2016/Oct/17/t1476722532cqkem54l5wz7alr.htm/, Retrieved Sat, 04 May 2024 23:07:31 +0200
Statistical Computations at FreeStatistics.org, Office for Research Development and Education, URL https://freestatistics.org/blog/index.php?pk=, Retrieved Sat, 04 May 2024 23:07:31 +0200
QR Codes:

Original text written by user:
IsPrivate?No (this computation is public)
User-defined keywords
Estimated Impact0
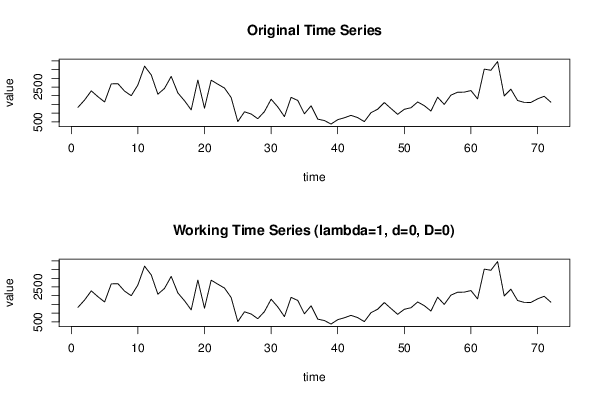
Dataseries X:
1336
1756
2279
1944
1642
2679
2690
2263
2002
2620
3694
3194
2089
2420
3108
2160
1713
1191
2897
1287
2891
2662
2440
1899
519
1079
955
684
1090
1802
1360
804
1905
1732
964
1424
661
579
378
629
737
877
746
518
1032
1227
1610
1268
935
1224
1313
1642
1431
1124
1915
1503
2035
2200
2205
2297
1818
3525
3458
3958
1987
2375
1728
1618
1614
1820
1969
1632


Summary of computational transaction
Raw Inputview raw input (R code)
Raw Outputview raw output of R engine
Computing time2 seconds
R Server'Sir Maurice George Kendall' @ kendall.wessa.net

\begin{tabular}{lllllllll}
\hline
Summary of computational transaction \tabularnewline
Raw Input & view raw input (R code)  \tabularnewline
Raw Output & view raw output of R engine  \tabularnewline
Computing time & 2 seconds \tabularnewline
R Server & 'Sir Maurice George Kendall' @ kendall.wessa.net \tabularnewline
\hline
\end{tabular}
%Source: https://freestatistics.org/blog/index.php?pk=&T=0

[TABLE]
[ROW][C]Summary of computational transaction[/C][/ROW]
[ROW][C]Raw Input[/C][C]view raw input (R code) [/C][/ROW]
[ROW][C]Raw Output[/C][C]view raw output of R engine [/C][/ROW]
[ROW][C]Computing time[/C][C]2 seconds[/C][/ROW]
[ROW][C]R Server[/C][C]'Sir Maurice George Kendall' @ kendall.wessa.net[/C][/ROW]
[/TABLE]
Source: https://freestatistics.org/blog/index.php?pk=&T=0

Globally Unique Identifier (entire table): ba.freestatistics.org/blog/index.php?pk=&T=0

As an alternative you can also use a QR Code:  

The GUIDs for individual cells are displayed in the table below:

Summary of computational transaction
Raw Inputview raw input (R code)
Raw Outputview raw output of R engine
Computing time2 seconds
R Server'Sir Maurice George Kendall' @ kendall.wessa.net


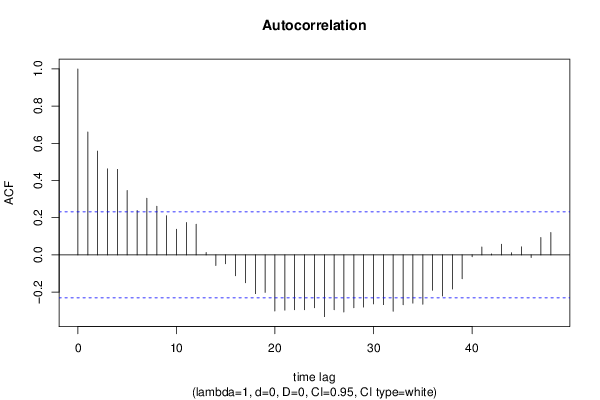
Autocorrelation Function
Time lag kACF(k)T-STATP-value
10.66055.60450
20.5581354.73595e-06
30.4626613.92589.8e-05
40.4597243.90090.000107
50.3464752.93990.002205
60.2387372.02570.023249
70.3044722.58350.005905
80.2614832.21880.014828
90.2108851.78940.038877
100.1380351.17130.122676
110.1741111.47740.071967
120.1643631.39470.083702
130.0127790.10840.456977
14-0.057065-0.48420.314852
15-0.048014-0.40740.342456
16-0.112701-0.95630.17106
17-0.150538-1.27740.10279
18-0.208589-1.76990.040485
19-0.201916-1.71330.045479
20-0.30234-2.56540.006194
21-0.297404-2.52360.006912
22-0.295271-2.50550.007246
23-0.29568-2.50890.007181
24-0.28481-2.41670.009099
25-0.332399-2.82050.003095
26-0.295627-2.50850.007189
27-0.307632-2.61030.005499
28-0.284825-2.41680.009096
29-0.281004-2.38440.009872
30-0.263765-2.23810.014153
31-0.267802-2.27240.013026
32-0.303667-2.57670.006012
33-0.268772-2.28060.012767
34-0.259557-2.20240.01542
35-0.265472-2.25260.013666
36-0.190134-1.61330.055523
37-0.221156-1.87660.032315
38-0.184054-1.56170.061366
39-0.128412-1.08960.139759
40-0.01067-0.09050.464055
410.042380.35960.360096
420.0051620.04380.482594
430.0567550.48160.315781
440.0111920.0950.462302
450.0429350.36430.358344
46-0.014343-0.12170.451737
470.0929810.7890.216359
480.1199121.01750.156164

\begin{tabular}{lllllllll}
\hline
Autocorrelation Function \tabularnewline
Time lag k & ACF(k) & T-STAT & P-value \tabularnewline
1 & 0.6605 & 5.6045 & 0 \tabularnewline
2 & 0.558135 & 4.7359 & 5e-06 \tabularnewline
3 & 0.462661 & 3.9258 & 9.8e-05 \tabularnewline
4 & 0.459724 & 3.9009 & 0.000107 \tabularnewline
5 & 0.346475 & 2.9399 & 0.002205 \tabularnewline
6 & 0.238737 & 2.0257 & 0.023249 \tabularnewline
7 & 0.304472 & 2.5835 & 0.005905 \tabularnewline
8 & 0.261483 & 2.2188 & 0.014828 \tabularnewline
9 & 0.210885 & 1.7894 & 0.038877 \tabularnewline
10 & 0.138035 & 1.1713 & 0.122676 \tabularnewline
11 & 0.174111 & 1.4774 & 0.071967 \tabularnewline
12 & 0.164363 & 1.3947 & 0.083702 \tabularnewline
13 & 0.012779 & 0.1084 & 0.456977 \tabularnewline
14 & -0.057065 & -0.4842 & 0.314852 \tabularnewline
15 & -0.048014 & -0.4074 & 0.342456 \tabularnewline
16 & -0.112701 & -0.9563 & 0.17106 \tabularnewline
17 & -0.150538 & -1.2774 & 0.10279 \tabularnewline
18 & -0.208589 & -1.7699 & 0.040485 \tabularnewline
19 & -0.201916 & -1.7133 & 0.045479 \tabularnewline
20 & -0.30234 & -2.5654 & 0.006194 \tabularnewline
21 & -0.297404 & -2.5236 & 0.006912 \tabularnewline
22 & -0.295271 & -2.5055 & 0.007246 \tabularnewline
23 & -0.29568 & -2.5089 & 0.007181 \tabularnewline
24 & -0.28481 & -2.4167 & 0.009099 \tabularnewline
25 & -0.332399 & -2.8205 & 0.003095 \tabularnewline
26 & -0.295627 & -2.5085 & 0.007189 \tabularnewline
27 & -0.307632 & -2.6103 & 0.005499 \tabularnewline
28 & -0.284825 & -2.4168 & 0.009096 \tabularnewline
29 & -0.281004 & -2.3844 & 0.009872 \tabularnewline
30 & -0.263765 & -2.2381 & 0.014153 \tabularnewline
31 & -0.267802 & -2.2724 & 0.013026 \tabularnewline
32 & -0.303667 & -2.5767 & 0.006012 \tabularnewline
33 & -0.268772 & -2.2806 & 0.012767 \tabularnewline
34 & -0.259557 & -2.2024 & 0.01542 \tabularnewline
35 & -0.265472 & -2.2526 & 0.013666 \tabularnewline
36 & -0.190134 & -1.6133 & 0.055523 \tabularnewline
37 & -0.221156 & -1.8766 & 0.032315 \tabularnewline
38 & -0.184054 & -1.5617 & 0.061366 \tabularnewline
39 & -0.128412 & -1.0896 & 0.139759 \tabularnewline
40 & -0.01067 & -0.0905 & 0.464055 \tabularnewline
41 & 0.04238 & 0.3596 & 0.360096 \tabularnewline
42 & 0.005162 & 0.0438 & 0.482594 \tabularnewline
43 & 0.056755 & 0.4816 & 0.315781 \tabularnewline
44 & 0.011192 & 0.095 & 0.462302 \tabularnewline
45 & 0.042935 & 0.3643 & 0.358344 \tabularnewline
46 & -0.014343 & -0.1217 & 0.451737 \tabularnewline
47 & 0.092981 & 0.789 & 0.216359 \tabularnewline
48 & 0.119912 & 1.0175 & 0.156164 \tabularnewline
\hline
\end{tabular}
%Source: https://freestatistics.org/blog/index.php?pk=&T=1

[TABLE]
[ROW][C]Autocorrelation Function[/C][/ROW]
[ROW][C]Time lag k[/C][C]ACF(k)[/C][C]T-STAT[/C][C]P-value[/C][/ROW]
[ROW][C]1[/C][C]0.6605[/C][C]5.6045[/C][C]0[/C][/ROW]
[ROW][C]2[/C][C]0.558135[/C][C]4.7359[/C][C]5e-06[/C][/ROW]
[ROW][C]3[/C][C]0.462661[/C][C]3.9258[/C][C]9.8e-05[/C][/ROW]
[ROW][C]4[/C][C]0.459724[/C][C]3.9009[/C][C]0.000107[/C][/ROW]
[ROW][C]5[/C][C]0.346475[/C][C]2.9399[/C][C]0.002205[/C][/ROW]
[ROW][C]6[/C][C]0.238737[/C][C]2.0257[/C][C]0.023249[/C][/ROW]
[ROW][C]7[/C][C]0.304472[/C][C]2.5835[/C][C]0.005905[/C][/ROW]
[ROW][C]8[/C][C]0.261483[/C][C]2.2188[/C][C]0.014828[/C][/ROW]
[ROW][C]9[/C][C]0.210885[/C][C]1.7894[/C][C]0.038877[/C][/ROW]
[ROW][C]10[/C][C]0.138035[/C][C]1.1713[/C][C]0.122676[/C][/ROW]
[ROW][C]11[/C][C]0.174111[/C][C]1.4774[/C][C]0.071967[/C][/ROW]
[ROW][C]12[/C][C]0.164363[/C][C]1.3947[/C][C]0.083702[/C][/ROW]
[ROW][C]13[/C][C]0.012779[/C][C]0.1084[/C][C]0.456977[/C][/ROW]
[ROW][C]14[/C][C]-0.057065[/C][C]-0.4842[/C][C]0.314852[/C][/ROW]
[ROW][C]15[/C][C]-0.048014[/C][C]-0.4074[/C][C]0.342456[/C][/ROW]
[ROW][C]16[/C][C]-0.112701[/C][C]-0.9563[/C][C]0.17106[/C][/ROW]
[ROW][C]17[/C][C]-0.150538[/C][C]-1.2774[/C][C]0.10279[/C][/ROW]
[ROW][C]18[/C][C]-0.208589[/C][C]-1.7699[/C][C]0.040485[/C][/ROW]
[ROW][C]19[/C][C]-0.201916[/C][C]-1.7133[/C][C]0.045479[/C][/ROW]
[ROW][C]20[/C][C]-0.30234[/C][C]-2.5654[/C][C]0.006194[/C][/ROW]
[ROW][C]21[/C][C]-0.297404[/C][C]-2.5236[/C][C]0.006912[/C][/ROW]
[ROW][C]22[/C][C]-0.295271[/C][C]-2.5055[/C][C]0.007246[/C][/ROW]
[ROW][C]23[/C][C]-0.29568[/C][C]-2.5089[/C][C]0.007181[/C][/ROW]
[ROW][C]24[/C][C]-0.28481[/C][C]-2.4167[/C][C]0.009099[/C][/ROW]
[ROW][C]25[/C][C]-0.332399[/C][C]-2.8205[/C][C]0.003095[/C][/ROW]
[ROW][C]26[/C][C]-0.295627[/C][C]-2.5085[/C][C]0.007189[/C][/ROW]
[ROW][C]27[/C][C]-0.307632[/C][C]-2.6103[/C][C]0.005499[/C][/ROW]
[ROW][C]28[/C][C]-0.284825[/C][C]-2.4168[/C][C]0.009096[/C][/ROW]
[ROW][C]29[/C][C]-0.281004[/C][C]-2.3844[/C][C]0.009872[/C][/ROW]
[ROW][C]30[/C][C]-0.263765[/C][C]-2.2381[/C][C]0.014153[/C][/ROW]
[ROW][C]31[/C][C]-0.267802[/C][C]-2.2724[/C][C]0.013026[/C][/ROW]
[ROW][C]32[/C][C]-0.303667[/C][C]-2.5767[/C][C]0.006012[/C][/ROW]
[ROW][C]33[/C][C]-0.268772[/C][C]-2.2806[/C][C]0.012767[/C][/ROW]
[ROW][C]34[/C][C]-0.259557[/C][C]-2.2024[/C][C]0.01542[/C][/ROW]
[ROW][C]35[/C][C]-0.265472[/C][C]-2.2526[/C][C]0.013666[/C][/ROW]
[ROW][C]36[/C][C]-0.190134[/C][C]-1.6133[/C][C]0.055523[/C][/ROW]
[ROW][C]37[/C][C]-0.221156[/C][C]-1.8766[/C][C]0.032315[/C][/ROW]
[ROW][C]38[/C][C]-0.184054[/C][C]-1.5617[/C][C]0.061366[/C][/ROW]
[ROW][C]39[/C][C]-0.128412[/C][C]-1.0896[/C][C]0.139759[/C][/ROW]
[ROW][C]40[/C][C]-0.01067[/C][C]-0.0905[/C][C]0.464055[/C][/ROW]
[ROW][C]41[/C][C]0.04238[/C][C]0.3596[/C][C]0.360096[/C][/ROW]
[ROW][C]42[/C][C]0.005162[/C][C]0.0438[/C][C]0.482594[/C][/ROW]
[ROW][C]43[/C][C]0.056755[/C][C]0.4816[/C][C]0.315781[/C][/ROW]
[ROW][C]44[/C][C]0.011192[/C][C]0.095[/C][C]0.462302[/C][/ROW]
[ROW][C]45[/C][C]0.042935[/C][C]0.3643[/C][C]0.358344[/C][/ROW]
[ROW][C]46[/C][C]-0.014343[/C][C]-0.1217[/C][C]0.451737[/C][/ROW]
[ROW][C]47[/C][C]0.092981[/C][C]0.789[/C][C]0.216359[/C][/ROW]
[ROW][C]48[/C][C]0.119912[/C][C]1.0175[/C][C]0.156164[/C][/ROW]
[/TABLE]
Source: https://freestatistics.org/blog/index.php?pk=&T=1

Globally Unique Identifier (entire table): ba.freestatistics.org/blog/index.php?pk=&T=1

As an alternative you can also use a QR Code:  

The GUIDs for individual cells are displayed in the table below:

Autocorrelation Function
Time lag kACF(k)T-STATP-value
10.66055.60450
20.5581354.73595e-06
30.4626613.92589.8e-05
40.4597243.90090.000107
50.3464752.93990.002205
60.2387372.02570.023249
70.3044722.58350.005905
80.2614832.21880.014828
90.2108851.78940.038877
100.1380351.17130.122676
110.1741111.47740.071967
120.1643631.39470.083702
130.0127790.10840.456977
14-0.057065-0.48420.314852
15-0.048014-0.40740.342456
16-0.112701-0.95630.17106
17-0.150538-1.27740.10279
18-0.208589-1.76990.040485
19-0.201916-1.71330.045479
20-0.30234-2.56540.006194
21-0.297404-2.52360.006912
22-0.295271-2.50550.007246
23-0.29568-2.50890.007181
24-0.28481-2.41670.009099
25-0.332399-2.82050.003095
26-0.295627-2.50850.007189
27-0.307632-2.61030.005499
28-0.284825-2.41680.009096
29-0.281004-2.38440.009872
30-0.263765-2.23810.014153
31-0.267802-2.27240.013026
32-0.303667-2.57670.006012
33-0.268772-2.28060.012767
34-0.259557-2.20240.01542
35-0.265472-2.25260.013666
36-0.190134-1.61330.055523
37-0.221156-1.87660.032315
38-0.184054-1.56170.061366
39-0.128412-1.08960.139759
40-0.01067-0.09050.464055
410.042380.35960.360096
420.0051620.04380.482594
430.0567550.48160.315781
440.0111920.0950.462302
450.0429350.36430.358344
46-0.014343-0.12170.451737
470.0929810.7890.216359
480.1199121.01750.156164


Partial Autocorrelation Function
Time lag kPACF(k)T-STATP-value
10.66055.60450
20.216191.83440.03536
30.0575320.48820.313454
40.1566741.32940.093953
5-0.087674-0.74390.229667
6-0.114858-0.97460.166509
70.2318241.96710.026513
8-0.031757-0.26950.39417
9-0.056381-0.47840.316905
10-0.022441-0.19040.424759
110.0501790.42580.335769
120.0099520.08440.466468
13-0.220457-1.87060.03273
14-0.105156-0.89230.187608
150.0541580.45950.323612
16-0.160108-1.35860.089264
170.0470330.39910.345506
18-0.066779-0.56660.28636
19-0.132352-1.1230.132574
20-0.148569-1.26070.105752
210.0786970.66780.253208
22-0.008417-0.07140.471632
23-0.076401-0.64830.259433
240.0421740.35790.360749
25-0.049405-0.41920.338152
26-0.04628-0.39270.34785
270.0053730.04560.481883
280.0276890.23490.407459
29-0.032504-0.27580.391742
30-0.039421-0.33450.369488
31-0.017793-0.1510.440207
32-0.089309-0.75780.225519
33-0.053437-0.45340.325803
34-0.035532-0.30150.381953
35-0.069271-0.58780.279258
360.0906250.7690.222211
37-0.141179-1.19790.117434
38-0.042965-0.36460.358251
390.1320571.12050.133103
400.1074180.91150.182544
410.0466310.39570.346757
42-0.093828-0.79620.21428
430.008250.070.472193
44-0.113809-0.96570.168713
45-0.034005-0.28850.386882
46-0.018146-0.1540.439032
470.1488941.26340.105259
48-0.086268-0.7320.233269

\begin{tabular}{lllllllll}
\hline
Partial Autocorrelation Function \tabularnewline
Time lag k & PACF(k) & T-STAT & P-value \tabularnewline
1 & 0.6605 & 5.6045 & 0 \tabularnewline
2 & 0.21619 & 1.8344 & 0.03536 \tabularnewline
3 & 0.057532 & 0.4882 & 0.313454 \tabularnewline
4 & 0.156674 & 1.3294 & 0.093953 \tabularnewline
5 & -0.087674 & -0.7439 & 0.229667 \tabularnewline
6 & -0.114858 & -0.9746 & 0.166509 \tabularnewline
7 & 0.231824 & 1.9671 & 0.026513 \tabularnewline
8 & -0.031757 & -0.2695 & 0.39417 \tabularnewline
9 & -0.056381 & -0.4784 & 0.316905 \tabularnewline
10 & -0.022441 & -0.1904 & 0.424759 \tabularnewline
11 & 0.050179 & 0.4258 & 0.335769 \tabularnewline
12 & 0.009952 & 0.0844 & 0.466468 \tabularnewline
13 & -0.220457 & -1.8706 & 0.03273 \tabularnewline
14 & -0.105156 & -0.8923 & 0.187608 \tabularnewline
15 & 0.054158 & 0.4595 & 0.323612 \tabularnewline
16 & -0.160108 & -1.3586 & 0.089264 \tabularnewline
17 & 0.047033 & 0.3991 & 0.345506 \tabularnewline
18 & -0.066779 & -0.5666 & 0.28636 \tabularnewline
19 & -0.132352 & -1.123 & 0.132574 \tabularnewline
20 & -0.148569 & -1.2607 & 0.105752 \tabularnewline
21 & 0.078697 & 0.6678 & 0.253208 \tabularnewline
22 & -0.008417 & -0.0714 & 0.471632 \tabularnewline
23 & -0.076401 & -0.6483 & 0.259433 \tabularnewline
24 & 0.042174 & 0.3579 & 0.360749 \tabularnewline
25 & -0.049405 & -0.4192 & 0.338152 \tabularnewline
26 & -0.04628 & -0.3927 & 0.34785 \tabularnewline
27 & 0.005373 & 0.0456 & 0.481883 \tabularnewline
28 & 0.027689 & 0.2349 & 0.407459 \tabularnewline
29 & -0.032504 & -0.2758 & 0.391742 \tabularnewline
30 & -0.039421 & -0.3345 & 0.369488 \tabularnewline
31 & -0.017793 & -0.151 & 0.440207 \tabularnewline
32 & -0.089309 & -0.7578 & 0.225519 \tabularnewline
33 & -0.053437 & -0.4534 & 0.325803 \tabularnewline
34 & -0.035532 & -0.3015 & 0.381953 \tabularnewline
35 & -0.069271 & -0.5878 & 0.279258 \tabularnewline
36 & 0.090625 & 0.769 & 0.222211 \tabularnewline
37 & -0.141179 & -1.1979 & 0.117434 \tabularnewline
38 & -0.042965 & -0.3646 & 0.358251 \tabularnewline
39 & 0.132057 & 1.1205 & 0.133103 \tabularnewline
40 & 0.107418 & 0.9115 & 0.182544 \tabularnewline
41 & 0.046631 & 0.3957 & 0.346757 \tabularnewline
42 & -0.093828 & -0.7962 & 0.21428 \tabularnewline
43 & 0.00825 & 0.07 & 0.472193 \tabularnewline
44 & -0.113809 & -0.9657 & 0.168713 \tabularnewline
45 & -0.034005 & -0.2885 & 0.386882 \tabularnewline
46 & -0.018146 & -0.154 & 0.439032 \tabularnewline
47 & 0.148894 & 1.2634 & 0.105259 \tabularnewline
48 & -0.086268 & -0.732 & 0.233269 \tabularnewline
\hline
\end{tabular}
%Source: https://freestatistics.org/blog/index.php?pk=&T=2

[TABLE]
[ROW][C]Partial Autocorrelation Function[/C][/ROW]
[ROW][C]Time lag k[/C][C]PACF(k)[/C][C]T-STAT[/C][C]P-value[/C][/ROW]
[ROW][C]1[/C][C]0.6605[/C][C]5.6045[/C][C]0[/C][/ROW]
[ROW][C]2[/C][C]0.21619[/C][C]1.8344[/C][C]0.03536[/C][/ROW]
[ROW][C]3[/C][C]0.057532[/C][C]0.4882[/C][C]0.313454[/C][/ROW]
[ROW][C]4[/C][C]0.156674[/C][C]1.3294[/C][C]0.093953[/C][/ROW]
[ROW][C]5[/C][C]-0.087674[/C][C]-0.7439[/C][C]0.229667[/C][/ROW]
[ROW][C]6[/C][C]-0.114858[/C][C]-0.9746[/C][C]0.166509[/C][/ROW]
[ROW][C]7[/C][C]0.231824[/C][C]1.9671[/C][C]0.026513[/C][/ROW]
[ROW][C]8[/C][C]-0.031757[/C][C]-0.2695[/C][C]0.39417[/C][/ROW]
[ROW][C]9[/C][C]-0.056381[/C][C]-0.4784[/C][C]0.316905[/C][/ROW]
[ROW][C]10[/C][C]-0.022441[/C][C]-0.1904[/C][C]0.424759[/C][/ROW]
[ROW][C]11[/C][C]0.050179[/C][C]0.4258[/C][C]0.335769[/C][/ROW]
[ROW][C]12[/C][C]0.009952[/C][C]0.0844[/C][C]0.466468[/C][/ROW]
[ROW][C]13[/C][C]-0.220457[/C][C]-1.8706[/C][C]0.03273[/C][/ROW]
[ROW][C]14[/C][C]-0.105156[/C][C]-0.8923[/C][C]0.187608[/C][/ROW]
[ROW][C]15[/C][C]0.054158[/C][C]0.4595[/C][C]0.323612[/C][/ROW]
[ROW][C]16[/C][C]-0.160108[/C][C]-1.3586[/C][C]0.089264[/C][/ROW]
[ROW][C]17[/C][C]0.047033[/C][C]0.3991[/C][C]0.345506[/C][/ROW]
[ROW][C]18[/C][C]-0.066779[/C][C]-0.5666[/C][C]0.28636[/C][/ROW]
[ROW][C]19[/C][C]-0.132352[/C][C]-1.123[/C][C]0.132574[/C][/ROW]
[ROW][C]20[/C][C]-0.148569[/C][C]-1.2607[/C][C]0.105752[/C][/ROW]
[ROW][C]21[/C][C]0.078697[/C][C]0.6678[/C][C]0.253208[/C][/ROW]
[ROW][C]22[/C][C]-0.008417[/C][C]-0.0714[/C][C]0.471632[/C][/ROW]
[ROW][C]23[/C][C]-0.076401[/C][C]-0.6483[/C][C]0.259433[/C][/ROW]
[ROW][C]24[/C][C]0.042174[/C][C]0.3579[/C][C]0.360749[/C][/ROW]
[ROW][C]25[/C][C]-0.049405[/C][C]-0.4192[/C][C]0.338152[/C][/ROW]
[ROW][C]26[/C][C]-0.04628[/C][C]-0.3927[/C][C]0.34785[/C][/ROW]
[ROW][C]27[/C][C]0.005373[/C][C]0.0456[/C][C]0.481883[/C][/ROW]
[ROW][C]28[/C][C]0.027689[/C][C]0.2349[/C][C]0.407459[/C][/ROW]
[ROW][C]29[/C][C]-0.032504[/C][C]-0.2758[/C][C]0.391742[/C][/ROW]
[ROW][C]30[/C][C]-0.039421[/C][C]-0.3345[/C][C]0.369488[/C][/ROW]
[ROW][C]31[/C][C]-0.017793[/C][C]-0.151[/C][C]0.440207[/C][/ROW]
[ROW][C]32[/C][C]-0.089309[/C][C]-0.7578[/C][C]0.225519[/C][/ROW]
[ROW][C]33[/C][C]-0.053437[/C][C]-0.4534[/C][C]0.325803[/C][/ROW]
[ROW][C]34[/C][C]-0.035532[/C][C]-0.3015[/C][C]0.381953[/C][/ROW]
[ROW][C]35[/C][C]-0.069271[/C][C]-0.5878[/C][C]0.279258[/C][/ROW]
[ROW][C]36[/C][C]0.090625[/C][C]0.769[/C][C]0.222211[/C][/ROW]
[ROW][C]37[/C][C]-0.141179[/C][C]-1.1979[/C][C]0.117434[/C][/ROW]
[ROW][C]38[/C][C]-0.042965[/C][C]-0.3646[/C][C]0.358251[/C][/ROW]
[ROW][C]39[/C][C]0.132057[/C][C]1.1205[/C][C]0.133103[/C][/ROW]
[ROW][C]40[/C][C]0.107418[/C][C]0.9115[/C][C]0.182544[/C][/ROW]
[ROW][C]41[/C][C]0.046631[/C][C]0.3957[/C][C]0.346757[/C][/ROW]
[ROW][C]42[/C][C]-0.093828[/C][C]-0.7962[/C][C]0.21428[/C][/ROW]
[ROW][C]43[/C][C]0.00825[/C][C]0.07[/C][C]0.472193[/C][/ROW]
[ROW][C]44[/C][C]-0.113809[/C][C]-0.9657[/C][C]0.168713[/C][/ROW]
[ROW][C]45[/C][C]-0.034005[/C][C]-0.2885[/C][C]0.386882[/C][/ROW]
[ROW][C]46[/C][C]-0.018146[/C][C]-0.154[/C][C]0.439032[/C][/ROW]
[ROW][C]47[/C][C]0.148894[/C][C]1.2634[/C][C]0.105259[/C][/ROW]
[ROW][C]48[/C][C]-0.086268[/C][C]-0.732[/C][C]0.233269[/C][/ROW]
[/TABLE]
Source: https://freestatistics.org/blog/index.php?pk=&T=2

Globally Unique Identifier (entire table): ba.freestatistics.org/blog/index.php?pk=&T=2

As an alternative you can also use a QR Code:  

The GUIDs for individual cells are displayed in the table below:

Partial Autocorrelation Function
Time lag kPACF(k)T-STATP-value
10.66055.60450
20.216191.83440.03536
30.0575320.48820.313454
40.1566741.32940.093953
5-0.087674-0.74390.229667
6-0.114858-0.97460.166509
70.2318241.96710.026513
8-0.031757-0.26950.39417
9-0.056381-0.47840.316905
10-0.022441-0.19040.424759
110.0501790.42580.335769
120.0099520.08440.466468
13-0.220457-1.87060.03273
14-0.105156-0.89230.187608
150.0541580.45950.323612
16-0.160108-1.35860.089264
170.0470330.39910.345506
18-0.066779-0.56660.28636
19-0.132352-1.1230.132574
20-0.148569-1.26070.105752
210.0786970.66780.253208
22-0.008417-0.07140.471632
23-0.076401-0.64830.259433
240.0421740.35790.360749
25-0.049405-0.41920.338152
26-0.04628-0.39270.34785
270.0053730.04560.481883
280.0276890.23490.407459
29-0.032504-0.27580.391742
30-0.039421-0.33450.369488
31-0.017793-0.1510.440207
32-0.089309-0.75780.225519
33-0.053437-0.45340.325803
34-0.035532-0.30150.381953
35-0.069271-0.58780.279258
360.0906250.7690.222211
37-0.141179-1.19790.117434
38-0.042965-0.36460.358251
390.1320571.12050.133103
400.1074180.91150.182544
410.0466310.39570.346757
42-0.093828-0.79620.21428
430.008250.070.472193
44-0.113809-0.96570.168713
45-0.034005-0.28850.386882
46-0.018146-0.1540.439032
470.1488941.26340.105259
48-0.086268-0.7320.233269


Parameters (Session):
par1 = 48 ; par2 = 1 ; par3 = 0 ; par4 = 0 ; par5 = 12 ; par6 = White Noise ; par7 = 0.95 ;
Parameters (R input):
par1 = 48 ; par2 = 1 ; par3 = 0 ; par4 = 0 ; par5 = 12 ; par6 = White Noise ; par7 = 0.95 ; par8 = ;
R code (references can be found in the software module):
if (par1 == 'Default') {
par1 = 10*log10(length(x))
} else {
par1 <- as.numeric(par1)
}
par2 <- as.numeric(par2)
par3 <- as.numeric(par3)
par4 <- as.numeric(par4)
par5 <- as.numeric(par5)
if (par6 == 'White Noise') par6 <- 'white' else par6 <- 'ma'
par7 <- as.numeric(par7)
if (par8 != '') par8 <- as.numeric(par8)
x <- na.omit(x)
ox <- x
if (par8 == '') {
if (par2 == 0) {
x <- log(x)
} else {
x <- (x ^ par2 - 1) / par2
}
} else {
x <- log(x,base=par8)
}
if (par3 > 0) x <- diff(x,lag=1,difference=par3)
if (par4 > 0) x <- diff(x,lag=par5,difference=par4)
bitmap(file='picts.png')
op <- par(mfrow=c(2,1))
plot(ox,type='l',main='Original Time Series',xlab='time',ylab='value')
if (par8=='') {
mytitle <- paste('Working Time Series (lambda=',par2,', d=',par3,', D=',par4,')',sep='')
mysub <- paste('(lambda=',par2,', d=',par3,', D=',par4,', CI=', par7, ', CI type=',par6,')',sep='')
} else {
mytitle <- paste('Working Time Series (base=',par8,', d=',par3,', D=',par4,')',sep='')
mysub <- paste('(base=',par8,', d=',par3,', D=',par4,', CI=', par7, ', CI type=',par6,')',sep='')
}
plot(x,type='l', main=mytitle,xlab='time',ylab='value')
par(op)
dev.off()
bitmap(file='pic1.png')
racf <- acf(x, par1, main='Autocorrelation', xlab='time lag', ylab='ACF', ci.type=par6, ci=par7, sub=mysub)
dev.off()
bitmap(file='pic2.png')
rpacf <- pacf(x,par1,main='Partial Autocorrelation',xlab='lags',ylab='PACF',sub=mysub)
dev.off()
(myacf <- c(racf$acf))
(mypacf <- c(rpacf$acf))
lengthx <- length(x)
sqrtn <- sqrt(lengthx)
load(file='createtable')
a<-table.start()
a<-table.row.start(a)
a<-table.element(a,'Autocorrelation Function',4,TRUE)
a<-table.row.end(a)
a<-table.row.start(a)
a<-table.element(a,'Time lag k',header=TRUE)
a<-table.element(a,hyperlink('basics.htm','ACF(k)','click here for more information about the Autocorrelation Function'),header=TRUE)
a<-table.element(a,'T-STAT',header=TRUE)
a<-table.element(a,'P-value',header=TRUE)
a<-table.row.end(a)
for (i in 2:(par1+1)) {
a<-table.row.start(a)
a<-table.element(a,i-1,header=TRUE)
a<-table.element(a,round(myacf[i],6))
mytstat <- myacf[i]*sqrtn
a<-table.element(a,round(mytstat,4))
a<-table.element(a,round(1-pt(abs(mytstat),lengthx),6))
a<-table.row.end(a)
}
a<-table.end(a)
table.save(a,file='mytable.tab')
a<-table.start()
a<-table.row.start(a)
a<-table.element(a,'Partial Autocorrelation Function',4,TRUE)
a<-table.row.end(a)
a<-table.row.start(a)
a<-table.element(a,'Time lag k',header=TRUE)
a<-table.element(a,hyperlink('basics.htm','PACF(k)','click here for more information about the Partial Autocorrelation Function'),header=TRUE)
a<-table.element(a,'T-STAT',header=TRUE)
a<-table.element(a,'P-value',header=TRUE)
a<-table.row.end(a)
for (i in 1:par1) {
a<-table.row.start(a)
a<-table.element(a,i,header=TRUE)
a<-table.element(a,round(mypacf[i],6))
mytstat <- mypacf[i]*sqrtn
a<-table.element(a,round(mytstat,4))
a<-table.element(a,round(1-pt(abs(mytstat),lengthx),6))
a<-table.row.end(a)
}
a<-table.end(a)
table.save(a,file='mytable1.tab')