Free Statistics

of Irreproducible Research!

Author's title

Author*Unverified author*
R Software Modulerwasp_autocorrelation.wasp
Title produced by software(Partial) Autocorrelation Function
Date of computationMon, 17 Oct 2016 18:14:30 +0100
Cite this page as followsStatistical Computations at FreeStatistics.org, Office for Research Development and Education, URL https://freestatistics.org/blog/index.php?v=date/2016/Oct/17/t1476724489pj9d69zjucoampu.htm/, Retrieved Sun, 05 May 2024 04:39:13 +0200
Statistical Computations at FreeStatistics.org, Office for Research Development and Education, URL https://freestatistics.org/blog/index.php?pk=, Retrieved Sun, 05 May 2024 04:39:13 +0200
QR Codes:

Original text written by user:
IsPrivate?No (this computation is public)
User-defined keywords
Estimated Impact0
Dataseries X:
154
156
152
150
152
138
140
138
141
152
158
146
166
167
163
169
168
158
159
161
166
177
186
182
203
213
215
216
219
217
216
222
224
234
237
233
253
257
254
258
253
241
238
240
240
245
249
247
263
265
261
257
252
245
235
240
243
255
252
240


Summary of computational transaction
Raw Inputview raw input (R code)
Raw Outputview raw output of R engine
Computing time1 seconds
R Server'Sir Ronald Aylmer Fisher' @ fisher.wessa.net

\begin{tabular}{lllllllll}
\hline
Summary of computational transaction \tabularnewline
Raw Input & view raw input (R code)  \tabularnewline
Raw Output & view raw output of R engine  \tabularnewline
Computing time & 1 seconds \tabularnewline
R Server & 'Sir Ronald Aylmer Fisher' @ fisher.wessa.net \tabularnewline
\hline
\end{tabular}
%Source: https://freestatistics.org/blog/index.php?pk=&T=0

[TABLE]
[ROW][C]Summary of computational transaction[/C][/ROW]
[ROW][C]Raw Input[/C][C]view raw input (R code) [/C][/ROW]
[ROW][C]Raw Output[/C][C]view raw output of R engine [/C][/ROW]
[ROW][C]Computing time[/C][C]1 seconds[/C][/ROW]
[ROW][C]R Server[/C][C]'Sir Ronald Aylmer Fisher' @ fisher.wessa.net[/C][/ROW]
[/TABLE]
Source: https://freestatistics.org/blog/index.php?pk=&T=0

Globally Unique Identifier (entire table): ba.freestatistics.org/blog/index.php?pk=&T=0

As an alternative you can also use a QR Code:  

The GUIDs for individual cells are displayed in the table below:

Summary of computational transaction
Raw Inputview raw input (R code)
Raw Outputview raw output of R engine
Computing time1 seconds
R Server'Sir Ronald Aylmer Fisher' @ fisher.wessa.net


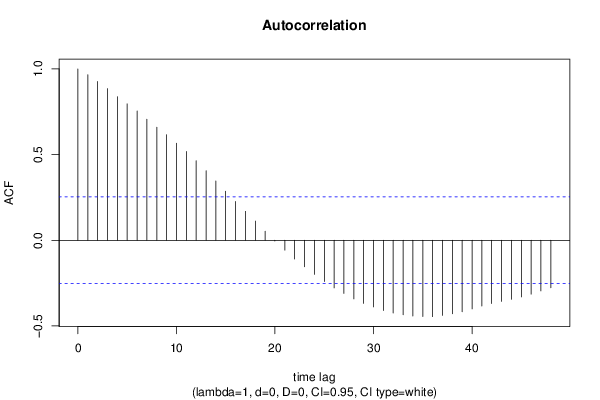
Autocorrelation Function
Time lag kACF(k)T-STATP-value
10.9658217.48120
20.9270157.18060
30.8853236.85770
40.8378466.48990
50.7961386.16690
60.7542975.84280
70.7060435.4690
80.6599495.11192e-06
90.6155224.76786e-06
100.5659834.38412.4e-05
110.5187224.0188.3e-05
120.4645923.59870.000324
130.40583.14330.001298
140.3460212.68030.004742
150.2860642.21580.015254
160.2261351.75160.042473
170.1687691.30730.098053
180.1120250.86770.194496
190.0529450.41010.341592
20-0.004604-0.03570.485835
21-0.057478-0.44520.328881
22-0.108888-0.84340.201166
23-0.154085-1.19350.118679
24-0.199148-1.54260.064094
25-0.241012-1.86690.033404
26-0.277651-2.15070.01777
27-0.309744-2.39930.009775
28-0.341962-2.64880.005154
29-0.368197-2.8520.002975
30-0.388702-3.01090.001904
31-0.410245-3.17770.001173
32-0.424929-3.29150.000836
33-0.434782-3.36780.000664
34-0.442304-3.42610.000555
35-0.444642-3.44420.000525
36-0.44569-3.45230.000512
37-0.438166-3.3940.000613
38-0.429195-3.32450.000757
39-0.417175-3.23140.001001
40-0.400564-3.10280.001461
41-0.383354-2.96940.002142
42-0.369163-2.85950.002914
43-0.356541-2.76180.003809
44-0.344266-2.66670.004916
45-0.330473-2.55980.006505
46-0.31421-2.43390.008967
47-0.295425-2.28840.012827
48-0.277463-2.14920.01783

\begin{tabular}{lllllllll}
\hline
Autocorrelation Function \tabularnewline
Time lag k & ACF(k) & T-STAT & P-value \tabularnewline
1 & 0.965821 & 7.4812 & 0 \tabularnewline
2 & 0.927015 & 7.1806 & 0 \tabularnewline
3 & 0.885323 & 6.8577 & 0 \tabularnewline
4 & 0.837846 & 6.4899 & 0 \tabularnewline
5 & 0.796138 & 6.1669 & 0 \tabularnewline
6 & 0.754297 & 5.8428 & 0 \tabularnewline
7 & 0.706043 & 5.469 & 0 \tabularnewline
8 & 0.659949 & 5.1119 & 2e-06 \tabularnewline
9 & 0.615522 & 4.7678 & 6e-06 \tabularnewline
10 & 0.565983 & 4.3841 & 2.4e-05 \tabularnewline
11 & 0.518722 & 4.018 & 8.3e-05 \tabularnewline
12 & 0.464592 & 3.5987 & 0.000324 \tabularnewline
13 & 0.4058 & 3.1433 & 0.001298 \tabularnewline
14 & 0.346021 & 2.6803 & 0.004742 \tabularnewline
15 & 0.286064 & 2.2158 & 0.015254 \tabularnewline
16 & 0.226135 & 1.7516 & 0.042473 \tabularnewline
17 & 0.168769 & 1.3073 & 0.098053 \tabularnewline
18 & 0.112025 & 0.8677 & 0.194496 \tabularnewline
19 & 0.052945 & 0.4101 & 0.341592 \tabularnewline
20 & -0.004604 & -0.0357 & 0.485835 \tabularnewline
21 & -0.057478 & -0.4452 & 0.328881 \tabularnewline
22 & -0.108888 & -0.8434 & 0.201166 \tabularnewline
23 & -0.154085 & -1.1935 & 0.118679 \tabularnewline
24 & -0.199148 & -1.5426 & 0.064094 \tabularnewline
25 & -0.241012 & -1.8669 & 0.033404 \tabularnewline
26 & -0.277651 & -2.1507 & 0.01777 \tabularnewline
27 & -0.309744 & -2.3993 & 0.009775 \tabularnewline
28 & -0.341962 & -2.6488 & 0.005154 \tabularnewline
29 & -0.368197 & -2.852 & 0.002975 \tabularnewline
30 & -0.388702 & -3.0109 & 0.001904 \tabularnewline
31 & -0.410245 & -3.1777 & 0.001173 \tabularnewline
32 & -0.424929 & -3.2915 & 0.000836 \tabularnewline
33 & -0.434782 & -3.3678 & 0.000664 \tabularnewline
34 & -0.442304 & -3.4261 & 0.000555 \tabularnewline
35 & -0.444642 & -3.4442 & 0.000525 \tabularnewline
36 & -0.44569 & -3.4523 & 0.000512 \tabularnewline
37 & -0.438166 & -3.394 & 0.000613 \tabularnewline
38 & -0.429195 & -3.3245 & 0.000757 \tabularnewline
39 & -0.417175 & -3.2314 & 0.001001 \tabularnewline
40 & -0.400564 & -3.1028 & 0.001461 \tabularnewline
41 & -0.383354 & -2.9694 & 0.002142 \tabularnewline
42 & -0.369163 & -2.8595 & 0.002914 \tabularnewline
43 & -0.356541 & -2.7618 & 0.003809 \tabularnewline
44 & -0.344266 & -2.6667 & 0.004916 \tabularnewline
45 & -0.330473 & -2.5598 & 0.006505 \tabularnewline
46 & -0.31421 & -2.4339 & 0.008967 \tabularnewline
47 & -0.295425 & -2.2884 & 0.012827 \tabularnewline
48 & -0.277463 & -2.1492 & 0.01783 \tabularnewline
\hline
\end{tabular}
%Source: https://freestatistics.org/blog/index.php?pk=&T=1

[TABLE]
[ROW][C]Autocorrelation Function[/C][/ROW]
[ROW][C]Time lag k[/C][C]ACF(k)[/C][C]T-STAT[/C][C]P-value[/C][/ROW]
[ROW][C]1[/C][C]0.965821[/C][C]7.4812[/C][C]0[/C][/ROW]
[ROW][C]2[/C][C]0.927015[/C][C]7.1806[/C][C]0[/C][/ROW]
[ROW][C]3[/C][C]0.885323[/C][C]6.8577[/C][C]0[/C][/ROW]
[ROW][C]4[/C][C]0.837846[/C][C]6.4899[/C][C]0[/C][/ROW]
[ROW][C]5[/C][C]0.796138[/C][C]6.1669[/C][C]0[/C][/ROW]
[ROW][C]6[/C][C]0.754297[/C][C]5.8428[/C][C]0[/C][/ROW]
[ROW][C]7[/C][C]0.706043[/C][C]5.469[/C][C]0[/C][/ROW]
[ROW][C]8[/C][C]0.659949[/C][C]5.1119[/C][C]2e-06[/C][/ROW]
[ROW][C]9[/C][C]0.615522[/C][C]4.7678[/C][C]6e-06[/C][/ROW]
[ROW][C]10[/C][C]0.565983[/C][C]4.3841[/C][C]2.4e-05[/C][/ROW]
[ROW][C]11[/C][C]0.518722[/C][C]4.018[/C][C]8.3e-05[/C][/ROW]
[ROW][C]12[/C][C]0.464592[/C][C]3.5987[/C][C]0.000324[/C][/ROW]
[ROW][C]13[/C][C]0.4058[/C][C]3.1433[/C][C]0.001298[/C][/ROW]
[ROW][C]14[/C][C]0.346021[/C][C]2.6803[/C][C]0.004742[/C][/ROW]
[ROW][C]15[/C][C]0.286064[/C][C]2.2158[/C][C]0.015254[/C][/ROW]
[ROW][C]16[/C][C]0.226135[/C][C]1.7516[/C][C]0.042473[/C][/ROW]
[ROW][C]17[/C][C]0.168769[/C][C]1.3073[/C][C]0.098053[/C][/ROW]
[ROW][C]18[/C][C]0.112025[/C][C]0.8677[/C][C]0.194496[/C][/ROW]
[ROW][C]19[/C][C]0.052945[/C][C]0.4101[/C][C]0.341592[/C][/ROW]
[ROW][C]20[/C][C]-0.004604[/C][C]-0.0357[/C][C]0.485835[/C][/ROW]
[ROW][C]21[/C][C]-0.057478[/C][C]-0.4452[/C][C]0.328881[/C][/ROW]
[ROW][C]22[/C][C]-0.108888[/C][C]-0.8434[/C][C]0.201166[/C][/ROW]
[ROW][C]23[/C][C]-0.154085[/C][C]-1.1935[/C][C]0.118679[/C][/ROW]
[ROW][C]24[/C][C]-0.199148[/C][C]-1.5426[/C][C]0.064094[/C][/ROW]
[ROW][C]25[/C][C]-0.241012[/C][C]-1.8669[/C][C]0.033404[/C][/ROW]
[ROW][C]26[/C][C]-0.277651[/C][C]-2.1507[/C][C]0.01777[/C][/ROW]
[ROW][C]27[/C][C]-0.309744[/C][C]-2.3993[/C][C]0.009775[/C][/ROW]
[ROW][C]28[/C][C]-0.341962[/C][C]-2.6488[/C][C]0.005154[/C][/ROW]
[ROW][C]29[/C][C]-0.368197[/C][C]-2.852[/C][C]0.002975[/C][/ROW]
[ROW][C]30[/C][C]-0.388702[/C][C]-3.0109[/C][C]0.001904[/C][/ROW]
[ROW][C]31[/C][C]-0.410245[/C][C]-3.1777[/C][C]0.001173[/C][/ROW]
[ROW][C]32[/C][C]-0.424929[/C][C]-3.2915[/C][C]0.000836[/C][/ROW]
[ROW][C]33[/C][C]-0.434782[/C][C]-3.3678[/C][C]0.000664[/C][/ROW]
[ROW][C]34[/C][C]-0.442304[/C][C]-3.4261[/C][C]0.000555[/C][/ROW]
[ROW][C]35[/C][C]-0.444642[/C][C]-3.4442[/C][C]0.000525[/C][/ROW]
[ROW][C]36[/C][C]-0.44569[/C][C]-3.4523[/C][C]0.000512[/C][/ROW]
[ROW][C]37[/C][C]-0.438166[/C][C]-3.394[/C][C]0.000613[/C][/ROW]
[ROW][C]38[/C][C]-0.429195[/C][C]-3.3245[/C][C]0.000757[/C][/ROW]
[ROW][C]39[/C][C]-0.417175[/C][C]-3.2314[/C][C]0.001001[/C][/ROW]
[ROW][C]40[/C][C]-0.400564[/C][C]-3.1028[/C][C]0.001461[/C][/ROW]
[ROW][C]41[/C][C]-0.383354[/C][C]-2.9694[/C][C]0.002142[/C][/ROW]
[ROW][C]42[/C][C]-0.369163[/C][C]-2.8595[/C][C]0.002914[/C][/ROW]
[ROW][C]43[/C][C]-0.356541[/C][C]-2.7618[/C][C]0.003809[/C][/ROW]
[ROW][C]44[/C][C]-0.344266[/C][C]-2.6667[/C][C]0.004916[/C][/ROW]
[ROW][C]45[/C][C]-0.330473[/C][C]-2.5598[/C][C]0.006505[/C][/ROW]
[ROW][C]46[/C][C]-0.31421[/C][C]-2.4339[/C][C]0.008967[/C][/ROW]
[ROW][C]47[/C][C]-0.295425[/C][C]-2.2884[/C][C]0.012827[/C][/ROW]
[ROW][C]48[/C][C]-0.277463[/C][C]-2.1492[/C][C]0.01783[/C][/ROW]
[/TABLE]
Source: https://freestatistics.org/blog/index.php?pk=&T=1

Globally Unique Identifier (entire table): ba.freestatistics.org/blog/index.php?pk=&T=1

As an alternative you can also use a QR Code:  

The GUIDs for individual cells are displayed in the table below:

Autocorrelation Function
Time lag kACF(k)T-STATP-value
10.9658217.48120
20.9270157.18060
30.8853236.85770
40.8378466.48990
50.7961386.16690
60.7542975.84280
70.7060435.4690
80.6599495.11192e-06
90.6155224.76786e-06
100.5659834.38412.4e-05
110.5187224.0188.3e-05
120.4645923.59870.000324
130.40583.14330.001298
140.3460212.68030.004742
150.2860642.21580.015254
160.2261351.75160.042473
170.1687691.30730.098053
180.1120250.86770.194496
190.0529450.41010.341592
20-0.004604-0.03570.485835
21-0.057478-0.44520.328881
22-0.108888-0.84340.201166
23-0.154085-1.19350.118679
24-0.199148-1.54260.064094
25-0.241012-1.86690.033404
26-0.277651-2.15070.01777
27-0.309744-2.39930.009775
28-0.341962-2.64880.005154
29-0.368197-2.8520.002975
30-0.388702-3.01090.001904
31-0.410245-3.17770.001173
32-0.424929-3.29150.000836
33-0.434782-3.36780.000664
34-0.442304-3.42610.000555
35-0.444642-3.44420.000525
36-0.44569-3.45230.000512
37-0.438166-3.3940.000613
38-0.429195-3.32450.000757
39-0.417175-3.23140.001001
40-0.400564-3.10280.001461
41-0.383354-2.96940.002142
42-0.369163-2.85950.002914
43-0.356541-2.76180.003809
44-0.344266-2.66670.004916
45-0.330473-2.55980.006505
46-0.31421-2.43390.008967
47-0.295425-2.28840.012827
48-0.277463-2.14920.01783


Partial Autocorrelation Function
Time lag kPACF(k)T-STATP-value
10.9658217.48120
2-0.086235-0.6680.253357
3-0.05891-0.45630.324906
4-0.103987-0.80550.211862
50.0732650.56750.286244
6-0.030848-0.23890.405981
7-0.120917-0.93660.176354
80.0020030.01550.493835
90.0108820.08430.466554
10-0.098348-0.76180.224582
11-0.012617-0.09770.461235
12-0.134569-1.04240.150712
13-0.073769-0.57140.284929
14-0.068093-0.52740.299915
15-0.027836-0.21560.415008
16-0.04492-0.3480.364547
17-0.027255-0.21110.416756
18-0.035874-0.27790.391029
19-0.08277-0.64110.261938
20-0.047016-0.36420.3585
210.0284390.22030.413197
22-0.038599-0.2990.382992
230.0309340.23960.405722
24-0.0646-0.50040.309317
250.019240.1490.441014
260.0089790.06960.472391
270.0147280.11410.454778
28-0.070414-0.54540.293741
290.0300860.2330.40826
300.0456990.3540.362295
31-0.058681-0.45450.32554
320.0159450.12350.451059
330.0304210.23560.407257
34-0.011857-0.09180.463565
350.0048350.03750.485125
36-0.044788-0.34690.364929
370.1254370.97160.167568
38-0.063345-0.49070.312727
390.010420.08070.467968
400.0267170.20690.418376
41-0.02573-0.19930.421351
42-0.078478-0.60790.272778
43-0.06913-0.53550.297148
44-0.031427-0.24340.404251
450.0133860.10370.458883
46-0.031949-0.24750.402694
470.032460.25140.40117
48-0.078159-0.60540.273592

\begin{tabular}{lllllllll}
\hline
Partial Autocorrelation Function \tabularnewline
Time lag k & PACF(k) & T-STAT & P-value \tabularnewline
1 & 0.965821 & 7.4812 & 0 \tabularnewline
2 & -0.086235 & -0.668 & 0.253357 \tabularnewline
3 & -0.05891 & -0.4563 & 0.324906 \tabularnewline
4 & -0.103987 & -0.8055 & 0.211862 \tabularnewline
5 & 0.073265 & 0.5675 & 0.286244 \tabularnewline
6 & -0.030848 & -0.2389 & 0.405981 \tabularnewline
7 & -0.120917 & -0.9366 & 0.176354 \tabularnewline
8 & 0.002003 & 0.0155 & 0.493835 \tabularnewline
9 & 0.010882 & 0.0843 & 0.466554 \tabularnewline
10 & -0.098348 & -0.7618 & 0.224582 \tabularnewline
11 & -0.012617 & -0.0977 & 0.461235 \tabularnewline
12 & -0.134569 & -1.0424 & 0.150712 \tabularnewline
13 & -0.073769 & -0.5714 & 0.284929 \tabularnewline
14 & -0.068093 & -0.5274 & 0.299915 \tabularnewline
15 & -0.027836 & -0.2156 & 0.415008 \tabularnewline
16 & -0.04492 & -0.348 & 0.364547 \tabularnewline
17 & -0.027255 & -0.2111 & 0.416756 \tabularnewline
18 & -0.035874 & -0.2779 & 0.391029 \tabularnewline
19 & -0.08277 & -0.6411 & 0.261938 \tabularnewline
20 & -0.047016 & -0.3642 & 0.3585 \tabularnewline
21 & 0.028439 & 0.2203 & 0.413197 \tabularnewline
22 & -0.038599 & -0.299 & 0.382992 \tabularnewline
23 & 0.030934 & 0.2396 & 0.405722 \tabularnewline
24 & -0.0646 & -0.5004 & 0.309317 \tabularnewline
25 & 0.01924 & 0.149 & 0.441014 \tabularnewline
26 & 0.008979 & 0.0696 & 0.472391 \tabularnewline
27 & 0.014728 & 0.1141 & 0.454778 \tabularnewline
28 & -0.070414 & -0.5454 & 0.293741 \tabularnewline
29 & 0.030086 & 0.233 & 0.40826 \tabularnewline
30 & 0.045699 & 0.354 & 0.362295 \tabularnewline
31 & -0.058681 & -0.4545 & 0.32554 \tabularnewline
32 & 0.015945 & 0.1235 & 0.451059 \tabularnewline
33 & 0.030421 & 0.2356 & 0.407257 \tabularnewline
34 & -0.011857 & -0.0918 & 0.463565 \tabularnewline
35 & 0.004835 & 0.0375 & 0.485125 \tabularnewline
36 & -0.044788 & -0.3469 & 0.364929 \tabularnewline
37 & 0.125437 & 0.9716 & 0.167568 \tabularnewline
38 & -0.063345 & -0.4907 & 0.312727 \tabularnewline
39 & 0.01042 & 0.0807 & 0.467968 \tabularnewline
40 & 0.026717 & 0.2069 & 0.418376 \tabularnewline
41 & -0.02573 & -0.1993 & 0.421351 \tabularnewline
42 & -0.078478 & -0.6079 & 0.272778 \tabularnewline
43 & -0.06913 & -0.5355 & 0.297148 \tabularnewline
44 & -0.031427 & -0.2434 & 0.404251 \tabularnewline
45 & 0.013386 & 0.1037 & 0.458883 \tabularnewline
46 & -0.031949 & -0.2475 & 0.402694 \tabularnewline
47 & 0.03246 & 0.2514 & 0.40117 \tabularnewline
48 & -0.078159 & -0.6054 & 0.273592 \tabularnewline
\hline
\end{tabular}
%Source: https://freestatistics.org/blog/index.php?pk=&T=2

[TABLE]
[ROW][C]Partial Autocorrelation Function[/C][/ROW]
[ROW][C]Time lag k[/C][C]PACF(k)[/C][C]T-STAT[/C][C]P-value[/C][/ROW]
[ROW][C]1[/C][C]0.965821[/C][C]7.4812[/C][C]0[/C][/ROW]
[ROW][C]2[/C][C]-0.086235[/C][C]-0.668[/C][C]0.253357[/C][/ROW]
[ROW][C]3[/C][C]-0.05891[/C][C]-0.4563[/C][C]0.324906[/C][/ROW]
[ROW][C]4[/C][C]-0.103987[/C][C]-0.8055[/C][C]0.211862[/C][/ROW]
[ROW][C]5[/C][C]0.073265[/C][C]0.5675[/C][C]0.286244[/C][/ROW]
[ROW][C]6[/C][C]-0.030848[/C][C]-0.2389[/C][C]0.405981[/C][/ROW]
[ROW][C]7[/C][C]-0.120917[/C][C]-0.9366[/C][C]0.176354[/C][/ROW]
[ROW][C]8[/C][C]0.002003[/C][C]0.0155[/C][C]0.493835[/C][/ROW]
[ROW][C]9[/C][C]0.010882[/C][C]0.0843[/C][C]0.466554[/C][/ROW]
[ROW][C]10[/C][C]-0.098348[/C][C]-0.7618[/C][C]0.224582[/C][/ROW]
[ROW][C]11[/C][C]-0.012617[/C][C]-0.0977[/C][C]0.461235[/C][/ROW]
[ROW][C]12[/C][C]-0.134569[/C][C]-1.0424[/C][C]0.150712[/C][/ROW]
[ROW][C]13[/C][C]-0.073769[/C][C]-0.5714[/C][C]0.284929[/C][/ROW]
[ROW][C]14[/C][C]-0.068093[/C][C]-0.5274[/C][C]0.299915[/C][/ROW]
[ROW][C]15[/C][C]-0.027836[/C][C]-0.2156[/C][C]0.415008[/C][/ROW]
[ROW][C]16[/C][C]-0.04492[/C][C]-0.348[/C][C]0.364547[/C][/ROW]
[ROW][C]17[/C][C]-0.027255[/C][C]-0.2111[/C][C]0.416756[/C][/ROW]
[ROW][C]18[/C][C]-0.035874[/C][C]-0.2779[/C][C]0.391029[/C][/ROW]
[ROW][C]19[/C][C]-0.08277[/C][C]-0.6411[/C][C]0.261938[/C][/ROW]
[ROW][C]20[/C][C]-0.047016[/C][C]-0.3642[/C][C]0.3585[/C][/ROW]
[ROW][C]21[/C][C]0.028439[/C][C]0.2203[/C][C]0.413197[/C][/ROW]
[ROW][C]22[/C][C]-0.038599[/C][C]-0.299[/C][C]0.382992[/C][/ROW]
[ROW][C]23[/C][C]0.030934[/C][C]0.2396[/C][C]0.405722[/C][/ROW]
[ROW][C]24[/C][C]-0.0646[/C][C]-0.5004[/C][C]0.309317[/C][/ROW]
[ROW][C]25[/C][C]0.01924[/C][C]0.149[/C][C]0.441014[/C][/ROW]
[ROW][C]26[/C][C]0.008979[/C][C]0.0696[/C][C]0.472391[/C][/ROW]
[ROW][C]27[/C][C]0.014728[/C][C]0.1141[/C][C]0.454778[/C][/ROW]
[ROW][C]28[/C][C]-0.070414[/C][C]-0.5454[/C][C]0.293741[/C][/ROW]
[ROW][C]29[/C][C]0.030086[/C][C]0.233[/C][C]0.40826[/C][/ROW]
[ROW][C]30[/C][C]0.045699[/C][C]0.354[/C][C]0.362295[/C][/ROW]
[ROW][C]31[/C][C]-0.058681[/C][C]-0.4545[/C][C]0.32554[/C][/ROW]
[ROW][C]32[/C][C]0.015945[/C][C]0.1235[/C][C]0.451059[/C][/ROW]
[ROW][C]33[/C][C]0.030421[/C][C]0.2356[/C][C]0.407257[/C][/ROW]
[ROW][C]34[/C][C]-0.011857[/C][C]-0.0918[/C][C]0.463565[/C][/ROW]
[ROW][C]35[/C][C]0.004835[/C][C]0.0375[/C][C]0.485125[/C][/ROW]
[ROW][C]36[/C][C]-0.044788[/C][C]-0.3469[/C][C]0.364929[/C][/ROW]
[ROW][C]37[/C][C]0.125437[/C][C]0.9716[/C][C]0.167568[/C][/ROW]
[ROW][C]38[/C][C]-0.063345[/C][C]-0.4907[/C][C]0.312727[/C][/ROW]
[ROW][C]39[/C][C]0.01042[/C][C]0.0807[/C][C]0.467968[/C][/ROW]
[ROW][C]40[/C][C]0.026717[/C][C]0.2069[/C][C]0.418376[/C][/ROW]
[ROW][C]41[/C][C]-0.02573[/C][C]-0.1993[/C][C]0.421351[/C][/ROW]
[ROW][C]42[/C][C]-0.078478[/C][C]-0.6079[/C][C]0.272778[/C][/ROW]
[ROW][C]43[/C][C]-0.06913[/C][C]-0.5355[/C][C]0.297148[/C][/ROW]
[ROW][C]44[/C][C]-0.031427[/C][C]-0.2434[/C][C]0.404251[/C][/ROW]
[ROW][C]45[/C][C]0.013386[/C][C]0.1037[/C][C]0.458883[/C][/ROW]
[ROW][C]46[/C][C]-0.031949[/C][C]-0.2475[/C][C]0.402694[/C][/ROW]
[ROW][C]47[/C][C]0.03246[/C][C]0.2514[/C][C]0.40117[/C][/ROW]
[ROW][C]48[/C][C]-0.078159[/C][C]-0.6054[/C][C]0.273592[/C][/ROW]
[/TABLE]
Source: https://freestatistics.org/blog/index.php?pk=&T=2

Globally Unique Identifier (entire table): ba.freestatistics.org/blog/index.php?pk=&T=2

As an alternative you can also use a QR Code:  

The GUIDs for individual cells are displayed in the table below:

Partial Autocorrelation Function
Time lag kPACF(k)T-STATP-value
10.9658217.48120
2-0.086235-0.6680.253357
3-0.05891-0.45630.324906
4-0.103987-0.80550.211862
50.0732650.56750.286244
6-0.030848-0.23890.405981
7-0.120917-0.93660.176354
80.0020030.01550.493835
90.0108820.08430.466554
10-0.098348-0.76180.224582
11-0.012617-0.09770.461235
12-0.134569-1.04240.150712
13-0.073769-0.57140.284929
14-0.068093-0.52740.299915
15-0.027836-0.21560.415008
16-0.04492-0.3480.364547
17-0.027255-0.21110.416756
18-0.035874-0.27790.391029
19-0.08277-0.64110.261938
20-0.047016-0.36420.3585
210.0284390.22030.413197
22-0.038599-0.2990.382992
230.0309340.23960.405722
24-0.0646-0.50040.309317
250.019240.1490.441014
260.0089790.06960.472391
270.0147280.11410.454778
28-0.070414-0.54540.293741
290.0300860.2330.40826
300.0456990.3540.362295
31-0.058681-0.45450.32554
320.0159450.12350.451059
330.0304210.23560.407257
34-0.011857-0.09180.463565
350.0048350.03750.485125
36-0.044788-0.34690.364929
370.1254370.97160.167568
38-0.063345-0.49070.312727
390.010420.08070.467968
400.0267170.20690.418376
41-0.02573-0.19930.421351
42-0.078478-0.60790.272778
43-0.06913-0.53550.297148
44-0.031427-0.24340.404251
450.0133860.10370.458883
46-0.031949-0.24750.402694
470.032460.25140.40117
48-0.078159-0.60540.273592


Parameters (Session):
par1 = 48 ; par2 = 1 ; par3 = 0 ; par4 = 0 ; par5 = 12 ; par6 = White Noise ; par7 = 0.95 ;
Parameters (R input):
par1 = 48 ; par2 = 1 ; par3 = 0 ; par4 = 0 ; par5 = 12 ; par6 = White Noise ; par7 = 0.95 ; par8 = ;
R code (references can be found in the software module):
par8 <- ''
par7 <- '0.95'
par6 <- 'White Noise'
par5 <- '12'
par4 <- '0'
par3 <- '1'
par2 <- '1'
par1 <- '48'
if (par1 == 'Default') {
par1 = 10*log10(length(x))
} else {
par1 <- as.numeric(par1)
}
par2 <- as.numeric(par2)
par3 <- as.numeric(par3)
par4 <- as.numeric(par4)
par5 <- as.numeric(par5)
if (par6 == 'White Noise') par6 <- 'white' else par6 <- 'ma'
par7 <- as.numeric(par7)
if (par8 != '') par8 <- as.numeric(par8)
x <- na.omit(x)
ox <- x
if (par8 == '') {
if (par2 == 0) {
x <- log(x)
} else {
x <- (x ^ par2 - 1) / par2
}
} else {
x <- log(x,base=par8)
}
if (par3 > 0) x <- diff(x,lag=1,difference=par3)
if (par4 > 0) x <- diff(x,lag=par5,difference=par4)
bitmap(file='picts.png')
op <- par(mfrow=c(2,1))
plot(ox,type='l',main='Original Time Series',xlab='time',ylab='value')
if (par8=='') {
mytitle <- paste('Working Time Series (lambda=',par2,', d=',par3,', D=',par4,')',sep='')
mysub <- paste('(lambda=',par2,', d=',par3,', D=',par4,', CI=', par7, ', CI type=',par6,')',sep='')
} else {
mytitle <- paste('Working Time Series (base=',par8,', d=',par3,', D=',par4,')',sep='')
mysub <- paste('(base=',par8,', d=',par3,', D=',par4,', CI=', par7, ', CI type=',par6,')',sep='')
}
plot(x,type='l', main=mytitle,xlab='time',ylab='value')
par(op)
dev.off()
bitmap(file='pic1.png')
racf <- acf(x, par1, main='Autocorrelation', xlab='time lag', ylab='ACF', ci.type=par6, ci=par7, sub=mysub)
dev.off()
bitmap(file='pic2.png')
rpacf <- pacf(x,par1,main='Partial Autocorrelation',xlab='lags',ylab='PACF',sub=mysub)
dev.off()
(myacf <- c(racf$acf))
(mypacf <- c(rpacf$acf))
lengthx <- length(x)
sqrtn <- sqrt(lengthx)
load(file='createtable')
a<-table.start()
a<-table.row.start(a)
a<-table.element(a,'Autocorrelation Function',4,TRUE)
a<-table.row.end(a)
a<-table.row.start(a)
a<-table.element(a,'Time lag k',header=TRUE)
a<-table.element(a,hyperlink('basics.htm','ACF(k)','click here for more information about the Autocorrelation Function'),header=TRUE)
a<-table.element(a,'T-STAT',header=TRUE)
a<-table.element(a,'P-value',header=TRUE)
a<-table.row.end(a)
for (i in 2:(par1+1)) {
a<-table.row.start(a)
a<-table.element(a,i-1,header=TRUE)
a<-table.element(a,round(myacf[i],6))
mytstat <- myacf[i]*sqrtn
a<-table.element(a,round(mytstat,4))
a<-table.element(a,round(1-pt(abs(mytstat),lengthx),6))
a<-table.row.end(a)
}
a<-table.end(a)
table.save(a,file='mytable.tab')
a<-table.start()
a<-table.row.start(a)
a<-table.element(a,'Partial Autocorrelation Function',4,TRUE)
a<-table.row.end(a)
a<-table.row.start(a)
a<-table.element(a,'Time lag k',header=TRUE)
a<-table.element(a,hyperlink('basics.htm','PACF(k)','click here for more information about the Partial Autocorrelation Function'),header=TRUE)
a<-table.element(a,'T-STAT',header=TRUE)
a<-table.element(a,'P-value',header=TRUE)
a<-table.row.end(a)
for (i in 1:par1) {
a<-table.row.start(a)
a<-table.element(a,i,header=TRUE)
a<-table.element(a,round(mypacf[i],6))
mytstat <- mypacf[i]*sqrtn
a<-table.element(a,round(mytstat,4))
a<-table.element(a,round(1-pt(abs(mytstat),lengthx),6))
a<-table.row.end(a)
}
a<-table.end(a)
table.save(a,file='mytable1.tab')