Free Statistics

of Irreproducible Research!

Author's title

Author*Unverified author*
R Software Modulerwasp_autocorrelation.wasp
Title produced by software(Partial) Autocorrelation Function
Date of computationTue, 18 Oct 2016 12:18:02 +0100
Cite this page as followsStatistical Computations at FreeStatistics.org, Office for Research Development and Education, URL https://freestatistics.org/blog/index.php?v=date/2016/Oct/18/t147678950966yg9sbdjwlsh23.htm/, Retrieved Sat, 27 Apr 2024 21:44:34 +0200
Statistical Computations at FreeStatistics.org, Office for Research Development and Education, URL https://freestatistics.org/blog/index.php?pk=, Retrieved Sat, 27 Apr 2024 21:44:34 +0200
QR Codes:

Original text written by user:
IsPrivate?No (this computation is public)
User-defined keywords
Estimated Impact0
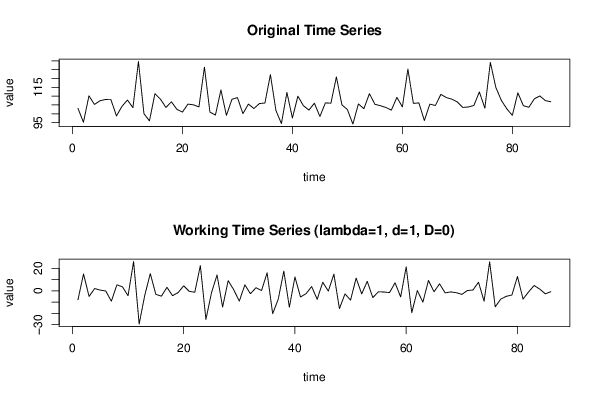
Dataseries X:
103,1
95,2
110,2
105,3
107,4
108,1
108
98,8
104,2
107,8
103,5
129,6
100,1
96
111,4
108,3
103,6
106,8
102,5
101
105,5
105,1
103,9
126,4
101
99,3
113,5
99,1
108,2
109,2
100,1
105,5
103
105,8
106,1
122,2
101,9
94,5
112,1
97,6
110
104,6
102,1
106
98,5
106,2
106
120,9
105,1
102,4
94,2
105,6
102,9
111,4
105,4
104,6
103,6
102,1
109,3
103,9
125,3
105,9
106,2
96,2
105,5
104,7
111
109,2
108,3
106,7
103,6
103,9
104,7
112,4
103,2
129,1
114,9
107,6
102,8
99,1
111,9
104,6
103,7
108,5
110,1
107,5
106,8


Summary of computational transaction
Raw Inputview raw input (R code)
Raw Outputview raw output of R engine
Computing time1 seconds
R Server'Gwilym Jenkins' @ jenkins.wessa.net

\begin{tabular}{lllllllll}
\hline
Summary of computational transaction \tabularnewline
Raw Input & view raw input (R code)  \tabularnewline
Raw Output & view raw output of R engine  \tabularnewline
Computing time & 1 seconds \tabularnewline
R Server & 'Gwilym Jenkins' @ jenkins.wessa.net \tabularnewline
\hline
\end{tabular}
%Source: https://freestatistics.org/blog/index.php?pk=&T=0

[TABLE]
[ROW][C]Summary of computational transaction[/C][/ROW]
[ROW][C]Raw Input[/C][C]view raw input (R code) [/C][/ROW]
[ROW][C]Raw Output[/C][C]view raw output of R engine [/C][/ROW]
[ROW][C]Computing time[/C][C]1 seconds[/C][/ROW]
[ROW][C]R Server[/C][C]'Gwilym Jenkins' @ jenkins.wessa.net[/C][/ROW]
[/TABLE]
Source: https://freestatistics.org/blog/index.php?pk=&T=0

Globally Unique Identifier (entire table): ba.freestatistics.org/blog/index.php?pk=&T=0

As an alternative you can also use a QR Code:  

The GUIDs for individual cells are displayed in the table below:

Summary of computational transaction
Raw Inputview raw input (R code)
Raw Outputview raw output of R engine
Computing time1 seconds
R Server'Gwilym Jenkins' @ jenkins.wessa.net


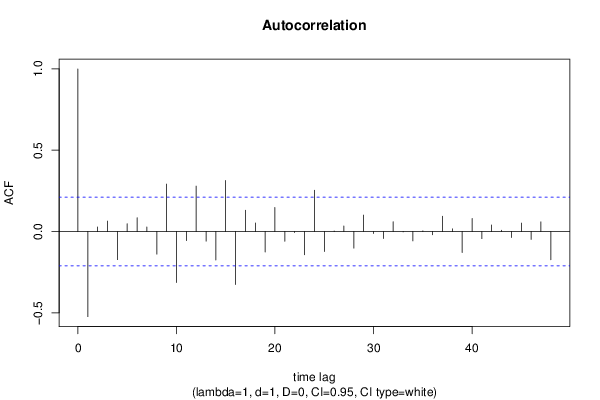
Autocorrelation Function
Time lag kACF(k)T-STATP-value
1-0.52403-4.85973e-06
20.0273030.25320.400359
30.0639210.59280.277442
4-0.173186-1.60610.055963
50.0479750.44490.328754
60.084640.78490.217329
70.0273910.2540.400044
8-0.139456-1.29330.099692
90.2915292.70350.004134
10-0.313553-2.90780.002315
11-0.056094-0.52020.302134
120.2792512.58970.00564
13-0.059608-0.55280.290923
14-0.175563-1.62810.05358
150.313572.90790.002314
16-0.326218-3.02520.001638
170.1308831.21380.11408
180.0521930.4840.3148
19-0.12633-1.17150.12231
200.1478891.37150.086899
21-0.060574-0.56170.287878
22-0.0059-0.05470.478245
23-0.142923-1.32540.094272
240.2533522.34950.010545
25-0.122934-1.140.128716
260.0030320.02810.488817
270.033350.30930.378932
28-0.102289-0.94860.172744
290.1005420.93240.176873
30-0.012353-0.11460.454533
31-0.043433-0.40280.344055
320.0595450.55220.291124
33-0.002646-0.02450.49024
34-0.058043-0.53830.295892
350.0039070.03620.485592
36-0.020095-0.18640.426304
370.0933590.86580.194512
380.0159990.14840.4412
39-0.129523-1.20110.116496
400.0799920.74180.23011
41-0.044254-0.41040.341267
420.0400740.37160.355542
430.0079930.07410.470541
44-0.036947-0.34260.366357
450.0514550.47720.317226
46-0.048772-0.45230.326098
470.059280.54970.291961
48-0.17361-1.610.055532

\begin{tabular}{lllllllll}
\hline
Autocorrelation Function \tabularnewline
Time lag k & ACF(k) & T-STAT & P-value \tabularnewline
1 & -0.52403 & -4.8597 & 3e-06 \tabularnewline
2 & 0.027303 & 0.2532 & 0.400359 \tabularnewline
3 & 0.063921 & 0.5928 & 0.277442 \tabularnewline
4 & -0.173186 & -1.6061 & 0.055963 \tabularnewline
5 & 0.047975 & 0.4449 & 0.328754 \tabularnewline
6 & 0.08464 & 0.7849 & 0.217329 \tabularnewline
7 & 0.027391 & 0.254 & 0.400044 \tabularnewline
8 & -0.139456 & -1.2933 & 0.099692 \tabularnewline
9 & 0.291529 & 2.7035 & 0.004134 \tabularnewline
10 & -0.313553 & -2.9078 & 0.002315 \tabularnewline
11 & -0.056094 & -0.5202 & 0.302134 \tabularnewline
12 & 0.279251 & 2.5897 & 0.00564 \tabularnewline
13 & -0.059608 & -0.5528 & 0.290923 \tabularnewline
14 & -0.175563 & -1.6281 & 0.05358 \tabularnewline
15 & 0.31357 & 2.9079 & 0.002314 \tabularnewline
16 & -0.326218 & -3.0252 & 0.001638 \tabularnewline
17 & 0.130883 & 1.2138 & 0.11408 \tabularnewline
18 & 0.052193 & 0.484 & 0.3148 \tabularnewline
19 & -0.12633 & -1.1715 & 0.12231 \tabularnewline
20 & 0.147889 & 1.3715 & 0.086899 \tabularnewline
21 & -0.060574 & -0.5617 & 0.287878 \tabularnewline
22 & -0.0059 & -0.0547 & 0.478245 \tabularnewline
23 & -0.142923 & -1.3254 & 0.094272 \tabularnewline
24 & 0.253352 & 2.3495 & 0.010545 \tabularnewline
25 & -0.122934 & -1.14 & 0.128716 \tabularnewline
26 & 0.003032 & 0.0281 & 0.488817 \tabularnewline
27 & 0.03335 & 0.3093 & 0.378932 \tabularnewline
28 & -0.102289 & -0.9486 & 0.172744 \tabularnewline
29 & 0.100542 & 0.9324 & 0.176873 \tabularnewline
30 & -0.012353 & -0.1146 & 0.454533 \tabularnewline
31 & -0.043433 & -0.4028 & 0.344055 \tabularnewline
32 & 0.059545 & 0.5522 & 0.291124 \tabularnewline
33 & -0.002646 & -0.0245 & 0.49024 \tabularnewline
34 & -0.058043 & -0.5383 & 0.295892 \tabularnewline
35 & 0.003907 & 0.0362 & 0.485592 \tabularnewline
36 & -0.020095 & -0.1864 & 0.426304 \tabularnewline
37 & 0.093359 & 0.8658 & 0.194512 \tabularnewline
38 & 0.015999 & 0.1484 & 0.4412 \tabularnewline
39 & -0.129523 & -1.2011 & 0.116496 \tabularnewline
40 & 0.079992 & 0.7418 & 0.23011 \tabularnewline
41 & -0.044254 & -0.4104 & 0.341267 \tabularnewline
42 & 0.040074 & 0.3716 & 0.355542 \tabularnewline
43 & 0.007993 & 0.0741 & 0.470541 \tabularnewline
44 & -0.036947 & -0.3426 & 0.366357 \tabularnewline
45 & 0.051455 & 0.4772 & 0.317226 \tabularnewline
46 & -0.048772 & -0.4523 & 0.326098 \tabularnewline
47 & 0.05928 & 0.5497 & 0.291961 \tabularnewline
48 & -0.17361 & -1.61 & 0.055532 \tabularnewline
\hline
\end{tabular}
%Source: https://freestatistics.org/blog/index.php?pk=&T=1

[TABLE]
[ROW][C]Autocorrelation Function[/C][/ROW]
[ROW][C]Time lag k[/C][C]ACF(k)[/C][C]T-STAT[/C][C]P-value[/C][/ROW]
[ROW][C]1[/C][C]-0.52403[/C][C]-4.8597[/C][C]3e-06[/C][/ROW]
[ROW][C]2[/C][C]0.027303[/C][C]0.2532[/C][C]0.400359[/C][/ROW]
[ROW][C]3[/C][C]0.063921[/C][C]0.5928[/C][C]0.277442[/C][/ROW]
[ROW][C]4[/C][C]-0.173186[/C][C]-1.6061[/C][C]0.055963[/C][/ROW]
[ROW][C]5[/C][C]0.047975[/C][C]0.4449[/C][C]0.328754[/C][/ROW]
[ROW][C]6[/C][C]0.08464[/C][C]0.7849[/C][C]0.217329[/C][/ROW]
[ROW][C]7[/C][C]0.027391[/C][C]0.254[/C][C]0.400044[/C][/ROW]
[ROW][C]8[/C][C]-0.139456[/C][C]-1.2933[/C][C]0.099692[/C][/ROW]
[ROW][C]9[/C][C]0.291529[/C][C]2.7035[/C][C]0.004134[/C][/ROW]
[ROW][C]10[/C][C]-0.313553[/C][C]-2.9078[/C][C]0.002315[/C][/ROW]
[ROW][C]11[/C][C]-0.056094[/C][C]-0.5202[/C][C]0.302134[/C][/ROW]
[ROW][C]12[/C][C]0.279251[/C][C]2.5897[/C][C]0.00564[/C][/ROW]
[ROW][C]13[/C][C]-0.059608[/C][C]-0.5528[/C][C]0.290923[/C][/ROW]
[ROW][C]14[/C][C]-0.175563[/C][C]-1.6281[/C][C]0.05358[/C][/ROW]
[ROW][C]15[/C][C]0.31357[/C][C]2.9079[/C][C]0.002314[/C][/ROW]
[ROW][C]16[/C][C]-0.326218[/C][C]-3.0252[/C][C]0.001638[/C][/ROW]
[ROW][C]17[/C][C]0.130883[/C][C]1.2138[/C][C]0.11408[/C][/ROW]
[ROW][C]18[/C][C]0.052193[/C][C]0.484[/C][C]0.3148[/C][/ROW]
[ROW][C]19[/C][C]-0.12633[/C][C]-1.1715[/C][C]0.12231[/C][/ROW]
[ROW][C]20[/C][C]0.147889[/C][C]1.3715[/C][C]0.086899[/C][/ROW]
[ROW][C]21[/C][C]-0.060574[/C][C]-0.5617[/C][C]0.287878[/C][/ROW]
[ROW][C]22[/C][C]-0.0059[/C][C]-0.0547[/C][C]0.478245[/C][/ROW]
[ROW][C]23[/C][C]-0.142923[/C][C]-1.3254[/C][C]0.094272[/C][/ROW]
[ROW][C]24[/C][C]0.253352[/C][C]2.3495[/C][C]0.010545[/C][/ROW]
[ROW][C]25[/C][C]-0.122934[/C][C]-1.14[/C][C]0.128716[/C][/ROW]
[ROW][C]26[/C][C]0.003032[/C][C]0.0281[/C][C]0.488817[/C][/ROW]
[ROW][C]27[/C][C]0.03335[/C][C]0.3093[/C][C]0.378932[/C][/ROW]
[ROW][C]28[/C][C]-0.102289[/C][C]-0.9486[/C][C]0.172744[/C][/ROW]
[ROW][C]29[/C][C]0.100542[/C][C]0.9324[/C][C]0.176873[/C][/ROW]
[ROW][C]30[/C][C]-0.012353[/C][C]-0.1146[/C][C]0.454533[/C][/ROW]
[ROW][C]31[/C][C]-0.043433[/C][C]-0.4028[/C][C]0.344055[/C][/ROW]
[ROW][C]32[/C][C]0.059545[/C][C]0.5522[/C][C]0.291124[/C][/ROW]
[ROW][C]33[/C][C]-0.002646[/C][C]-0.0245[/C][C]0.49024[/C][/ROW]
[ROW][C]34[/C][C]-0.058043[/C][C]-0.5383[/C][C]0.295892[/C][/ROW]
[ROW][C]35[/C][C]0.003907[/C][C]0.0362[/C][C]0.485592[/C][/ROW]
[ROW][C]36[/C][C]-0.020095[/C][C]-0.1864[/C][C]0.426304[/C][/ROW]
[ROW][C]37[/C][C]0.093359[/C][C]0.8658[/C][C]0.194512[/C][/ROW]
[ROW][C]38[/C][C]0.015999[/C][C]0.1484[/C][C]0.4412[/C][/ROW]
[ROW][C]39[/C][C]-0.129523[/C][C]-1.2011[/C][C]0.116496[/C][/ROW]
[ROW][C]40[/C][C]0.079992[/C][C]0.7418[/C][C]0.23011[/C][/ROW]
[ROW][C]41[/C][C]-0.044254[/C][C]-0.4104[/C][C]0.341267[/C][/ROW]
[ROW][C]42[/C][C]0.040074[/C][C]0.3716[/C][C]0.355542[/C][/ROW]
[ROW][C]43[/C][C]0.007993[/C][C]0.0741[/C][C]0.470541[/C][/ROW]
[ROW][C]44[/C][C]-0.036947[/C][C]-0.3426[/C][C]0.366357[/C][/ROW]
[ROW][C]45[/C][C]0.051455[/C][C]0.4772[/C][C]0.317226[/C][/ROW]
[ROW][C]46[/C][C]-0.048772[/C][C]-0.4523[/C][C]0.326098[/C][/ROW]
[ROW][C]47[/C][C]0.05928[/C][C]0.5497[/C][C]0.291961[/C][/ROW]
[ROW][C]48[/C][C]-0.17361[/C][C]-1.61[/C][C]0.055532[/C][/ROW]
[/TABLE]
Source: https://freestatistics.org/blog/index.php?pk=&T=1

Globally Unique Identifier (entire table): ba.freestatistics.org/blog/index.php?pk=&T=1

As an alternative you can also use a QR Code:  

The GUIDs for individual cells are displayed in the table below:

Autocorrelation Function
Time lag kACF(k)T-STATP-value
1-0.52403-4.85973e-06
20.0273030.25320.400359
30.0639210.59280.277442
4-0.173186-1.60610.055963
50.0479750.44490.328754
60.084640.78490.217329
70.0273910.2540.400044
8-0.139456-1.29330.099692
90.2915292.70350.004134
10-0.313553-2.90780.002315
11-0.056094-0.52020.302134
120.2792512.58970.00564
13-0.059608-0.55280.290923
14-0.175563-1.62810.05358
150.313572.90790.002314
16-0.326218-3.02520.001638
170.1308831.21380.11408
180.0521930.4840.3148
19-0.12633-1.17150.12231
200.1478891.37150.086899
21-0.060574-0.56170.287878
22-0.0059-0.05470.478245
23-0.142923-1.32540.094272
240.2533522.34950.010545
25-0.122934-1.140.128716
260.0030320.02810.488817
270.033350.30930.378932
28-0.102289-0.94860.172744
290.1005420.93240.176873
30-0.012353-0.11460.454533
31-0.043433-0.40280.344055
320.0595450.55220.291124
33-0.002646-0.02450.49024
34-0.058043-0.53830.295892
350.0039070.03620.485592
36-0.020095-0.18640.426304
370.0933590.86580.194512
380.0159990.14840.4412
39-0.129523-1.20110.116496
400.0799920.74180.23011
41-0.044254-0.41040.341267
420.0400740.37160.355542
430.0079930.07410.470541
44-0.036947-0.34260.366357
450.0514550.47720.317226
46-0.048772-0.45230.326098
470.059280.54970.291961
48-0.17361-1.610.055532


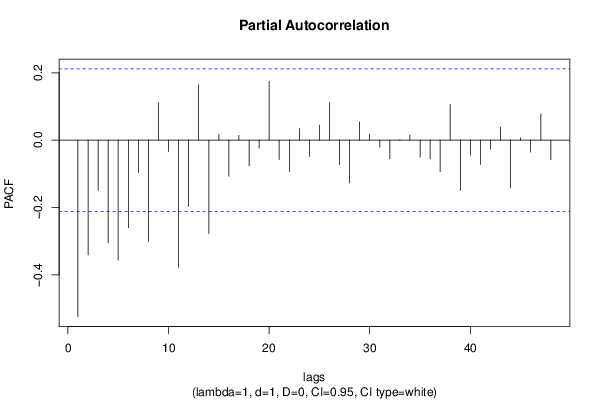
Partial Autocorrelation Function
Time lag kPACF(k)T-STATP-value
1-0.52403-4.85973e-06
2-0.340925-3.16160.001084
3-0.149043-1.38220.08525
4-0.304635-2.82510.002938
5-0.356131-3.30260.000698
6-0.259744-2.40880.009071
7-0.095993-0.89020.187921
8-0.300757-2.78910.003253
90.1110311.02970.153029
10-0.03371-0.31260.377665
11-0.377458-3.50040.000369
12-0.196798-1.8250.035734
130.1641441.52220.065813
14-0.277081-2.56950.005953
150.0164750.15280.439465
16-0.107238-0.99450.161389
170.014180.13150.447842
18-0.076189-0.70650.240879
19-0.023801-0.22070.412916
200.1749061.6220.054231
21-0.057691-0.5350.297014
22-0.092971-0.86220.195493
230.0347020.32180.374186
24-0.0482-0.4470.328005
250.0449610.41690.338878
260.1119741.03840.150996
27-0.07317-0.67860.249622
28-0.126864-1.17650.121322
290.0542460.50310.308106
300.0173330.16070.436338
31-0.021325-0.19780.421849
32-0.055098-0.5110.305345
330.0008450.00780.496884
340.0151610.14060.444259
35-0.050425-0.46760.320618
36-0.055766-0.51720.303188
37-0.093604-0.8680.193892
380.1056540.97980.164968
39-0.149711-1.38840.084307
40-0.044727-0.41480.339667
41-0.071625-0.66420.254163
42-0.027136-0.25160.400957
430.0389410.36110.359446
44-0.14179-1.31490.096019
450.0067950.0630.47495
46-0.035341-0.32770.371952
470.0779160.72260.235955
48-0.058249-0.54020.295235

\begin{tabular}{lllllllll}
\hline
Partial Autocorrelation Function \tabularnewline
Time lag k & PACF(k) & T-STAT & P-value \tabularnewline
1 & -0.52403 & -4.8597 & 3e-06 \tabularnewline
2 & -0.340925 & -3.1616 & 0.001084 \tabularnewline
3 & -0.149043 & -1.3822 & 0.08525 \tabularnewline
4 & -0.304635 & -2.8251 & 0.002938 \tabularnewline
5 & -0.356131 & -3.3026 & 0.000698 \tabularnewline
6 & -0.259744 & -2.4088 & 0.009071 \tabularnewline
7 & -0.095993 & -0.8902 & 0.187921 \tabularnewline
8 & -0.300757 & -2.7891 & 0.003253 \tabularnewline
9 & 0.111031 & 1.0297 & 0.153029 \tabularnewline
10 & -0.03371 & -0.3126 & 0.377665 \tabularnewline
11 & -0.377458 & -3.5004 & 0.000369 \tabularnewline
12 & -0.196798 & -1.825 & 0.035734 \tabularnewline
13 & 0.164144 & 1.5222 & 0.065813 \tabularnewline
14 & -0.277081 & -2.5695 & 0.005953 \tabularnewline
15 & 0.016475 & 0.1528 & 0.439465 \tabularnewline
16 & -0.107238 & -0.9945 & 0.161389 \tabularnewline
17 & 0.01418 & 0.1315 & 0.447842 \tabularnewline
18 & -0.076189 & -0.7065 & 0.240879 \tabularnewline
19 & -0.023801 & -0.2207 & 0.412916 \tabularnewline
20 & 0.174906 & 1.622 & 0.054231 \tabularnewline
21 & -0.057691 & -0.535 & 0.297014 \tabularnewline
22 & -0.092971 & -0.8622 & 0.195493 \tabularnewline
23 & 0.034702 & 0.3218 & 0.374186 \tabularnewline
24 & -0.0482 & -0.447 & 0.328005 \tabularnewline
25 & 0.044961 & 0.4169 & 0.338878 \tabularnewline
26 & 0.111974 & 1.0384 & 0.150996 \tabularnewline
27 & -0.07317 & -0.6786 & 0.249622 \tabularnewline
28 & -0.126864 & -1.1765 & 0.121322 \tabularnewline
29 & 0.054246 & 0.5031 & 0.308106 \tabularnewline
30 & 0.017333 & 0.1607 & 0.436338 \tabularnewline
31 & -0.021325 & -0.1978 & 0.421849 \tabularnewline
32 & -0.055098 & -0.511 & 0.305345 \tabularnewline
33 & 0.000845 & 0.0078 & 0.496884 \tabularnewline
34 & 0.015161 & 0.1406 & 0.444259 \tabularnewline
35 & -0.050425 & -0.4676 & 0.320618 \tabularnewline
36 & -0.055766 & -0.5172 & 0.303188 \tabularnewline
37 & -0.093604 & -0.868 & 0.193892 \tabularnewline
38 & 0.105654 & 0.9798 & 0.164968 \tabularnewline
39 & -0.149711 & -1.3884 & 0.084307 \tabularnewline
40 & -0.044727 & -0.4148 & 0.339667 \tabularnewline
41 & -0.071625 & -0.6642 & 0.254163 \tabularnewline
42 & -0.027136 & -0.2516 & 0.400957 \tabularnewline
43 & 0.038941 & 0.3611 & 0.359446 \tabularnewline
44 & -0.14179 & -1.3149 & 0.096019 \tabularnewline
45 & 0.006795 & 0.063 & 0.47495 \tabularnewline
46 & -0.035341 & -0.3277 & 0.371952 \tabularnewline
47 & 0.077916 & 0.7226 & 0.235955 \tabularnewline
48 & -0.058249 & -0.5402 & 0.295235 \tabularnewline
\hline
\end{tabular}
%Source: https://freestatistics.org/blog/index.php?pk=&T=2

[TABLE]
[ROW][C]Partial Autocorrelation Function[/C][/ROW]
[ROW][C]Time lag k[/C][C]PACF(k)[/C][C]T-STAT[/C][C]P-value[/C][/ROW]
[ROW][C]1[/C][C]-0.52403[/C][C]-4.8597[/C][C]3e-06[/C][/ROW]
[ROW][C]2[/C][C]-0.340925[/C][C]-3.1616[/C][C]0.001084[/C][/ROW]
[ROW][C]3[/C][C]-0.149043[/C][C]-1.3822[/C][C]0.08525[/C][/ROW]
[ROW][C]4[/C][C]-0.304635[/C][C]-2.8251[/C][C]0.002938[/C][/ROW]
[ROW][C]5[/C][C]-0.356131[/C][C]-3.3026[/C][C]0.000698[/C][/ROW]
[ROW][C]6[/C][C]-0.259744[/C][C]-2.4088[/C][C]0.009071[/C][/ROW]
[ROW][C]7[/C][C]-0.095993[/C][C]-0.8902[/C][C]0.187921[/C][/ROW]
[ROW][C]8[/C][C]-0.300757[/C][C]-2.7891[/C][C]0.003253[/C][/ROW]
[ROW][C]9[/C][C]0.111031[/C][C]1.0297[/C][C]0.153029[/C][/ROW]
[ROW][C]10[/C][C]-0.03371[/C][C]-0.3126[/C][C]0.377665[/C][/ROW]
[ROW][C]11[/C][C]-0.377458[/C][C]-3.5004[/C][C]0.000369[/C][/ROW]
[ROW][C]12[/C][C]-0.196798[/C][C]-1.825[/C][C]0.035734[/C][/ROW]
[ROW][C]13[/C][C]0.164144[/C][C]1.5222[/C][C]0.065813[/C][/ROW]
[ROW][C]14[/C][C]-0.277081[/C][C]-2.5695[/C][C]0.005953[/C][/ROW]
[ROW][C]15[/C][C]0.016475[/C][C]0.1528[/C][C]0.439465[/C][/ROW]
[ROW][C]16[/C][C]-0.107238[/C][C]-0.9945[/C][C]0.161389[/C][/ROW]
[ROW][C]17[/C][C]0.01418[/C][C]0.1315[/C][C]0.447842[/C][/ROW]
[ROW][C]18[/C][C]-0.076189[/C][C]-0.7065[/C][C]0.240879[/C][/ROW]
[ROW][C]19[/C][C]-0.023801[/C][C]-0.2207[/C][C]0.412916[/C][/ROW]
[ROW][C]20[/C][C]0.174906[/C][C]1.622[/C][C]0.054231[/C][/ROW]
[ROW][C]21[/C][C]-0.057691[/C][C]-0.535[/C][C]0.297014[/C][/ROW]
[ROW][C]22[/C][C]-0.092971[/C][C]-0.8622[/C][C]0.195493[/C][/ROW]
[ROW][C]23[/C][C]0.034702[/C][C]0.3218[/C][C]0.374186[/C][/ROW]
[ROW][C]24[/C][C]-0.0482[/C][C]-0.447[/C][C]0.328005[/C][/ROW]
[ROW][C]25[/C][C]0.044961[/C][C]0.4169[/C][C]0.338878[/C][/ROW]
[ROW][C]26[/C][C]0.111974[/C][C]1.0384[/C][C]0.150996[/C][/ROW]
[ROW][C]27[/C][C]-0.07317[/C][C]-0.6786[/C][C]0.249622[/C][/ROW]
[ROW][C]28[/C][C]-0.126864[/C][C]-1.1765[/C][C]0.121322[/C][/ROW]
[ROW][C]29[/C][C]0.054246[/C][C]0.5031[/C][C]0.308106[/C][/ROW]
[ROW][C]30[/C][C]0.017333[/C][C]0.1607[/C][C]0.436338[/C][/ROW]
[ROW][C]31[/C][C]-0.021325[/C][C]-0.1978[/C][C]0.421849[/C][/ROW]
[ROW][C]32[/C][C]-0.055098[/C][C]-0.511[/C][C]0.305345[/C][/ROW]
[ROW][C]33[/C][C]0.000845[/C][C]0.0078[/C][C]0.496884[/C][/ROW]
[ROW][C]34[/C][C]0.015161[/C][C]0.1406[/C][C]0.444259[/C][/ROW]
[ROW][C]35[/C][C]-0.050425[/C][C]-0.4676[/C][C]0.320618[/C][/ROW]
[ROW][C]36[/C][C]-0.055766[/C][C]-0.5172[/C][C]0.303188[/C][/ROW]
[ROW][C]37[/C][C]-0.093604[/C][C]-0.868[/C][C]0.193892[/C][/ROW]
[ROW][C]38[/C][C]0.105654[/C][C]0.9798[/C][C]0.164968[/C][/ROW]
[ROW][C]39[/C][C]-0.149711[/C][C]-1.3884[/C][C]0.084307[/C][/ROW]
[ROW][C]40[/C][C]-0.044727[/C][C]-0.4148[/C][C]0.339667[/C][/ROW]
[ROW][C]41[/C][C]-0.071625[/C][C]-0.6642[/C][C]0.254163[/C][/ROW]
[ROW][C]42[/C][C]-0.027136[/C][C]-0.2516[/C][C]0.400957[/C][/ROW]
[ROW][C]43[/C][C]0.038941[/C][C]0.3611[/C][C]0.359446[/C][/ROW]
[ROW][C]44[/C][C]-0.14179[/C][C]-1.3149[/C][C]0.096019[/C][/ROW]
[ROW][C]45[/C][C]0.006795[/C][C]0.063[/C][C]0.47495[/C][/ROW]
[ROW][C]46[/C][C]-0.035341[/C][C]-0.3277[/C][C]0.371952[/C][/ROW]
[ROW][C]47[/C][C]0.077916[/C][C]0.7226[/C][C]0.235955[/C][/ROW]
[ROW][C]48[/C][C]-0.058249[/C][C]-0.5402[/C][C]0.295235[/C][/ROW]
[/TABLE]
Source: https://freestatistics.org/blog/index.php?pk=&T=2

Globally Unique Identifier (entire table): ba.freestatistics.org/blog/index.php?pk=&T=2

As an alternative you can also use a QR Code:  

The GUIDs for individual cells are displayed in the table below:

Partial Autocorrelation Function
Time lag kPACF(k)T-STATP-value
1-0.52403-4.85973e-06
2-0.340925-3.16160.001084
3-0.149043-1.38220.08525
4-0.304635-2.82510.002938
5-0.356131-3.30260.000698
6-0.259744-2.40880.009071
7-0.095993-0.89020.187921
8-0.300757-2.78910.003253
90.1110311.02970.153029
10-0.03371-0.31260.377665
11-0.377458-3.50040.000369
12-0.196798-1.8250.035734
130.1641441.52220.065813
14-0.277081-2.56950.005953
150.0164750.15280.439465
16-0.107238-0.99450.161389
170.014180.13150.447842
18-0.076189-0.70650.240879
19-0.023801-0.22070.412916
200.1749061.6220.054231
21-0.057691-0.5350.297014
22-0.092971-0.86220.195493
230.0347020.32180.374186
24-0.0482-0.4470.328005
250.0449610.41690.338878
260.1119741.03840.150996
27-0.07317-0.67860.249622
28-0.126864-1.17650.121322
290.0542460.50310.308106
300.0173330.16070.436338
31-0.021325-0.19780.421849
32-0.055098-0.5110.305345
330.0008450.00780.496884
340.0151610.14060.444259
35-0.050425-0.46760.320618
36-0.055766-0.51720.303188
37-0.093604-0.8680.193892
380.1056540.97980.164968
39-0.149711-1.38840.084307
40-0.044727-0.41480.339667
41-0.071625-0.66420.254163
42-0.027136-0.25160.400957
430.0389410.36110.359446
44-0.14179-1.31490.096019
450.0067950.0630.47495
46-0.035341-0.32770.371952
470.0779160.72260.235955
48-0.058249-0.54020.295235


Parameters (Session):
par1 = 48 ; par2 = 1 ; par3 = 1 ; par4 = 0 ; par5 = 12 ; par6 = White Noise ; par7 = 0.95 ;
Parameters (R input):
par1 = 48 ; par2 = 1 ; par3 = 1 ; par4 = 0 ; par5 = 12 ; par6 = White Noise ; par7 = 0.95 ; par8 = ;
R code (references can be found in the software module):
if (par1 == 'Default') {
par1 = 10*log10(length(x))
} else {
par1 <- as.numeric(par1)
}
par2 <- as.numeric(par2)
par3 <- as.numeric(par3)
par4 <- as.numeric(par4)
par5 <- as.numeric(par5)
if (par6 == 'White Noise') par6 <- 'white' else par6 <- 'ma'
par7 <- as.numeric(par7)
if (par8 != '') par8 <- as.numeric(par8)
x <- na.omit(x)
ox <- x
if (par8 == '') {
if (par2 == 0) {
x <- log(x)
} else {
x <- (x ^ par2 - 1) / par2
}
} else {
x <- log(x,base=par8)
}
if (par3 > 0) x <- diff(x,lag=1,difference=par3)
if (par4 > 0) x <- diff(x,lag=par5,difference=par4)
bitmap(file='picts.png')
op <- par(mfrow=c(2,1))
plot(ox,type='l',main='Original Time Series',xlab='time',ylab='value')
if (par8=='') {
mytitle <- paste('Working Time Series (lambda=',par2,', d=',par3,', D=',par4,')',sep='')
mysub <- paste('(lambda=',par2,', d=',par3,', D=',par4,', CI=', par7, ', CI type=',par6,')',sep='')
} else {
mytitle <- paste('Working Time Series (base=',par8,', d=',par3,', D=',par4,')',sep='')
mysub <- paste('(base=',par8,', d=',par3,', D=',par4,', CI=', par7, ', CI type=',par6,')',sep='')
}
plot(x,type='l', main=mytitle,xlab='time',ylab='value')
par(op)
dev.off()
bitmap(file='pic1.png')
racf <- acf(x, par1, main='Autocorrelation', xlab='time lag', ylab='ACF', ci.type=par6, ci=par7, sub=mysub)
dev.off()
bitmap(file='pic2.png')
rpacf <- pacf(x,par1,main='Partial Autocorrelation',xlab='lags',ylab='PACF',sub=mysub)
dev.off()
(myacf <- c(racf$acf))
(mypacf <- c(rpacf$acf))
lengthx <- length(x)
sqrtn <- sqrt(lengthx)
load(file='createtable')
a<-table.start()
a<-table.row.start(a)
a<-table.element(a,'Autocorrelation Function',4,TRUE)
a<-table.row.end(a)
a<-table.row.start(a)
a<-table.element(a,'Time lag k',header=TRUE)
a<-table.element(a,hyperlink('basics.htm','ACF(k)','click here for more information about the Autocorrelation Function'),header=TRUE)
a<-table.element(a,'T-STAT',header=TRUE)
a<-table.element(a,'P-value',header=TRUE)
a<-table.row.end(a)
for (i in 2:(par1+1)) {
a<-table.row.start(a)
a<-table.element(a,i-1,header=TRUE)
a<-table.element(a,round(myacf[i],6))
mytstat <- myacf[i]*sqrtn
a<-table.element(a,round(mytstat,4))
a<-table.element(a,round(1-pt(abs(mytstat),lengthx),6))
a<-table.row.end(a)
}
a<-table.end(a)
table.save(a,file='mytable.tab')
a<-table.start()
a<-table.row.start(a)
a<-table.element(a,'Partial Autocorrelation Function',4,TRUE)
a<-table.row.end(a)
a<-table.row.start(a)
a<-table.element(a,'Time lag k',header=TRUE)
a<-table.element(a,hyperlink('basics.htm','PACF(k)','click here for more information about the Partial Autocorrelation Function'),header=TRUE)
a<-table.element(a,'T-STAT',header=TRUE)
a<-table.element(a,'P-value',header=TRUE)
a<-table.row.end(a)
for (i in 1:par1) {
a<-table.row.start(a)
a<-table.element(a,i,header=TRUE)
a<-table.element(a,round(mypacf[i],6))
mytstat <- mypacf[i]*sqrtn
a<-table.element(a,round(mytstat,4))
a<-table.element(a,round(1-pt(abs(mytstat),lengthx),6))
a<-table.row.end(a)
}
a<-table.end(a)
table.save(a,file='mytable1.tab')