Free Statistics

of Irreproducible Research!

Author's title

Author*Unverified author*
R Software Modulerwasp_autocorrelation.wasp
Title produced by software(Partial) Autocorrelation Function
Date of computationTue, 18 Oct 2016 12:40:33 +0100
Cite this page as followsStatistical Computations at FreeStatistics.org, Office for Research Development and Education, URL https://freestatistics.org/blog/index.php?v=date/2016/Oct/18/t147679092623tepo0y5xmz4t8.htm/, Retrieved Sun, 28 Apr 2024 09:14:02 +0200
Statistical Computations at FreeStatistics.org, Office for Research Development and Education, URL https://freestatistics.org/blog/index.php?pk=, Retrieved Sun, 28 Apr 2024 09:14:02 +0200
QR Codes:

Original text written by user:
IsPrivate?No (this computation is public)
User-defined keywords
Estimated Impact0
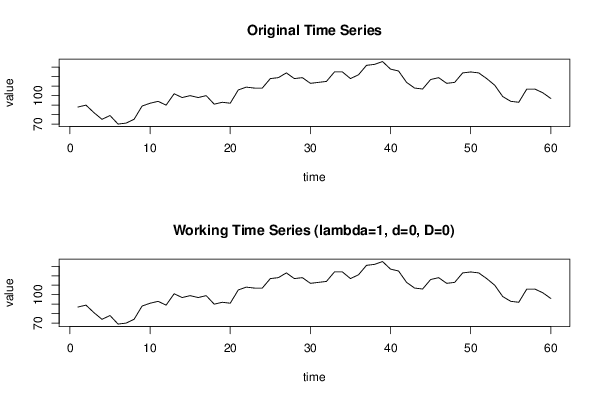
Dataseries X:
88
90
82
75
79
70
71
75
89
92
94
90
102
98
100
98
100
91
93
92
106
109
108
108
118
119
124
118
119
113
114
115
125
125
118
122
132
133
136
128
126
114
108
107
117
119
113
114
124
125
124
118
111
99
94
93
107
107
103
97


Summary of computational transaction
Raw Inputview raw input (R code)
Raw Outputview raw output of R engine
Computing time2 seconds
R Server'Gwilym Jenkins' @ jenkins.wessa.net

\begin{tabular}{lllllllll}
\hline
Summary of computational transaction \tabularnewline
Raw Input & view raw input (R code)  \tabularnewline
Raw Output & view raw output of R engine  \tabularnewline
Computing time & 2 seconds \tabularnewline
R Server & 'Gwilym Jenkins' @ jenkins.wessa.net \tabularnewline
\hline
\end{tabular}
%Source: https://freestatistics.org/blog/index.php?pk=&T=0

[TABLE]
[ROW][C]Summary of computational transaction[/C][/ROW]
[ROW][C]Raw Input[/C][C]view raw input (R code) [/C][/ROW]
[ROW][C]Raw Output[/C][C]view raw output of R engine [/C][/ROW]
[ROW][C]Computing time[/C][C]2 seconds[/C][/ROW]
[ROW][C]R Server[/C][C]'Gwilym Jenkins' @ jenkins.wessa.net[/C][/ROW]
[/TABLE]
Source: https://freestatistics.org/blog/index.php?pk=&T=0

Globally Unique Identifier (entire table): ba.freestatistics.org/blog/index.php?pk=&T=0

As an alternative you can also use a QR Code:  

The GUIDs for individual cells are displayed in the table below:

Summary of computational transaction
Raw Inputview raw input (R code)
Raw Outputview raw output of R engine
Computing time2 seconds
R Server'Gwilym Jenkins' @ jenkins.wessa.net


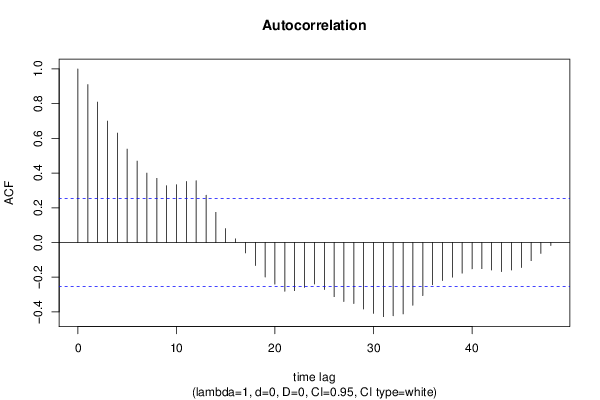
Autocorrelation Function
Time lag kACF(k)T-STATP-value
10.9097667.0470
20.8089836.26640
30.6992655.41651e-06
40.6301394.8814e-06
50.5382954.16965e-05
60.469063.63330.000291
70.399693.0960.00149
80.3695192.86230.002892
90.3272662.5350.006935
100.3329862.57930.006184
110.3516612.7240.004219
120.3555442.7540.00389
130.2720982.10770.019624
140.1736041.34470.091887
150.0798920.61880.269183
160.0211230.16360.435292
17-0.059812-0.46330.322413
18-0.132249-1.02440.154881
19-0.199263-1.54350.063986
20-0.239817-1.85760.034066
21-0.281009-2.17670.016725
22-0.277458-2.14920.017832
23-0.258593-2.00310.024847
24-0.239043-1.85160.034501
25-0.271132-2.10020.019963
26-0.311814-2.41530.009393
27-0.340192-2.63510.005344
28-0.351243-2.72070.004255
29-0.383326-2.96920.002143
30-0.408622-3.16520.001217
31-0.427312-3.30990.000791
32-0.421868-3.26780.000898
33-0.411558-3.18790.001139
34-0.361548-2.80050.003428
35-0.306007-2.37030.010502
36-0.243863-1.8890.031867
37-0.218604-1.69330.047793
38-0.199739-1.54720.06354
39-0.176559-1.36760.088266
40-0.151871-1.17640.122043
41-0.150601-1.16650.124004
42-0.158086-1.22450.11277
43-0.167722-1.29920.099428
44-0.158785-1.22990.11176
45-0.144618-1.12020.133545
46-0.104582-0.81010.210545
47-0.062592-0.48480.314779
48-0.016908-0.1310.448119

\begin{tabular}{lllllllll}
\hline
Autocorrelation Function \tabularnewline
Time lag k & ACF(k) & T-STAT & P-value \tabularnewline
1 & 0.909766 & 7.047 & 0 \tabularnewline
2 & 0.808983 & 6.2664 & 0 \tabularnewline
3 & 0.699265 & 5.4165 & 1e-06 \tabularnewline
4 & 0.630139 & 4.881 & 4e-06 \tabularnewline
5 & 0.538295 & 4.1696 & 5e-05 \tabularnewline
6 & 0.46906 & 3.6333 & 0.000291 \tabularnewline
7 & 0.39969 & 3.096 & 0.00149 \tabularnewline
8 & 0.369519 & 2.8623 & 0.002892 \tabularnewline
9 & 0.327266 & 2.535 & 0.006935 \tabularnewline
10 & 0.332986 & 2.5793 & 0.006184 \tabularnewline
11 & 0.351661 & 2.724 & 0.004219 \tabularnewline
12 & 0.355544 & 2.754 & 0.00389 \tabularnewline
13 & 0.272098 & 2.1077 & 0.019624 \tabularnewline
14 & 0.173604 & 1.3447 & 0.091887 \tabularnewline
15 & 0.079892 & 0.6188 & 0.269183 \tabularnewline
16 & 0.021123 & 0.1636 & 0.435292 \tabularnewline
17 & -0.059812 & -0.4633 & 0.322413 \tabularnewline
18 & -0.132249 & -1.0244 & 0.154881 \tabularnewline
19 & -0.199263 & -1.5435 & 0.063986 \tabularnewline
20 & -0.239817 & -1.8576 & 0.034066 \tabularnewline
21 & -0.281009 & -2.1767 & 0.016725 \tabularnewline
22 & -0.277458 & -2.1492 & 0.017832 \tabularnewline
23 & -0.258593 & -2.0031 & 0.024847 \tabularnewline
24 & -0.239043 & -1.8516 & 0.034501 \tabularnewline
25 & -0.271132 & -2.1002 & 0.019963 \tabularnewline
26 & -0.311814 & -2.4153 & 0.009393 \tabularnewline
27 & -0.340192 & -2.6351 & 0.005344 \tabularnewline
28 & -0.351243 & -2.7207 & 0.004255 \tabularnewline
29 & -0.383326 & -2.9692 & 0.002143 \tabularnewline
30 & -0.408622 & -3.1652 & 0.001217 \tabularnewline
31 & -0.427312 & -3.3099 & 0.000791 \tabularnewline
32 & -0.421868 & -3.2678 & 0.000898 \tabularnewline
33 & -0.411558 & -3.1879 & 0.001139 \tabularnewline
34 & -0.361548 & -2.8005 & 0.003428 \tabularnewline
35 & -0.306007 & -2.3703 & 0.010502 \tabularnewline
36 & -0.243863 & -1.889 & 0.031867 \tabularnewline
37 & -0.218604 & -1.6933 & 0.047793 \tabularnewline
38 & -0.199739 & -1.5472 & 0.06354 \tabularnewline
39 & -0.176559 & -1.3676 & 0.088266 \tabularnewline
40 & -0.151871 & -1.1764 & 0.122043 \tabularnewline
41 & -0.150601 & -1.1665 & 0.124004 \tabularnewline
42 & -0.158086 & -1.2245 & 0.11277 \tabularnewline
43 & -0.167722 & -1.2992 & 0.099428 \tabularnewline
44 & -0.158785 & -1.2299 & 0.11176 \tabularnewline
45 & -0.144618 & -1.1202 & 0.133545 \tabularnewline
46 & -0.104582 & -0.8101 & 0.210545 \tabularnewline
47 & -0.062592 & -0.4848 & 0.314779 \tabularnewline
48 & -0.016908 & -0.131 & 0.448119 \tabularnewline
\hline
\end{tabular}
%Source: https://freestatistics.org/blog/index.php?pk=&T=1

[TABLE]
[ROW][C]Autocorrelation Function[/C][/ROW]
[ROW][C]Time lag k[/C][C]ACF(k)[/C][C]T-STAT[/C][C]P-value[/C][/ROW]
[ROW][C]1[/C][C]0.909766[/C][C]7.047[/C][C]0[/C][/ROW]
[ROW][C]2[/C][C]0.808983[/C][C]6.2664[/C][C]0[/C][/ROW]
[ROW][C]3[/C][C]0.699265[/C][C]5.4165[/C][C]1e-06[/C][/ROW]
[ROW][C]4[/C][C]0.630139[/C][C]4.881[/C][C]4e-06[/C][/ROW]
[ROW][C]5[/C][C]0.538295[/C][C]4.1696[/C][C]5e-05[/C][/ROW]
[ROW][C]6[/C][C]0.46906[/C][C]3.6333[/C][C]0.000291[/C][/ROW]
[ROW][C]7[/C][C]0.39969[/C][C]3.096[/C][C]0.00149[/C][/ROW]
[ROW][C]8[/C][C]0.369519[/C][C]2.8623[/C][C]0.002892[/C][/ROW]
[ROW][C]9[/C][C]0.327266[/C][C]2.535[/C][C]0.006935[/C][/ROW]
[ROW][C]10[/C][C]0.332986[/C][C]2.5793[/C][C]0.006184[/C][/ROW]
[ROW][C]11[/C][C]0.351661[/C][C]2.724[/C][C]0.004219[/C][/ROW]
[ROW][C]12[/C][C]0.355544[/C][C]2.754[/C][C]0.00389[/C][/ROW]
[ROW][C]13[/C][C]0.272098[/C][C]2.1077[/C][C]0.019624[/C][/ROW]
[ROW][C]14[/C][C]0.173604[/C][C]1.3447[/C][C]0.091887[/C][/ROW]
[ROW][C]15[/C][C]0.079892[/C][C]0.6188[/C][C]0.269183[/C][/ROW]
[ROW][C]16[/C][C]0.021123[/C][C]0.1636[/C][C]0.435292[/C][/ROW]
[ROW][C]17[/C][C]-0.059812[/C][C]-0.4633[/C][C]0.322413[/C][/ROW]
[ROW][C]18[/C][C]-0.132249[/C][C]-1.0244[/C][C]0.154881[/C][/ROW]
[ROW][C]19[/C][C]-0.199263[/C][C]-1.5435[/C][C]0.063986[/C][/ROW]
[ROW][C]20[/C][C]-0.239817[/C][C]-1.8576[/C][C]0.034066[/C][/ROW]
[ROW][C]21[/C][C]-0.281009[/C][C]-2.1767[/C][C]0.016725[/C][/ROW]
[ROW][C]22[/C][C]-0.277458[/C][C]-2.1492[/C][C]0.017832[/C][/ROW]
[ROW][C]23[/C][C]-0.258593[/C][C]-2.0031[/C][C]0.024847[/C][/ROW]
[ROW][C]24[/C][C]-0.239043[/C][C]-1.8516[/C][C]0.034501[/C][/ROW]
[ROW][C]25[/C][C]-0.271132[/C][C]-2.1002[/C][C]0.019963[/C][/ROW]
[ROW][C]26[/C][C]-0.311814[/C][C]-2.4153[/C][C]0.009393[/C][/ROW]
[ROW][C]27[/C][C]-0.340192[/C][C]-2.6351[/C][C]0.005344[/C][/ROW]
[ROW][C]28[/C][C]-0.351243[/C][C]-2.7207[/C][C]0.004255[/C][/ROW]
[ROW][C]29[/C][C]-0.383326[/C][C]-2.9692[/C][C]0.002143[/C][/ROW]
[ROW][C]30[/C][C]-0.408622[/C][C]-3.1652[/C][C]0.001217[/C][/ROW]
[ROW][C]31[/C][C]-0.427312[/C][C]-3.3099[/C][C]0.000791[/C][/ROW]
[ROW][C]32[/C][C]-0.421868[/C][C]-3.2678[/C][C]0.000898[/C][/ROW]
[ROW][C]33[/C][C]-0.411558[/C][C]-3.1879[/C][C]0.001139[/C][/ROW]
[ROW][C]34[/C][C]-0.361548[/C][C]-2.8005[/C][C]0.003428[/C][/ROW]
[ROW][C]35[/C][C]-0.306007[/C][C]-2.3703[/C][C]0.010502[/C][/ROW]
[ROW][C]36[/C][C]-0.243863[/C][C]-1.889[/C][C]0.031867[/C][/ROW]
[ROW][C]37[/C][C]-0.218604[/C][C]-1.6933[/C][C]0.047793[/C][/ROW]
[ROW][C]38[/C][C]-0.199739[/C][C]-1.5472[/C][C]0.06354[/C][/ROW]
[ROW][C]39[/C][C]-0.176559[/C][C]-1.3676[/C][C]0.088266[/C][/ROW]
[ROW][C]40[/C][C]-0.151871[/C][C]-1.1764[/C][C]0.122043[/C][/ROW]
[ROW][C]41[/C][C]-0.150601[/C][C]-1.1665[/C][C]0.124004[/C][/ROW]
[ROW][C]42[/C][C]-0.158086[/C][C]-1.2245[/C][C]0.11277[/C][/ROW]
[ROW][C]43[/C][C]-0.167722[/C][C]-1.2992[/C][C]0.099428[/C][/ROW]
[ROW][C]44[/C][C]-0.158785[/C][C]-1.2299[/C][C]0.11176[/C][/ROW]
[ROW][C]45[/C][C]-0.144618[/C][C]-1.1202[/C][C]0.133545[/C][/ROW]
[ROW][C]46[/C][C]-0.104582[/C][C]-0.8101[/C][C]0.210545[/C][/ROW]
[ROW][C]47[/C][C]-0.062592[/C][C]-0.4848[/C][C]0.314779[/C][/ROW]
[ROW][C]48[/C][C]-0.016908[/C][C]-0.131[/C][C]0.448119[/C][/ROW]
[/TABLE]
Source: https://freestatistics.org/blog/index.php?pk=&T=1

Globally Unique Identifier (entire table): ba.freestatistics.org/blog/index.php?pk=&T=1

As an alternative you can also use a QR Code:  

The GUIDs for individual cells are displayed in the table below:

Autocorrelation Function
Time lag kACF(k)T-STATP-value
10.9097667.0470
20.8089836.26640
30.6992655.41651e-06
40.6301394.8814e-06
50.5382954.16965e-05
60.469063.63330.000291
70.399693.0960.00149
80.3695192.86230.002892
90.3272662.5350.006935
100.3329862.57930.006184
110.3516612.7240.004219
120.3555442.7540.00389
130.2720982.10770.019624
140.1736041.34470.091887
150.0798920.61880.269183
160.0211230.16360.435292
17-0.059812-0.46330.322413
18-0.132249-1.02440.154881
19-0.199263-1.54350.063986
20-0.239817-1.85760.034066
21-0.281009-2.17670.016725
22-0.277458-2.14920.017832
23-0.258593-2.00310.024847
24-0.239043-1.85160.034501
25-0.271132-2.10020.019963
26-0.311814-2.41530.009393
27-0.340192-2.63510.005344
28-0.351243-2.72070.004255
29-0.383326-2.96920.002143
30-0.408622-3.16520.001217
31-0.427312-3.30990.000791
32-0.421868-3.26780.000898
33-0.411558-3.18790.001139
34-0.361548-2.80050.003428
35-0.306007-2.37030.010502
36-0.243863-1.8890.031867
37-0.218604-1.69330.047793
38-0.199739-1.54720.06354
39-0.176559-1.36760.088266
40-0.151871-1.17640.122043
41-0.150601-1.16650.124004
42-0.158086-1.22450.11277
43-0.167722-1.29920.099428
44-0.158785-1.22990.11176
45-0.144618-1.12020.133545
46-0.104582-0.81010.210545
47-0.062592-0.48480.314779
48-0.016908-0.1310.448119


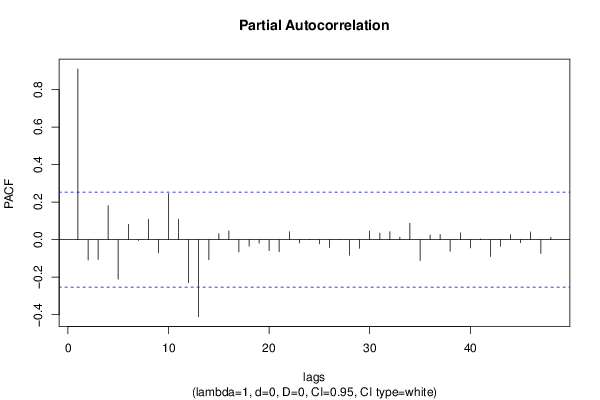
Partial Autocorrelation Function
Time lag kPACF(k)T-STATP-value
10.9097667.0470
2-0.108471-0.84020.202062
3-0.104933-0.81280.209771
40.1812961.40430.082691
5-0.21045-1.63010.054156
60.081730.63310.264545
7-0.004186-0.03240.487121
80.1091490.84550.200605
9-0.070007-0.54230.29482
100.2445831.89450.031488
110.1088780.84340.201187
12-0.228891-1.7730.040653
13-0.410184-3.17730.001175
14-0.107175-0.83020.204865
150.0319160.24720.402792
160.0461450.35740.361011
17-0.065063-0.5040.308063
18-0.035163-0.27240.393136
19-0.018603-0.14410.442954
20-0.058223-0.4510.326809
21-0.064828-0.50220.308698
220.0426250.33020.37121
23-0.017188-0.13310.447265
240.0006670.00520.497947
25-0.022538-0.17460.431
26-0.041597-0.32220.374209
27-0.000524-0.00410.498388
28-0.082326-0.63770.26305
29-0.045563-0.35290.362689
300.0459850.35620.361471
310.035170.27240.393115
320.0424410.32870.371745
330.0128990.09990.460373
340.0879020.68090.249281
35-0.111398-0.86290.195819
360.0253930.19670.422368
370.027050.20950.417374
38-0.061742-0.47830.317105
390.0361520.280.390209
40-0.04387-0.33980.36759
410.0039350.03050.487892
42-0.089442-0.69280.245549
43-0.035066-0.27160.393422
440.0270430.20950.417394
45-0.015659-0.12130.451932
460.0410760.31820.375729
47-0.072916-0.56480.287155
480.0126150.09770.461241

\begin{tabular}{lllllllll}
\hline
Partial Autocorrelation Function \tabularnewline
Time lag k & PACF(k) & T-STAT & P-value \tabularnewline
1 & 0.909766 & 7.047 & 0 \tabularnewline
2 & -0.108471 & -0.8402 & 0.202062 \tabularnewline
3 & -0.104933 & -0.8128 & 0.209771 \tabularnewline
4 & 0.181296 & 1.4043 & 0.082691 \tabularnewline
5 & -0.21045 & -1.6301 & 0.054156 \tabularnewline
6 & 0.08173 & 0.6331 & 0.264545 \tabularnewline
7 & -0.004186 & -0.0324 & 0.487121 \tabularnewline
8 & 0.109149 & 0.8455 & 0.200605 \tabularnewline
9 & -0.070007 & -0.5423 & 0.29482 \tabularnewline
10 & 0.244583 & 1.8945 & 0.031488 \tabularnewline
11 & 0.108878 & 0.8434 & 0.201187 \tabularnewline
12 & -0.228891 & -1.773 & 0.040653 \tabularnewline
13 & -0.410184 & -3.1773 & 0.001175 \tabularnewline
14 & -0.107175 & -0.8302 & 0.204865 \tabularnewline
15 & 0.031916 & 0.2472 & 0.402792 \tabularnewline
16 & 0.046145 & 0.3574 & 0.361011 \tabularnewline
17 & -0.065063 & -0.504 & 0.308063 \tabularnewline
18 & -0.035163 & -0.2724 & 0.393136 \tabularnewline
19 & -0.018603 & -0.1441 & 0.442954 \tabularnewline
20 & -0.058223 & -0.451 & 0.326809 \tabularnewline
21 & -0.064828 & -0.5022 & 0.308698 \tabularnewline
22 & 0.042625 & 0.3302 & 0.37121 \tabularnewline
23 & -0.017188 & -0.1331 & 0.447265 \tabularnewline
24 & 0.000667 & 0.0052 & 0.497947 \tabularnewline
25 & -0.022538 & -0.1746 & 0.431 \tabularnewline
26 & -0.041597 & -0.3222 & 0.374209 \tabularnewline
27 & -0.000524 & -0.0041 & 0.498388 \tabularnewline
28 & -0.082326 & -0.6377 & 0.26305 \tabularnewline
29 & -0.045563 & -0.3529 & 0.362689 \tabularnewline
30 & 0.045985 & 0.3562 & 0.361471 \tabularnewline
31 & 0.03517 & 0.2724 & 0.393115 \tabularnewline
32 & 0.042441 & 0.3287 & 0.371745 \tabularnewline
33 & 0.012899 & 0.0999 & 0.460373 \tabularnewline
34 & 0.087902 & 0.6809 & 0.249281 \tabularnewline
35 & -0.111398 & -0.8629 & 0.195819 \tabularnewline
36 & 0.025393 & 0.1967 & 0.422368 \tabularnewline
37 & 0.02705 & 0.2095 & 0.417374 \tabularnewline
38 & -0.061742 & -0.4783 & 0.317105 \tabularnewline
39 & 0.036152 & 0.28 & 0.390209 \tabularnewline
40 & -0.04387 & -0.3398 & 0.36759 \tabularnewline
41 & 0.003935 & 0.0305 & 0.487892 \tabularnewline
42 & -0.089442 & -0.6928 & 0.245549 \tabularnewline
43 & -0.035066 & -0.2716 & 0.393422 \tabularnewline
44 & 0.027043 & 0.2095 & 0.417394 \tabularnewline
45 & -0.015659 & -0.1213 & 0.451932 \tabularnewline
46 & 0.041076 & 0.3182 & 0.375729 \tabularnewline
47 & -0.072916 & -0.5648 & 0.287155 \tabularnewline
48 & 0.012615 & 0.0977 & 0.461241 \tabularnewline
\hline
\end{tabular}
%Source: https://freestatistics.org/blog/index.php?pk=&T=2

[TABLE]
[ROW][C]Partial Autocorrelation Function[/C][/ROW]
[ROW][C]Time lag k[/C][C]PACF(k)[/C][C]T-STAT[/C][C]P-value[/C][/ROW]
[ROW][C]1[/C][C]0.909766[/C][C]7.047[/C][C]0[/C][/ROW]
[ROW][C]2[/C][C]-0.108471[/C][C]-0.8402[/C][C]0.202062[/C][/ROW]
[ROW][C]3[/C][C]-0.104933[/C][C]-0.8128[/C][C]0.209771[/C][/ROW]
[ROW][C]4[/C][C]0.181296[/C][C]1.4043[/C][C]0.082691[/C][/ROW]
[ROW][C]5[/C][C]-0.21045[/C][C]-1.6301[/C][C]0.054156[/C][/ROW]
[ROW][C]6[/C][C]0.08173[/C][C]0.6331[/C][C]0.264545[/C][/ROW]
[ROW][C]7[/C][C]-0.004186[/C][C]-0.0324[/C][C]0.487121[/C][/ROW]
[ROW][C]8[/C][C]0.109149[/C][C]0.8455[/C][C]0.200605[/C][/ROW]
[ROW][C]9[/C][C]-0.070007[/C][C]-0.5423[/C][C]0.29482[/C][/ROW]
[ROW][C]10[/C][C]0.244583[/C][C]1.8945[/C][C]0.031488[/C][/ROW]
[ROW][C]11[/C][C]0.108878[/C][C]0.8434[/C][C]0.201187[/C][/ROW]
[ROW][C]12[/C][C]-0.228891[/C][C]-1.773[/C][C]0.040653[/C][/ROW]
[ROW][C]13[/C][C]-0.410184[/C][C]-3.1773[/C][C]0.001175[/C][/ROW]
[ROW][C]14[/C][C]-0.107175[/C][C]-0.8302[/C][C]0.204865[/C][/ROW]
[ROW][C]15[/C][C]0.031916[/C][C]0.2472[/C][C]0.402792[/C][/ROW]
[ROW][C]16[/C][C]0.046145[/C][C]0.3574[/C][C]0.361011[/C][/ROW]
[ROW][C]17[/C][C]-0.065063[/C][C]-0.504[/C][C]0.308063[/C][/ROW]
[ROW][C]18[/C][C]-0.035163[/C][C]-0.2724[/C][C]0.393136[/C][/ROW]
[ROW][C]19[/C][C]-0.018603[/C][C]-0.1441[/C][C]0.442954[/C][/ROW]
[ROW][C]20[/C][C]-0.058223[/C][C]-0.451[/C][C]0.326809[/C][/ROW]
[ROW][C]21[/C][C]-0.064828[/C][C]-0.5022[/C][C]0.308698[/C][/ROW]
[ROW][C]22[/C][C]0.042625[/C][C]0.3302[/C][C]0.37121[/C][/ROW]
[ROW][C]23[/C][C]-0.017188[/C][C]-0.1331[/C][C]0.447265[/C][/ROW]
[ROW][C]24[/C][C]0.000667[/C][C]0.0052[/C][C]0.497947[/C][/ROW]
[ROW][C]25[/C][C]-0.022538[/C][C]-0.1746[/C][C]0.431[/C][/ROW]
[ROW][C]26[/C][C]-0.041597[/C][C]-0.3222[/C][C]0.374209[/C][/ROW]
[ROW][C]27[/C][C]-0.000524[/C][C]-0.0041[/C][C]0.498388[/C][/ROW]
[ROW][C]28[/C][C]-0.082326[/C][C]-0.6377[/C][C]0.26305[/C][/ROW]
[ROW][C]29[/C][C]-0.045563[/C][C]-0.3529[/C][C]0.362689[/C][/ROW]
[ROW][C]30[/C][C]0.045985[/C][C]0.3562[/C][C]0.361471[/C][/ROW]
[ROW][C]31[/C][C]0.03517[/C][C]0.2724[/C][C]0.393115[/C][/ROW]
[ROW][C]32[/C][C]0.042441[/C][C]0.3287[/C][C]0.371745[/C][/ROW]
[ROW][C]33[/C][C]0.012899[/C][C]0.0999[/C][C]0.460373[/C][/ROW]
[ROW][C]34[/C][C]0.087902[/C][C]0.6809[/C][C]0.249281[/C][/ROW]
[ROW][C]35[/C][C]-0.111398[/C][C]-0.8629[/C][C]0.195819[/C][/ROW]
[ROW][C]36[/C][C]0.025393[/C][C]0.1967[/C][C]0.422368[/C][/ROW]
[ROW][C]37[/C][C]0.02705[/C][C]0.2095[/C][C]0.417374[/C][/ROW]
[ROW][C]38[/C][C]-0.061742[/C][C]-0.4783[/C][C]0.317105[/C][/ROW]
[ROW][C]39[/C][C]0.036152[/C][C]0.28[/C][C]0.390209[/C][/ROW]
[ROW][C]40[/C][C]-0.04387[/C][C]-0.3398[/C][C]0.36759[/C][/ROW]
[ROW][C]41[/C][C]0.003935[/C][C]0.0305[/C][C]0.487892[/C][/ROW]
[ROW][C]42[/C][C]-0.089442[/C][C]-0.6928[/C][C]0.245549[/C][/ROW]
[ROW][C]43[/C][C]-0.035066[/C][C]-0.2716[/C][C]0.393422[/C][/ROW]
[ROW][C]44[/C][C]0.027043[/C][C]0.2095[/C][C]0.417394[/C][/ROW]
[ROW][C]45[/C][C]-0.015659[/C][C]-0.1213[/C][C]0.451932[/C][/ROW]
[ROW][C]46[/C][C]0.041076[/C][C]0.3182[/C][C]0.375729[/C][/ROW]
[ROW][C]47[/C][C]-0.072916[/C][C]-0.5648[/C][C]0.287155[/C][/ROW]
[ROW][C]48[/C][C]0.012615[/C][C]0.0977[/C][C]0.461241[/C][/ROW]
[/TABLE]
Source: https://freestatistics.org/blog/index.php?pk=&T=2

Globally Unique Identifier (entire table): ba.freestatistics.org/blog/index.php?pk=&T=2

As an alternative you can also use a QR Code:  

The GUIDs for individual cells are displayed in the table below:

Partial Autocorrelation Function
Time lag kPACF(k)T-STATP-value
10.9097667.0470
2-0.108471-0.84020.202062
3-0.104933-0.81280.209771
40.1812961.40430.082691
5-0.21045-1.63010.054156
60.081730.63310.264545
7-0.004186-0.03240.487121
80.1091490.84550.200605
9-0.070007-0.54230.29482
100.2445831.89450.031488
110.1088780.84340.201187
12-0.228891-1.7730.040653
13-0.410184-3.17730.001175
14-0.107175-0.83020.204865
150.0319160.24720.402792
160.0461450.35740.361011
17-0.065063-0.5040.308063
18-0.035163-0.27240.393136
19-0.018603-0.14410.442954
20-0.058223-0.4510.326809
21-0.064828-0.50220.308698
220.0426250.33020.37121
23-0.017188-0.13310.447265
240.0006670.00520.497947
25-0.022538-0.17460.431
26-0.041597-0.32220.374209
27-0.000524-0.00410.498388
28-0.082326-0.63770.26305
29-0.045563-0.35290.362689
300.0459850.35620.361471
310.035170.27240.393115
320.0424410.32870.371745
330.0128990.09990.460373
340.0879020.68090.249281
35-0.111398-0.86290.195819
360.0253930.19670.422368
370.027050.20950.417374
38-0.061742-0.47830.317105
390.0361520.280.390209
40-0.04387-0.33980.36759
410.0039350.03050.487892
42-0.089442-0.69280.245549
43-0.035066-0.27160.393422
440.0270430.20950.417394
45-0.015659-0.12130.451932
460.0410760.31820.375729
47-0.072916-0.56480.287155
480.0126150.09770.461241


Parameters (Session):
par1 = 48 ; par2 = 1 ; par3 = 1 ; par4 = 0 ; par5 = 12 ; par6 = White Noise ; par7 = 0.95 ;
Parameters (R input):
par1 = 48 ; par2 = 1 ; par3 = 0 ; par4 = 0 ; par5 = 12 ; par6 = White Noise ; par7 = 0.95 ; par8 = ;
R code (references can be found in the software module):
if (par1 == 'Default') {
par1 = 10*log10(length(x))
} else {
par1 <- as.numeric(par1)
}
par2 <- as.numeric(par2)
par3 <- as.numeric(par3)
par4 <- as.numeric(par4)
par5 <- as.numeric(par5)
if (par6 == 'White Noise') par6 <- 'white' else par6 <- 'ma'
par7 <- as.numeric(par7)
if (par8 != '') par8 <- as.numeric(par8)
x <- na.omit(x)
ox <- x
if (par8 == '') {
if (par2 == 0) {
x <- log(x)
} else {
x <- (x ^ par2 - 1) / par2
}
} else {
x <- log(x,base=par8)
}
if (par3 > 0) x <- diff(x,lag=1,difference=par3)
if (par4 > 0) x <- diff(x,lag=par5,difference=par4)
bitmap(file='picts.png')
op <- par(mfrow=c(2,1))
plot(ox,type='l',main='Original Time Series',xlab='time',ylab='value')
if (par8=='') {
mytitle <- paste('Working Time Series (lambda=',par2,', d=',par3,', D=',par4,')',sep='')
mysub <- paste('(lambda=',par2,', d=',par3,', D=',par4,', CI=', par7, ', CI type=',par6,')',sep='')
} else {
mytitle <- paste('Working Time Series (base=',par8,', d=',par3,', D=',par4,')',sep='')
mysub <- paste('(base=',par8,', d=',par3,', D=',par4,', CI=', par7, ', CI type=',par6,')',sep='')
}
plot(x,type='l', main=mytitle,xlab='time',ylab='value')
par(op)
dev.off()
bitmap(file='pic1.png')
racf <- acf(x, par1, main='Autocorrelation', xlab='time lag', ylab='ACF', ci.type=par6, ci=par7, sub=mysub)
dev.off()
bitmap(file='pic2.png')
rpacf <- pacf(x,par1,main='Partial Autocorrelation',xlab='lags',ylab='PACF',sub=mysub)
dev.off()
(myacf <- c(racf$acf))
(mypacf <- c(rpacf$acf))
lengthx <- length(x)
sqrtn <- sqrt(lengthx)
load(file='createtable')
a<-table.start()
a<-table.row.start(a)
a<-table.element(a,'Autocorrelation Function',4,TRUE)
a<-table.row.end(a)
a<-table.row.start(a)
a<-table.element(a,'Time lag k',header=TRUE)
a<-table.element(a,hyperlink('basics.htm','ACF(k)','click here for more information about the Autocorrelation Function'),header=TRUE)
a<-table.element(a,'T-STAT',header=TRUE)
a<-table.element(a,'P-value',header=TRUE)
a<-table.row.end(a)
for (i in 2:(par1+1)) {
a<-table.row.start(a)
a<-table.element(a,i-1,header=TRUE)
a<-table.element(a,round(myacf[i],6))
mytstat <- myacf[i]*sqrtn
a<-table.element(a,round(mytstat,4))
a<-table.element(a,round(1-pt(abs(mytstat),lengthx),6))
a<-table.row.end(a)
}
a<-table.end(a)
table.save(a,file='mytable.tab')
a<-table.start()
a<-table.row.start(a)
a<-table.element(a,'Partial Autocorrelation Function',4,TRUE)
a<-table.row.end(a)
a<-table.row.start(a)
a<-table.element(a,'Time lag k',header=TRUE)
a<-table.element(a,hyperlink('basics.htm','PACF(k)','click here for more information about the Partial Autocorrelation Function'),header=TRUE)
a<-table.element(a,'T-STAT',header=TRUE)
a<-table.element(a,'P-value',header=TRUE)
a<-table.row.end(a)
for (i in 1:par1) {
a<-table.row.start(a)
a<-table.element(a,i,header=TRUE)
a<-table.element(a,round(mypacf[i],6))
mytstat <- mypacf[i]*sqrtn
a<-table.element(a,round(mytstat,4))
a<-table.element(a,round(1-pt(abs(mytstat),lengthx),6))
a<-table.row.end(a)
}
a<-table.end(a)
table.save(a,file='mytable1.tab')