Free Statistics

of Irreproducible Research!

Author's title

Author*Unverified author*
R Software Modulerwasp_autocorrelation.wasp
Title produced by software(Partial) Autocorrelation Function
Date of computationTue, 18 Oct 2016 12:47:09 +0100
Cite this page as followsStatistical Computations at FreeStatistics.org, Office for Research Development and Education, URL https://freestatistics.org/blog/index.php?v=date/2016/Oct/18/t1476791278csk80xqobs59dh9.htm/, Retrieved Sat, 27 Apr 2024 21:54:49 +0200
Statistical Computations at FreeStatistics.org, Office for Research Development and Education, URL https://freestatistics.org/blog/index.php?pk=, Retrieved Sat, 27 Apr 2024 21:54:49 +0200
QR Codes:

Original text written by user:
IsPrivate?No (this computation is public)
User-defined keywords
Estimated Impact0
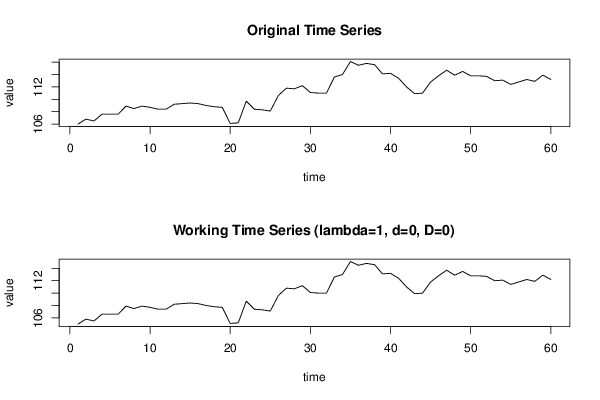
Dataseries X:
106
106,8
106,5
107,6
107,6
107,6
108,9
108,5
108,9
108,7
108,4
108,4
109,2
109,3
109,4
109,3
109
108,8
108,7
106,1
106,2
109,7
108,4
108,3
108,1
110,6
111,8
111,7
112,2
111,1
111
111
113,6
114
116,1
115,5
115,8
115,6
114,1
114,2
113,4
112
110,9
111
112,8
113,8
114,7
113,9
114,5
113,8
113,8
113,7
113
113,1
112,4
112,8
113,2
112,9
113,9
113,2


Summary of computational transaction
Raw Inputview raw input (R code)
Raw Outputview raw output of R engine
Computing time1 seconds
R Server'Gwilym Jenkins' @ jenkins.wessa.net

\begin{tabular}{lllllllll}
\hline
Summary of computational transaction \tabularnewline
Raw Input & view raw input (R code)  \tabularnewline
Raw Output & view raw output of R engine  \tabularnewline
Computing time & 1 seconds \tabularnewline
R Server & 'Gwilym Jenkins' @ jenkins.wessa.net \tabularnewline
\hline
\end{tabular}
%Source: https://freestatistics.org/blog/index.php?pk=&T=0

[TABLE]
[ROW][C]Summary of computational transaction[/C][/ROW]
[ROW][C]Raw Input[/C][C]view raw input (R code) [/C][/ROW]
[ROW][C]Raw Output[/C][C]view raw output of R engine [/C][/ROW]
[ROW][C]Computing time[/C][C]1 seconds[/C][/ROW]
[ROW][C]R Server[/C][C]'Gwilym Jenkins' @ jenkins.wessa.net[/C][/ROW]
[/TABLE]
Source: https://freestatistics.org/blog/index.php?pk=&T=0

Globally Unique Identifier (entire table): ba.freestatistics.org/blog/index.php?pk=&T=0

As an alternative you can also use a QR Code:  

The GUIDs for individual cells are displayed in the table below:

Summary of computational transaction
Raw Inputview raw input (R code)
Raw Outputview raw output of R engine
Computing time1 seconds
R Server'Gwilym Jenkins' @ jenkins.wessa.net


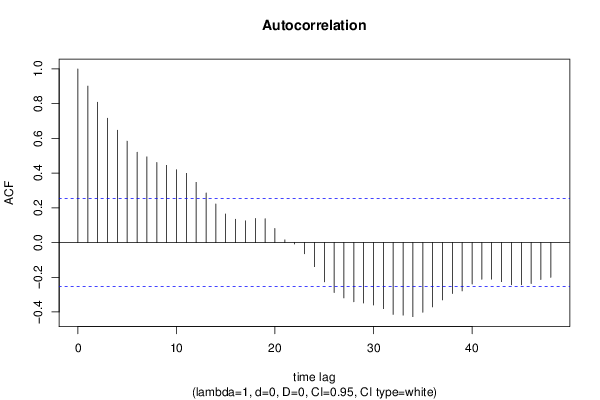
Autocorrelation Function
Time lag kACF(k)T-STATP-value
10.9009626.97880
20.8081066.25960
30.7160645.54660
40.6464755.00763e-06
50.5840854.52431.5e-05
60.5200334.02828e-05
70.4937063.82420.000157
80.4607313.56880.000356
90.4444333.44260.000528
100.419813.25180.000942
110.3983823.08590.001535
120.3466512.68510.00468
130.2857552.21340.01534
140.2224451.7230.045015
150.1643721.27320.103926
160.1342761.04010.151234
170.124810.96680.168768
180.1382551.07090.144247
190.1374691.06480.14561
200.0813240.62990.265564
210.0156170.1210.452061
22-0.008537-0.06610.473747
23-0.064783-0.50180.308819
24-0.138863-1.07560.1432
25-0.226484-1.75430.042239
26-0.288279-2.2330.014645
27-0.318998-2.47090.008167
28-0.341637-2.64630.005188
29-0.348463-2.69920.004508
30-0.359421-2.78410.003585
31-0.380655-2.94850.002272
32-0.413874-3.20590.00108
33-0.418318-3.24030.000975
34-0.426945-3.30710.000798
35-0.401316-3.10860.001437
36-0.370623-2.87080.002824
37-0.330241-2.5580.006535
38-0.293925-2.27670.013191
39-0.278734-2.15910.017427
40-0.238886-1.85040.034591
41-0.211994-1.64210.052901
42-0.211047-1.63480.053668
43-0.225366-1.74570.042993
44-0.243201-1.88380.032218
45-0.2429-1.88150.032379
46-0.235618-1.82510.036483
47-0.213174-1.65120.051958
48-0.200517-1.55320.062817

\begin{tabular}{lllllllll}
\hline
Autocorrelation Function \tabularnewline
Time lag k & ACF(k) & T-STAT & P-value \tabularnewline
1 & 0.900962 & 6.9788 & 0 \tabularnewline
2 & 0.808106 & 6.2596 & 0 \tabularnewline
3 & 0.716064 & 5.5466 & 0 \tabularnewline
4 & 0.646475 & 5.0076 & 3e-06 \tabularnewline
5 & 0.584085 & 4.5243 & 1.5e-05 \tabularnewline
6 & 0.520033 & 4.0282 & 8e-05 \tabularnewline
7 & 0.493706 & 3.8242 & 0.000157 \tabularnewline
8 & 0.460731 & 3.5688 & 0.000356 \tabularnewline
9 & 0.444433 & 3.4426 & 0.000528 \tabularnewline
10 & 0.41981 & 3.2518 & 0.000942 \tabularnewline
11 & 0.398382 & 3.0859 & 0.001535 \tabularnewline
12 & 0.346651 & 2.6851 & 0.00468 \tabularnewline
13 & 0.285755 & 2.2134 & 0.01534 \tabularnewline
14 & 0.222445 & 1.723 & 0.045015 \tabularnewline
15 & 0.164372 & 1.2732 & 0.103926 \tabularnewline
16 & 0.134276 & 1.0401 & 0.151234 \tabularnewline
17 & 0.12481 & 0.9668 & 0.168768 \tabularnewline
18 & 0.138255 & 1.0709 & 0.144247 \tabularnewline
19 & 0.137469 & 1.0648 & 0.14561 \tabularnewline
20 & 0.081324 & 0.6299 & 0.265564 \tabularnewline
21 & 0.015617 & 0.121 & 0.452061 \tabularnewline
22 & -0.008537 & -0.0661 & 0.473747 \tabularnewline
23 & -0.064783 & -0.5018 & 0.308819 \tabularnewline
24 & -0.138863 & -1.0756 & 0.1432 \tabularnewline
25 & -0.226484 & -1.7543 & 0.042239 \tabularnewline
26 & -0.288279 & -2.233 & 0.014645 \tabularnewline
27 & -0.318998 & -2.4709 & 0.008167 \tabularnewline
28 & -0.341637 & -2.6463 & 0.005188 \tabularnewline
29 & -0.348463 & -2.6992 & 0.004508 \tabularnewline
30 & -0.359421 & -2.7841 & 0.003585 \tabularnewline
31 & -0.380655 & -2.9485 & 0.002272 \tabularnewline
32 & -0.413874 & -3.2059 & 0.00108 \tabularnewline
33 & -0.418318 & -3.2403 & 0.000975 \tabularnewline
34 & -0.426945 & -3.3071 & 0.000798 \tabularnewline
35 & -0.401316 & -3.1086 & 0.001437 \tabularnewline
36 & -0.370623 & -2.8708 & 0.002824 \tabularnewline
37 & -0.330241 & -2.558 & 0.006535 \tabularnewline
38 & -0.293925 & -2.2767 & 0.013191 \tabularnewline
39 & -0.278734 & -2.1591 & 0.017427 \tabularnewline
40 & -0.238886 & -1.8504 & 0.034591 \tabularnewline
41 & -0.211994 & -1.6421 & 0.052901 \tabularnewline
42 & -0.211047 & -1.6348 & 0.053668 \tabularnewline
43 & -0.225366 & -1.7457 & 0.042993 \tabularnewline
44 & -0.243201 & -1.8838 & 0.032218 \tabularnewline
45 & -0.2429 & -1.8815 & 0.032379 \tabularnewline
46 & -0.235618 & -1.8251 & 0.036483 \tabularnewline
47 & -0.213174 & -1.6512 & 0.051958 \tabularnewline
48 & -0.200517 & -1.5532 & 0.062817 \tabularnewline
\hline
\end{tabular}
%Source: https://freestatistics.org/blog/index.php?pk=&T=1

[TABLE]
[ROW][C]Autocorrelation Function[/C][/ROW]
[ROW][C]Time lag k[/C][C]ACF(k)[/C][C]T-STAT[/C][C]P-value[/C][/ROW]
[ROW][C]1[/C][C]0.900962[/C][C]6.9788[/C][C]0[/C][/ROW]
[ROW][C]2[/C][C]0.808106[/C][C]6.2596[/C][C]0[/C][/ROW]
[ROW][C]3[/C][C]0.716064[/C][C]5.5466[/C][C]0[/C][/ROW]
[ROW][C]4[/C][C]0.646475[/C][C]5.0076[/C][C]3e-06[/C][/ROW]
[ROW][C]5[/C][C]0.584085[/C][C]4.5243[/C][C]1.5e-05[/C][/ROW]
[ROW][C]6[/C][C]0.520033[/C][C]4.0282[/C][C]8e-05[/C][/ROW]
[ROW][C]7[/C][C]0.493706[/C][C]3.8242[/C][C]0.000157[/C][/ROW]
[ROW][C]8[/C][C]0.460731[/C][C]3.5688[/C][C]0.000356[/C][/ROW]
[ROW][C]9[/C][C]0.444433[/C][C]3.4426[/C][C]0.000528[/C][/ROW]
[ROW][C]10[/C][C]0.41981[/C][C]3.2518[/C][C]0.000942[/C][/ROW]
[ROW][C]11[/C][C]0.398382[/C][C]3.0859[/C][C]0.001535[/C][/ROW]
[ROW][C]12[/C][C]0.346651[/C][C]2.6851[/C][C]0.00468[/C][/ROW]
[ROW][C]13[/C][C]0.285755[/C][C]2.2134[/C][C]0.01534[/C][/ROW]
[ROW][C]14[/C][C]0.222445[/C][C]1.723[/C][C]0.045015[/C][/ROW]
[ROW][C]15[/C][C]0.164372[/C][C]1.2732[/C][C]0.103926[/C][/ROW]
[ROW][C]16[/C][C]0.134276[/C][C]1.0401[/C][C]0.151234[/C][/ROW]
[ROW][C]17[/C][C]0.12481[/C][C]0.9668[/C][C]0.168768[/C][/ROW]
[ROW][C]18[/C][C]0.138255[/C][C]1.0709[/C][C]0.144247[/C][/ROW]
[ROW][C]19[/C][C]0.137469[/C][C]1.0648[/C][C]0.14561[/C][/ROW]
[ROW][C]20[/C][C]0.081324[/C][C]0.6299[/C][C]0.265564[/C][/ROW]
[ROW][C]21[/C][C]0.015617[/C][C]0.121[/C][C]0.452061[/C][/ROW]
[ROW][C]22[/C][C]-0.008537[/C][C]-0.0661[/C][C]0.473747[/C][/ROW]
[ROW][C]23[/C][C]-0.064783[/C][C]-0.5018[/C][C]0.308819[/C][/ROW]
[ROW][C]24[/C][C]-0.138863[/C][C]-1.0756[/C][C]0.1432[/C][/ROW]
[ROW][C]25[/C][C]-0.226484[/C][C]-1.7543[/C][C]0.042239[/C][/ROW]
[ROW][C]26[/C][C]-0.288279[/C][C]-2.233[/C][C]0.014645[/C][/ROW]
[ROW][C]27[/C][C]-0.318998[/C][C]-2.4709[/C][C]0.008167[/C][/ROW]
[ROW][C]28[/C][C]-0.341637[/C][C]-2.6463[/C][C]0.005188[/C][/ROW]
[ROW][C]29[/C][C]-0.348463[/C][C]-2.6992[/C][C]0.004508[/C][/ROW]
[ROW][C]30[/C][C]-0.359421[/C][C]-2.7841[/C][C]0.003585[/C][/ROW]
[ROW][C]31[/C][C]-0.380655[/C][C]-2.9485[/C][C]0.002272[/C][/ROW]
[ROW][C]32[/C][C]-0.413874[/C][C]-3.2059[/C][C]0.00108[/C][/ROW]
[ROW][C]33[/C][C]-0.418318[/C][C]-3.2403[/C][C]0.000975[/C][/ROW]
[ROW][C]34[/C][C]-0.426945[/C][C]-3.3071[/C][C]0.000798[/C][/ROW]
[ROW][C]35[/C][C]-0.401316[/C][C]-3.1086[/C][C]0.001437[/C][/ROW]
[ROW][C]36[/C][C]-0.370623[/C][C]-2.8708[/C][C]0.002824[/C][/ROW]
[ROW][C]37[/C][C]-0.330241[/C][C]-2.558[/C][C]0.006535[/C][/ROW]
[ROW][C]38[/C][C]-0.293925[/C][C]-2.2767[/C][C]0.013191[/C][/ROW]
[ROW][C]39[/C][C]-0.278734[/C][C]-2.1591[/C][C]0.017427[/C][/ROW]
[ROW][C]40[/C][C]-0.238886[/C][C]-1.8504[/C][C]0.034591[/C][/ROW]
[ROW][C]41[/C][C]-0.211994[/C][C]-1.6421[/C][C]0.052901[/C][/ROW]
[ROW][C]42[/C][C]-0.211047[/C][C]-1.6348[/C][C]0.053668[/C][/ROW]
[ROW][C]43[/C][C]-0.225366[/C][C]-1.7457[/C][C]0.042993[/C][/ROW]
[ROW][C]44[/C][C]-0.243201[/C][C]-1.8838[/C][C]0.032218[/C][/ROW]
[ROW][C]45[/C][C]-0.2429[/C][C]-1.8815[/C][C]0.032379[/C][/ROW]
[ROW][C]46[/C][C]-0.235618[/C][C]-1.8251[/C][C]0.036483[/C][/ROW]
[ROW][C]47[/C][C]-0.213174[/C][C]-1.6512[/C][C]0.051958[/C][/ROW]
[ROW][C]48[/C][C]-0.200517[/C][C]-1.5532[/C][C]0.062817[/C][/ROW]
[/TABLE]
Source: https://freestatistics.org/blog/index.php?pk=&T=1

Globally Unique Identifier (entire table): ba.freestatistics.org/blog/index.php?pk=&T=1

As an alternative you can also use a QR Code:  

The GUIDs for individual cells are displayed in the table below:

Autocorrelation Function
Time lag kACF(k)T-STATP-value
10.9009626.97880
20.8081066.25960
30.7160645.54660
40.6464755.00763e-06
50.5840854.52431.5e-05
60.5200334.02828e-05
70.4937063.82420.000157
80.4607313.56880.000356
90.4444333.44260.000528
100.419813.25180.000942
110.3983823.08590.001535
120.3466512.68510.00468
130.2857552.21340.01534
140.2224451.7230.045015
150.1643721.27320.103926
160.1342761.04010.151234
170.124810.96680.168768
180.1382551.07090.144247
190.1374691.06480.14561
200.0813240.62990.265564
210.0156170.1210.452061
22-0.008537-0.06610.473747
23-0.064783-0.50180.308819
24-0.138863-1.07560.1432
25-0.226484-1.75430.042239
26-0.288279-2.2330.014645
27-0.318998-2.47090.008167
28-0.341637-2.64630.005188
29-0.348463-2.69920.004508
30-0.359421-2.78410.003585
31-0.380655-2.94850.002272
32-0.413874-3.20590.00108
33-0.418318-3.24030.000975
34-0.426945-3.30710.000798
35-0.401316-3.10860.001437
36-0.370623-2.87080.002824
37-0.330241-2.5580.006535
38-0.293925-2.27670.013191
39-0.278734-2.15910.017427
40-0.238886-1.85040.034591
41-0.211994-1.64210.052901
42-0.211047-1.63480.053668
43-0.225366-1.74570.042993
44-0.243201-1.88380.032218
45-0.2429-1.88150.032379
46-0.235618-1.82510.036483
47-0.213174-1.65120.051958
48-0.200517-1.55320.062817


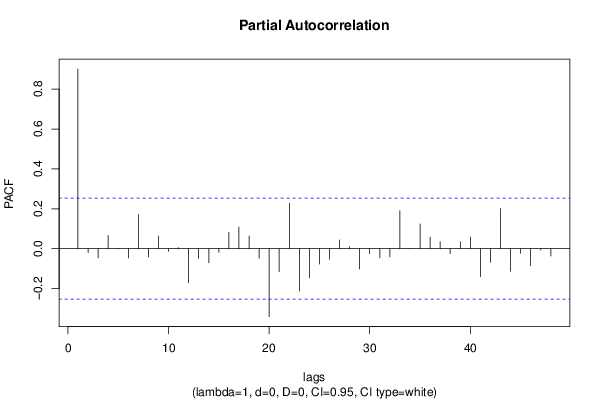
Partial Autocorrelation Function
Time lag kPACF(k)T-STATP-value
10.9009626.97880
2-0.019267-0.14920.440932
3-0.046108-0.35710.361117
40.0661810.51260.305044
50.0015220.01180.495315
6-0.047003-0.36410.358538
70.1712521.32650.094848
8-0.041508-0.32150.374468
90.0640960.49650.310684
10-0.013504-0.10460.458519
110.0054740.04240.483161
12-0.170287-1.3190.096085
13-0.048749-0.37760.353527
14-0.070056-0.54270.29469
15-0.017422-0.13490.446552
160.0825480.63940.262493
170.1083740.83950.202271
180.0641220.49670.310611
19-0.047974-0.37160.355747
20-0.340518-2.63760.005308
21-0.115667-0.8960.186929
220.2283311.76860.041018
23-0.212424-1.64540.052556
24-0.14577-1.12910.131669
25-0.076931-0.59590.276739
26-0.053248-0.41250.340738
270.0435840.33760.368422
280.009670.07490.470271
29-0.101889-0.78920.216543
30-0.024563-0.19030.424871
31-0.045131-0.34960.363938
32-0.041108-0.31840.375637
330.190361.47450.072784
340.0001660.00130.499489
350.1236730.9580.170963
360.0574960.44540.32883
370.034650.26840.394657
38-0.023919-0.18530.42682
390.0346420.26830.39468
400.0582250.4510.326805
41-0.140578-1.08890.140274
42-0.068027-0.52690.300092
430.2018331.56340.06161
44-0.113132-0.87630.192176
45-0.022805-0.17660.43019
46-0.08577-0.66440.254499
47-0.006521-0.05050.47994
48-0.03667-0.2840.388678

\begin{tabular}{lllllllll}
\hline
Partial Autocorrelation Function \tabularnewline
Time lag k & PACF(k) & T-STAT & P-value \tabularnewline
1 & 0.900962 & 6.9788 & 0 \tabularnewline
2 & -0.019267 & -0.1492 & 0.440932 \tabularnewline
3 & -0.046108 & -0.3571 & 0.361117 \tabularnewline
4 & 0.066181 & 0.5126 & 0.305044 \tabularnewline
5 & 0.001522 & 0.0118 & 0.495315 \tabularnewline
6 & -0.047003 & -0.3641 & 0.358538 \tabularnewline
7 & 0.171252 & 1.3265 & 0.094848 \tabularnewline
8 & -0.041508 & -0.3215 & 0.374468 \tabularnewline
9 & 0.064096 & 0.4965 & 0.310684 \tabularnewline
10 & -0.013504 & -0.1046 & 0.458519 \tabularnewline
11 & 0.005474 & 0.0424 & 0.483161 \tabularnewline
12 & -0.170287 & -1.319 & 0.096085 \tabularnewline
13 & -0.048749 & -0.3776 & 0.353527 \tabularnewline
14 & -0.070056 & -0.5427 & 0.29469 \tabularnewline
15 & -0.017422 & -0.1349 & 0.446552 \tabularnewline
16 & 0.082548 & 0.6394 & 0.262493 \tabularnewline
17 & 0.108374 & 0.8395 & 0.202271 \tabularnewline
18 & 0.064122 & 0.4967 & 0.310611 \tabularnewline
19 & -0.047974 & -0.3716 & 0.355747 \tabularnewline
20 & -0.340518 & -2.6376 & 0.005308 \tabularnewline
21 & -0.115667 & -0.896 & 0.186929 \tabularnewline
22 & 0.228331 & 1.7686 & 0.041018 \tabularnewline
23 & -0.212424 & -1.6454 & 0.052556 \tabularnewline
24 & -0.14577 & -1.1291 & 0.131669 \tabularnewline
25 & -0.076931 & -0.5959 & 0.276739 \tabularnewline
26 & -0.053248 & -0.4125 & 0.340738 \tabularnewline
27 & 0.043584 & 0.3376 & 0.368422 \tabularnewline
28 & 0.00967 & 0.0749 & 0.470271 \tabularnewline
29 & -0.101889 & -0.7892 & 0.216543 \tabularnewline
30 & -0.024563 & -0.1903 & 0.424871 \tabularnewline
31 & -0.045131 & -0.3496 & 0.363938 \tabularnewline
32 & -0.041108 & -0.3184 & 0.375637 \tabularnewline
33 & 0.19036 & 1.4745 & 0.072784 \tabularnewline
34 & 0.000166 & 0.0013 & 0.499489 \tabularnewline
35 & 0.123673 & 0.958 & 0.170963 \tabularnewline
36 & 0.057496 & 0.4454 & 0.32883 \tabularnewline
37 & 0.03465 & 0.2684 & 0.394657 \tabularnewline
38 & -0.023919 & -0.1853 & 0.42682 \tabularnewline
39 & 0.034642 & 0.2683 & 0.39468 \tabularnewline
40 & 0.058225 & 0.451 & 0.326805 \tabularnewline
41 & -0.140578 & -1.0889 & 0.140274 \tabularnewline
42 & -0.068027 & -0.5269 & 0.300092 \tabularnewline
43 & 0.201833 & 1.5634 & 0.06161 \tabularnewline
44 & -0.113132 & -0.8763 & 0.192176 \tabularnewline
45 & -0.022805 & -0.1766 & 0.43019 \tabularnewline
46 & -0.08577 & -0.6644 & 0.254499 \tabularnewline
47 & -0.006521 & -0.0505 & 0.47994 \tabularnewline
48 & -0.03667 & -0.284 & 0.388678 \tabularnewline
\hline
\end{tabular}
%Source: https://freestatistics.org/blog/index.php?pk=&T=2

[TABLE]
[ROW][C]Partial Autocorrelation Function[/C][/ROW]
[ROW][C]Time lag k[/C][C]PACF(k)[/C][C]T-STAT[/C][C]P-value[/C][/ROW]
[ROW][C]1[/C][C]0.900962[/C][C]6.9788[/C][C]0[/C][/ROW]
[ROW][C]2[/C][C]-0.019267[/C][C]-0.1492[/C][C]0.440932[/C][/ROW]
[ROW][C]3[/C][C]-0.046108[/C][C]-0.3571[/C][C]0.361117[/C][/ROW]
[ROW][C]4[/C][C]0.066181[/C][C]0.5126[/C][C]0.305044[/C][/ROW]
[ROW][C]5[/C][C]0.001522[/C][C]0.0118[/C][C]0.495315[/C][/ROW]
[ROW][C]6[/C][C]-0.047003[/C][C]-0.3641[/C][C]0.358538[/C][/ROW]
[ROW][C]7[/C][C]0.171252[/C][C]1.3265[/C][C]0.094848[/C][/ROW]
[ROW][C]8[/C][C]-0.041508[/C][C]-0.3215[/C][C]0.374468[/C][/ROW]
[ROW][C]9[/C][C]0.064096[/C][C]0.4965[/C][C]0.310684[/C][/ROW]
[ROW][C]10[/C][C]-0.013504[/C][C]-0.1046[/C][C]0.458519[/C][/ROW]
[ROW][C]11[/C][C]0.005474[/C][C]0.0424[/C][C]0.483161[/C][/ROW]
[ROW][C]12[/C][C]-0.170287[/C][C]-1.319[/C][C]0.096085[/C][/ROW]
[ROW][C]13[/C][C]-0.048749[/C][C]-0.3776[/C][C]0.353527[/C][/ROW]
[ROW][C]14[/C][C]-0.070056[/C][C]-0.5427[/C][C]0.29469[/C][/ROW]
[ROW][C]15[/C][C]-0.017422[/C][C]-0.1349[/C][C]0.446552[/C][/ROW]
[ROW][C]16[/C][C]0.082548[/C][C]0.6394[/C][C]0.262493[/C][/ROW]
[ROW][C]17[/C][C]0.108374[/C][C]0.8395[/C][C]0.202271[/C][/ROW]
[ROW][C]18[/C][C]0.064122[/C][C]0.4967[/C][C]0.310611[/C][/ROW]
[ROW][C]19[/C][C]-0.047974[/C][C]-0.3716[/C][C]0.355747[/C][/ROW]
[ROW][C]20[/C][C]-0.340518[/C][C]-2.6376[/C][C]0.005308[/C][/ROW]
[ROW][C]21[/C][C]-0.115667[/C][C]-0.896[/C][C]0.186929[/C][/ROW]
[ROW][C]22[/C][C]0.228331[/C][C]1.7686[/C][C]0.041018[/C][/ROW]
[ROW][C]23[/C][C]-0.212424[/C][C]-1.6454[/C][C]0.052556[/C][/ROW]
[ROW][C]24[/C][C]-0.14577[/C][C]-1.1291[/C][C]0.131669[/C][/ROW]
[ROW][C]25[/C][C]-0.076931[/C][C]-0.5959[/C][C]0.276739[/C][/ROW]
[ROW][C]26[/C][C]-0.053248[/C][C]-0.4125[/C][C]0.340738[/C][/ROW]
[ROW][C]27[/C][C]0.043584[/C][C]0.3376[/C][C]0.368422[/C][/ROW]
[ROW][C]28[/C][C]0.00967[/C][C]0.0749[/C][C]0.470271[/C][/ROW]
[ROW][C]29[/C][C]-0.101889[/C][C]-0.7892[/C][C]0.216543[/C][/ROW]
[ROW][C]30[/C][C]-0.024563[/C][C]-0.1903[/C][C]0.424871[/C][/ROW]
[ROW][C]31[/C][C]-0.045131[/C][C]-0.3496[/C][C]0.363938[/C][/ROW]
[ROW][C]32[/C][C]-0.041108[/C][C]-0.3184[/C][C]0.375637[/C][/ROW]
[ROW][C]33[/C][C]0.19036[/C][C]1.4745[/C][C]0.072784[/C][/ROW]
[ROW][C]34[/C][C]0.000166[/C][C]0.0013[/C][C]0.499489[/C][/ROW]
[ROW][C]35[/C][C]0.123673[/C][C]0.958[/C][C]0.170963[/C][/ROW]
[ROW][C]36[/C][C]0.057496[/C][C]0.4454[/C][C]0.32883[/C][/ROW]
[ROW][C]37[/C][C]0.03465[/C][C]0.2684[/C][C]0.394657[/C][/ROW]
[ROW][C]38[/C][C]-0.023919[/C][C]-0.1853[/C][C]0.42682[/C][/ROW]
[ROW][C]39[/C][C]0.034642[/C][C]0.2683[/C][C]0.39468[/C][/ROW]
[ROW][C]40[/C][C]0.058225[/C][C]0.451[/C][C]0.326805[/C][/ROW]
[ROW][C]41[/C][C]-0.140578[/C][C]-1.0889[/C][C]0.140274[/C][/ROW]
[ROW][C]42[/C][C]-0.068027[/C][C]-0.5269[/C][C]0.300092[/C][/ROW]
[ROW][C]43[/C][C]0.201833[/C][C]1.5634[/C][C]0.06161[/C][/ROW]
[ROW][C]44[/C][C]-0.113132[/C][C]-0.8763[/C][C]0.192176[/C][/ROW]
[ROW][C]45[/C][C]-0.022805[/C][C]-0.1766[/C][C]0.43019[/C][/ROW]
[ROW][C]46[/C][C]-0.08577[/C][C]-0.6644[/C][C]0.254499[/C][/ROW]
[ROW][C]47[/C][C]-0.006521[/C][C]-0.0505[/C][C]0.47994[/C][/ROW]
[ROW][C]48[/C][C]-0.03667[/C][C]-0.284[/C][C]0.388678[/C][/ROW]
[/TABLE]
Source: https://freestatistics.org/blog/index.php?pk=&T=2

Globally Unique Identifier (entire table): ba.freestatistics.org/blog/index.php?pk=&T=2

As an alternative you can also use a QR Code:  

The GUIDs for individual cells are displayed in the table below:

Partial Autocorrelation Function
Time lag kPACF(k)T-STATP-value
10.9009626.97880
2-0.019267-0.14920.440932
3-0.046108-0.35710.361117
40.0661810.51260.305044
50.0015220.01180.495315
6-0.047003-0.36410.358538
70.1712521.32650.094848
8-0.041508-0.32150.374468
90.0640960.49650.310684
10-0.013504-0.10460.458519
110.0054740.04240.483161
12-0.170287-1.3190.096085
13-0.048749-0.37760.353527
14-0.070056-0.54270.29469
15-0.017422-0.13490.446552
160.0825480.63940.262493
170.1083740.83950.202271
180.0641220.49670.310611
19-0.047974-0.37160.355747
20-0.340518-2.63760.005308
21-0.115667-0.8960.186929
220.2283311.76860.041018
23-0.212424-1.64540.052556
24-0.14577-1.12910.131669
25-0.076931-0.59590.276739
26-0.053248-0.41250.340738
270.0435840.33760.368422
280.009670.07490.470271
29-0.101889-0.78920.216543
30-0.024563-0.19030.424871
31-0.045131-0.34960.363938
32-0.041108-0.31840.375637
330.190361.47450.072784
340.0001660.00130.499489
350.1236730.9580.170963
360.0574960.44540.32883
370.034650.26840.394657
38-0.023919-0.18530.42682
390.0346420.26830.39468
400.0582250.4510.326805
41-0.140578-1.08890.140274
42-0.068027-0.52690.300092
430.2018331.56340.06161
44-0.113132-0.87630.192176
45-0.022805-0.17660.43019
46-0.08577-0.66440.254499
47-0.006521-0.05050.47994
48-0.03667-0.2840.388678


Parameters (Session):
par1 = 48 ; par2 = 1 ; par3 = 0 ; par4 = 0 ; par5 = 12 ; par6 = White Noise ; par7 = 0.95 ;
Parameters (R input):
par1 = 48 ; par2 = 1 ; par3 = 0 ; par4 = 0 ; par5 = 12 ; par6 = White Noise ; par7 = 0.95 ; par8 = ;
R code (references can be found in the software module):
if (par1 == 'Default') {
par1 = 10*log10(length(x))
} else {
par1 <- as.numeric(par1)
}
par2 <- as.numeric(par2)
par3 <- as.numeric(par3)
par4 <- as.numeric(par4)
par5 <- as.numeric(par5)
if (par6 == 'White Noise') par6 <- 'white' else par6 <- 'ma'
par7 <- as.numeric(par7)
if (par8 != '') par8 <- as.numeric(par8)
x <- na.omit(x)
ox <- x
if (par8 == '') {
if (par2 == 0) {
x <- log(x)
} else {
x <- (x ^ par2 - 1) / par2
}
} else {
x <- log(x,base=par8)
}
if (par3 > 0) x <- diff(x,lag=1,difference=par3)
if (par4 > 0) x <- diff(x,lag=par5,difference=par4)
bitmap(file='picts.png')
op <- par(mfrow=c(2,1))
plot(ox,type='l',main='Original Time Series',xlab='time',ylab='value')
if (par8=='') {
mytitle <- paste('Working Time Series (lambda=',par2,', d=',par3,', D=',par4,')',sep='')
mysub <- paste('(lambda=',par2,', d=',par3,', D=',par4,', CI=', par7, ', CI type=',par6,')',sep='')
} else {
mytitle <- paste('Working Time Series (base=',par8,', d=',par3,', D=',par4,')',sep='')
mysub <- paste('(base=',par8,', d=',par3,', D=',par4,', CI=', par7, ', CI type=',par6,')',sep='')
}
plot(x,type='l', main=mytitle,xlab='time',ylab='value')
par(op)
dev.off()
bitmap(file='pic1.png')
racf <- acf(x, par1, main='Autocorrelation', xlab='time lag', ylab='ACF', ci.type=par6, ci=par7, sub=mysub)
dev.off()
bitmap(file='pic2.png')
rpacf <- pacf(x,par1,main='Partial Autocorrelation',xlab='lags',ylab='PACF',sub=mysub)
dev.off()
(myacf <- c(racf$acf))
(mypacf <- c(rpacf$acf))
lengthx <- length(x)
sqrtn <- sqrt(lengthx)
load(file='createtable')
a<-table.start()
a<-table.row.start(a)
a<-table.element(a,'Autocorrelation Function',4,TRUE)
a<-table.row.end(a)
a<-table.row.start(a)
a<-table.element(a,'Time lag k',header=TRUE)
a<-table.element(a,hyperlink('basics.htm','ACF(k)','click here for more information about the Autocorrelation Function'),header=TRUE)
a<-table.element(a,'T-STAT',header=TRUE)
a<-table.element(a,'P-value',header=TRUE)
a<-table.row.end(a)
for (i in 2:(par1+1)) {
a<-table.row.start(a)
a<-table.element(a,i-1,header=TRUE)
a<-table.element(a,round(myacf[i],6))
mytstat <- myacf[i]*sqrtn
a<-table.element(a,round(mytstat,4))
a<-table.element(a,round(1-pt(abs(mytstat),lengthx),6))
a<-table.row.end(a)
}
a<-table.end(a)
table.save(a,file='mytable.tab')
a<-table.start()
a<-table.row.start(a)
a<-table.element(a,'Partial Autocorrelation Function',4,TRUE)
a<-table.row.end(a)
a<-table.row.start(a)
a<-table.element(a,'Time lag k',header=TRUE)
a<-table.element(a,hyperlink('basics.htm','PACF(k)','click here for more information about the Partial Autocorrelation Function'),header=TRUE)
a<-table.element(a,'T-STAT',header=TRUE)
a<-table.element(a,'P-value',header=TRUE)
a<-table.row.end(a)
for (i in 1:par1) {
a<-table.row.start(a)
a<-table.element(a,i,header=TRUE)
a<-table.element(a,round(mypacf[i],6))
mytstat <- mypacf[i]*sqrtn
a<-table.element(a,round(mytstat,4))
a<-table.element(a,round(1-pt(abs(mytstat),lengthx),6))
a<-table.row.end(a)
}
a<-table.end(a)
table.save(a,file='mytable1.tab')