Free Statistics

of Irreproducible Research!

Author's title

Author*Unverified author*
R Software Modulerwasp_autocorrelation.wasp
Title produced by software(Partial) Autocorrelation Function
Date of computationTue, 18 Oct 2016 13:04:01 +0100
Cite this page as followsStatistical Computations at FreeStatistics.org, Office for Research Development and Education, URL https://freestatistics.org/blog/index.php?v=date/2016/Oct/18/t1476792259v3hqenoxc20evou.htm/, Retrieved Sun, 28 Apr 2024 19:43:24 +0200
Statistical Computations at FreeStatistics.org, Office for Research Development and Education, URL https://freestatistics.org/blog/index.php?pk=, Retrieved Sun, 28 Apr 2024 19:43:24 +0200
QR Codes:

Original text written by user:
IsPrivate?No (this computation is public)
User-defined keywords
Estimated Impact0
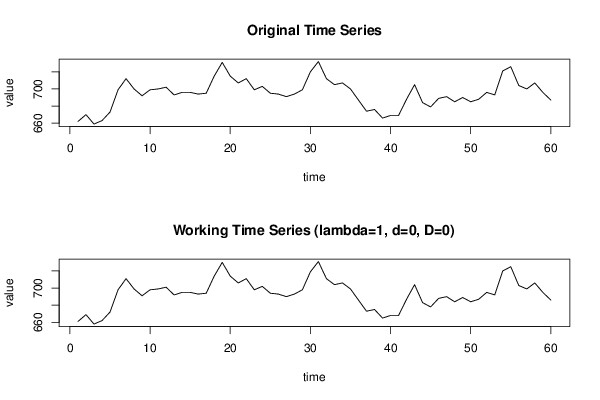
Dataseries X:
662
670
659
663
673
699
712
700
692
699
700
702
693
696
696
694
695
715
731
715
707
712
699
703
695
694
691
694
699
720
732
712
705
707
700
687
674
676
666
669
669
688
705
684
679
689
691
685
690
685
688
696
693
721
726
704
700
707
696
687


Summary of computational transaction
Raw Inputview raw input (R code)
Raw Outputview raw output of R engine
Computing time2 seconds
R Server'Gwilym Jenkins' @ jenkins.wessa.net

\begin{tabular}{lllllllll}
\hline
Summary of computational transaction \tabularnewline
Raw Input & view raw input (R code)  \tabularnewline
Raw Output & view raw output of R engine  \tabularnewline
Computing time & 2 seconds \tabularnewline
R Server & 'Gwilym Jenkins' @ jenkins.wessa.net \tabularnewline
\hline
\end{tabular}
%Source: https://freestatistics.org/blog/index.php?pk=&T=0

[TABLE]
[ROW][C]Summary of computational transaction[/C][/ROW]
[ROW][C]Raw Input[/C][C]view raw input (R code) [/C][/ROW]
[ROW][C]Raw Output[/C][C]view raw output of R engine [/C][/ROW]
[ROW][C]Computing time[/C][C]2 seconds[/C][/ROW]
[ROW][C]R Server[/C][C]'Gwilym Jenkins' @ jenkins.wessa.net[/C][/ROW]
[/TABLE]
Source: https://freestatistics.org/blog/index.php?pk=&T=0

Globally Unique Identifier (entire table): ba.freestatistics.org/blog/index.php?pk=&T=0

As an alternative you can also use a QR Code:  

The GUIDs for individual cells are displayed in the table below:

Summary of computational transaction
Raw Inputview raw input (R code)
Raw Outputview raw output of R engine
Computing time2 seconds
R Server'Gwilym Jenkins' @ jenkins.wessa.net


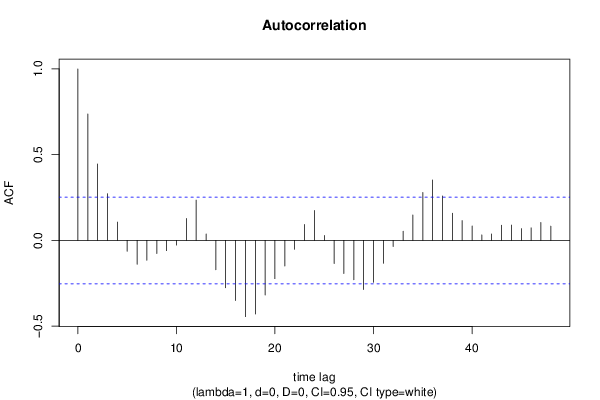
Autocorrelation Function
Time lag kACF(k)T-STATP-value
10.7370155.70890
20.4453993.450.000516
30.2719172.10630.019687
40.1065810.82560.206159
5-0.063445-0.49140.312453
6-0.13945-1.08020.142193
7-0.115503-0.89470.187266
8-0.07707-0.5970.276382
9-0.059945-0.46430.322046
10-0.027575-0.21360.415795
110.1276940.98910.16329
120.2348821.81940.036922
130.0371860.2880.387154
14-0.171146-1.32570.094984
15-0.276185-2.13930.018244
16-0.350455-2.71460.004326
17-0.444948-3.44660.000522
18-0.429746-3.32880.000747
19-0.31844-2.46660.008256
20-0.223353-1.73010.044378
21-0.149671-1.15930.125455
22-0.052092-0.40350.344005
230.092530.71670.238159
240.174821.35420.090383
250.0285370.2210.412904
26-0.134967-1.04550.150004
27-0.193549-1.49920.06953
28-0.229412-1.7770.040317
29-0.286367-2.21820.015169
30-0.243866-1.8890.031865
31-0.13312-1.03110.153307
32-0.035913-0.27820.390915
330.0532890.41280.340622
340.147621.14350.128694
350.2792032.16270.01728
360.3517682.72480.004209
370.258482.00220.024896
380.1579671.22360.112942
390.1151820.89220.187925
400.0838430.64940.259265
410.0319490.24750.402694
420.0369830.28650.387753
430.0887120.68720.247314
440.0888760.68840.246917
450.0687410.53250.298184
460.0729080.56470.287178
470.1044040.80870.210939
480.0829730.64270.261431

\begin{tabular}{lllllllll}
\hline
Autocorrelation Function \tabularnewline
Time lag k & ACF(k) & T-STAT & P-value \tabularnewline
1 & 0.737015 & 5.7089 & 0 \tabularnewline
2 & 0.445399 & 3.45 & 0.000516 \tabularnewline
3 & 0.271917 & 2.1063 & 0.019687 \tabularnewline
4 & 0.106581 & 0.8256 & 0.206159 \tabularnewline
5 & -0.063445 & -0.4914 & 0.312453 \tabularnewline
6 & -0.13945 & -1.0802 & 0.142193 \tabularnewline
7 & -0.115503 & -0.8947 & 0.187266 \tabularnewline
8 & -0.07707 & -0.597 & 0.276382 \tabularnewline
9 & -0.059945 & -0.4643 & 0.322046 \tabularnewline
10 & -0.027575 & -0.2136 & 0.415795 \tabularnewline
11 & 0.127694 & 0.9891 & 0.16329 \tabularnewline
12 & 0.234882 & 1.8194 & 0.036922 \tabularnewline
13 & 0.037186 & 0.288 & 0.387154 \tabularnewline
14 & -0.171146 & -1.3257 & 0.094984 \tabularnewline
15 & -0.276185 & -2.1393 & 0.018244 \tabularnewline
16 & -0.350455 & -2.7146 & 0.004326 \tabularnewline
17 & -0.444948 & -3.4466 & 0.000522 \tabularnewline
18 & -0.429746 & -3.3288 & 0.000747 \tabularnewline
19 & -0.31844 & -2.4666 & 0.008256 \tabularnewline
20 & -0.223353 & -1.7301 & 0.044378 \tabularnewline
21 & -0.149671 & -1.1593 & 0.125455 \tabularnewline
22 & -0.052092 & -0.4035 & 0.344005 \tabularnewline
23 & 0.09253 & 0.7167 & 0.238159 \tabularnewline
24 & 0.17482 & 1.3542 & 0.090383 \tabularnewline
25 & 0.028537 & 0.221 & 0.412904 \tabularnewline
26 & -0.134967 & -1.0455 & 0.150004 \tabularnewline
27 & -0.193549 & -1.4992 & 0.06953 \tabularnewline
28 & -0.229412 & -1.777 & 0.040317 \tabularnewline
29 & -0.286367 & -2.2182 & 0.015169 \tabularnewline
30 & -0.243866 & -1.889 & 0.031865 \tabularnewline
31 & -0.13312 & -1.0311 & 0.153307 \tabularnewline
32 & -0.035913 & -0.2782 & 0.390915 \tabularnewline
33 & 0.053289 & 0.4128 & 0.340622 \tabularnewline
34 & 0.14762 & 1.1435 & 0.128694 \tabularnewline
35 & 0.279203 & 2.1627 & 0.01728 \tabularnewline
36 & 0.351768 & 2.7248 & 0.004209 \tabularnewline
37 & 0.25848 & 2.0022 & 0.024896 \tabularnewline
38 & 0.157967 & 1.2236 & 0.112942 \tabularnewline
39 & 0.115182 & 0.8922 & 0.187925 \tabularnewline
40 & 0.083843 & 0.6494 & 0.259265 \tabularnewline
41 & 0.031949 & 0.2475 & 0.402694 \tabularnewline
42 & 0.036983 & 0.2865 & 0.387753 \tabularnewline
43 & 0.088712 & 0.6872 & 0.247314 \tabularnewline
44 & 0.088876 & 0.6884 & 0.246917 \tabularnewline
45 & 0.068741 & 0.5325 & 0.298184 \tabularnewline
46 & 0.072908 & 0.5647 & 0.287178 \tabularnewline
47 & 0.104404 & 0.8087 & 0.210939 \tabularnewline
48 & 0.082973 & 0.6427 & 0.261431 \tabularnewline
\hline
\end{tabular}
%Source: https://freestatistics.org/blog/index.php?pk=&T=1

[TABLE]
[ROW][C]Autocorrelation Function[/C][/ROW]
[ROW][C]Time lag k[/C][C]ACF(k)[/C][C]T-STAT[/C][C]P-value[/C][/ROW]
[ROW][C]1[/C][C]0.737015[/C][C]5.7089[/C][C]0[/C][/ROW]
[ROW][C]2[/C][C]0.445399[/C][C]3.45[/C][C]0.000516[/C][/ROW]
[ROW][C]3[/C][C]0.271917[/C][C]2.1063[/C][C]0.019687[/C][/ROW]
[ROW][C]4[/C][C]0.106581[/C][C]0.8256[/C][C]0.206159[/C][/ROW]
[ROW][C]5[/C][C]-0.063445[/C][C]-0.4914[/C][C]0.312453[/C][/ROW]
[ROW][C]6[/C][C]-0.13945[/C][C]-1.0802[/C][C]0.142193[/C][/ROW]
[ROW][C]7[/C][C]-0.115503[/C][C]-0.8947[/C][C]0.187266[/C][/ROW]
[ROW][C]8[/C][C]-0.07707[/C][C]-0.597[/C][C]0.276382[/C][/ROW]
[ROW][C]9[/C][C]-0.059945[/C][C]-0.4643[/C][C]0.322046[/C][/ROW]
[ROW][C]10[/C][C]-0.027575[/C][C]-0.2136[/C][C]0.415795[/C][/ROW]
[ROW][C]11[/C][C]0.127694[/C][C]0.9891[/C][C]0.16329[/C][/ROW]
[ROW][C]12[/C][C]0.234882[/C][C]1.8194[/C][C]0.036922[/C][/ROW]
[ROW][C]13[/C][C]0.037186[/C][C]0.288[/C][C]0.387154[/C][/ROW]
[ROW][C]14[/C][C]-0.171146[/C][C]-1.3257[/C][C]0.094984[/C][/ROW]
[ROW][C]15[/C][C]-0.276185[/C][C]-2.1393[/C][C]0.018244[/C][/ROW]
[ROW][C]16[/C][C]-0.350455[/C][C]-2.7146[/C][C]0.004326[/C][/ROW]
[ROW][C]17[/C][C]-0.444948[/C][C]-3.4466[/C][C]0.000522[/C][/ROW]
[ROW][C]18[/C][C]-0.429746[/C][C]-3.3288[/C][C]0.000747[/C][/ROW]
[ROW][C]19[/C][C]-0.31844[/C][C]-2.4666[/C][C]0.008256[/C][/ROW]
[ROW][C]20[/C][C]-0.223353[/C][C]-1.7301[/C][C]0.044378[/C][/ROW]
[ROW][C]21[/C][C]-0.149671[/C][C]-1.1593[/C][C]0.125455[/C][/ROW]
[ROW][C]22[/C][C]-0.052092[/C][C]-0.4035[/C][C]0.344005[/C][/ROW]
[ROW][C]23[/C][C]0.09253[/C][C]0.7167[/C][C]0.238159[/C][/ROW]
[ROW][C]24[/C][C]0.17482[/C][C]1.3542[/C][C]0.090383[/C][/ROW]
[ROW][C]25[/C][C]0.028537[/C][C]0.221[/C][C]0.412904[/C][/ROW]
[ROW][C]26[/C][C]-0.134967[/C][C]-1.0455[/C][C]0.150004[/C][/ROW]
[ROW][C]27[/C][C]-0.193549[/C][C]-1.4992[/C][C]0.06953[/C][/ROW]
[ROW][C]28[/C][C]-0.229412[/C][C]-1.777[/C][C]0.040317[/C][/ROW]
[ROW][C]29[/C][C]-0.286367[/C][C]-2.2182[/C][C]0.015169[/C][/ROW]
[ROW][C]30[/C][C]-0.243866[/C][C]-1.889[/C][C]0.031865[/C][/ROW]
[ROW][C]31[/C][C]-0.13312[/C][C]-1.0311[/C][C]0.153307[/C][/ROW]
[ROW][C]32[/C][C]-0.035913[/C][C]-0.2782[/C][C]0.390915[/C][/ROW]
[ROW][C]33[/C][C]0.053289[/C][C]0.4128[/C][C]0.340622[/C][/ROW]
[ROW][C]34[/C][C]0.14762[/C][C]1.1435[/C][C]0.128694[/C][/ROW]
[ROW][C]35[/C][C]0.279203[/C][C]2.1627[/C][C]0.01728[/C][/ROW]
[ROW][C]36[/C][C]0.351768[/C][C]2.7248[/C][C]0.004209[/C][/ROW]
[ROW][C]37[/C][C]0.25848[/C][C]2.0022[/C][C]0.024896[/C][/ROW]
[ROW][C]38[/C][C]0.157967[/C][C]1.2236[/C][C]0.112942[/C][/ROW]
[ROW][C]39[/C][C]0.115182[/C][C]0.8922[/C][C]0.187925[/C][/ROW]
[ROW][C]40[/C][C]0.083843[/C][C]0.6494[/C][C]0.259265[/C][/ROW]
[ROW][C]41[/C][C]0.031949[/C][C]0.2475[/C][C]0.402694[/C][/ROW]
[ROW][C]42[/C][C]0.036983[/C][C]0.2865[/C][C]0.387753[/C][/ROW]
[ROW][C]43[/C][C]0.088712[/C][C]0.6872[/C][C]0.247314[/C][/ROW]
[ROW][C]44[/C][C]0.088876[/C][C]0.6884[/C][C]0.246917[/C][/ROW]
[ROW][C]45[/C][C]0.068741[/C][C]0.5325[/C][C]0.298184[/C][/ROW]
[ROW][C]46[/C][C]0.072908[/C][C]0.5647[/C][C]0.287178[/C][/ROW]
[ROW][C]47[/C][C]0.104404[/C][C]0.8087[/C][C]0.210939[/C][/ROW]
[ROW][C]48[/C][C]0.082973[/C][C]0.6427[/C][C]0.261431[/C][/ROW]
[/TABLE]
Source: https://freestatistics.org/blog/index.php?pk=&T=1

Globally Unique Identifier (entire table): ba.freestatistics.org/blog/index.php?pk=&T=1

As an alternative you can also use a QR Code:  

The GUIDs for individual cells are displayed in the table below:

Autocorrelation Function
Time lag kACF(k)T-STATP-value
10.7370155.70890
20.4453993.450.000516
30.2719172.10630.019687
40.1065810.82560.206159
5-0.063445-0.49140.312453
6-0.13945-1.08020.142193
7-0.115503-0.89470.187266
8-0.07707-0.5970.276382
9-0.059945-0.46430.322046
10-0.027575-0.21360.415795
110.1276940.98910.16329
120.2348821.81940.036922
130.0371860.2880.387154
14-0.171146-1.32570.094984
15-0.276185-2.13930.018244
16-0.350455-2.71460.004326
17-0.444948-3.44660.000522
18-0.429746-3.32880.000747
19-0.31844-2.46660.008256
20-0.223353-1.73010.044378
21-0.149671-1.15930.125455
22-0.052092-0.40350.344005
230.092530.71670.238159
240.174821.35420.090383
250.0285370.2210.412904
26-0.134967-1.04550.150004
27-0.193549-1.49920.06953
28-0.229412-1.7770.040317
29-0.286367-2.21820.015169
30-0.243866-1.8890.031865
31-0.13312-1.03110.153307
32-0.035913-0.27820.390915
330.0532890.41280.340622
340.147621.14350.128694
350.2792032.16270.01728
360.3517682.72480.004209
370.258482.00220.024896
380.1579671.22360.112942
390.1151820.89220.187925
400.0838430.64940.259265
410.0319490.24750.402694
420.0369830.28650.387753
430.0887120.68720.247314
440.0888760.68840.246917
450.0687410.53250.298184
460.0729080.56470.287178
470.1044040.80870.210939
480.0829730.64270.261431


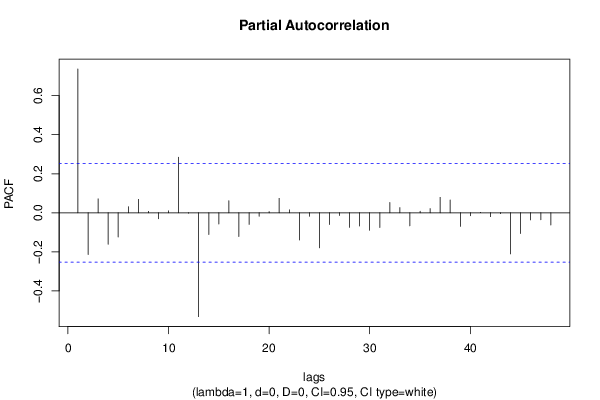
Partial Autocorrelation Function
Time lag kPACF(k)T-STATP-value
10.7370155.70890
2-0.214077-1.65820.051245
30.0714780.55370.290932
4-0.160808-1.24560.108875
5-0.12407-0.9610.170193
60.0314160.24330.404283
70.0687890.53280.298057
80.0072540.05620.477688
9-0.030724-0.2380.406352
100.0099970.07740.469266
110.2844992.20370.015697
12-0.001849-0.01430.494311
13-0.532091-4.12165.9e-05
14-0.111422-0.86310.195767
15-0.057504-0.44540.328808
160.0615260.47660.317696
17-0.121159-0.93850.175877
18-0.059387-0.460.323585
19-0.017551-0.1360.446157
200.0060910.04720.481264
210.0738340.57190.284758
220.015030.11640.453852
23-0.139632-1.08160.141883
24-0.017556-0.1360.446144
25-0.179582-1.3910.084676
26-0.06011-0.46560.321591
27-0.013709-0.10620.457894
28-0.074772-0.57920.282318
29-0.068045-0.52710.300043
30-0.089141-0.69050.246276
31-0.075187-0.58240.281241
320.0528830.40960.341768
330.026670.20660.418517
34-0.06687-0.5180.303191
350.0079570.06160.47553
360.0215760.16710.433915
370.0790380.61220.271351
380.0658830.51030.305847
39-0.069681-0.53970.295686
40-0.015532-0.12030.45232
410.0009210.00710.497165
42-0.019709-0.15270.439586
43-0.004423-0.03430.486393
44-0.2104-1.62970.054197
45-0.105717-0.81890.208047
46-0.036489-0.28260.389212
47-0.035623-0.27590.391772
48-0.062856-0.48690.314059

\begin{tabular}{lllllllll}
\hline
Partial Autocorrelation Function \tabularnewline
Time lag k & PACF(k) & T-STAT & P-value \tabularnewline
1 & 0.737015 & 5.7089 & 0 \tabularnewline
2 & -0.214077 & -1.6582 & 0.051245 \tabularnewline
3 & 0.071478 & 0.5537 & 0.290932 \tabularnewline
4 & -0.160808 & -1.2456 & 0.108875 \tabularnewline
5 & -0.12407 & -0.961 & 0.170193 \tabularnewline
6 & 0.031416 & 0.2433 & 0.404283 \tabularnewline
7 & 0.068789 & 0.5328 & 0.298057 \tabularnewline
8 & 0.007254 & 0.0562 & 0.477688 \tabularnewline
9 & -0.030724 & -0.238 & 0.406352 \tabularnewline
10 & 0.009997 & 0.0774 & 0.469266 \tabularnewline
11 & 0.284499 & 2.2037 & 0.015697 \tabularnewline
12 & -0.001849 & -0.0143 & 0.494311 \tabularnewline
13 & -0.532091 & -4.1216 & 5.9e-05 \tabularnewline
14 & -0.111422 & -0.8631 & 0.195767 \tabularnewline
15 & -0.057504 & -0.4454 & 0.328808 \tabularnewline
16 & 0.061526 & 0.4766 & 0.317696 \tabularnewline
17 & -0.121159 & -0.9385 & 0.175877 \tabularnewline
18 & -0.059387 & -0.46 & 0.323585 \tabularnewline
19 & -0.017551 & -0.136 & 0.446157 \tabularnewline
20 & 0.006091 & 0.0472 & 0.481264 \tabularnewline
21 & 0.073834 & 0.5719 & 0.284758 \tabularnewline
22 & 0.01503 & 0.1164 & 0.453852 \tabularnewline
23 & -0.139632 & -1.0816 & 0.141883 \tabularnewline
24 & -0.017556 & -0.136 & 0.446144 \tabularnewline
25 & -0.179582 & -1.391 & 0.084676 \tabularnewline
26 & -0.06011 & -0.4656 & 0.321591 \tabularnewline
27 & -0.013709 & -0.1062 & 0.457894 \tabularnewline
28 & -0.074772 & -0.5792 & 0.282318 \tabularnewline
29 & -0.068045 & -0.5271 & 0.300043 \tabularnewline
30 & -0.089141 & -0.6905 & 0.246276 \tabularnewline
31 & -0.075187 & -0.5824 & 0.281241 \tabularnewline
32 & 0.052883 & 0.4096 & 0.341768 \tabularnewline
33 & 0.02667 & 0.2066 & 0.418517 \tabularnewline
34 & -0.06687 & -0.518 & 0.303191 \tabularnewline
35 & 0.007957 & 0.0616 & 0.47553 \tabularnewline
36 & 0.021576 & 0.1671 & 0.433915 \tabularnewline
37 & 0.079038 & 0.6122 & 0.271351 \tabularnewline
38 & 0.065883 & 0.5103 & 0.305847 \tabularnewline
39 & -0.069681 & -0.5397 & 0.295686 \tabularnewline
40 & -0.015532 & -0.1203 & 0.45232 \tabularnewline
41 & 0.000921 & 0.0071 & 0.497165 \tabularnewline
42 & -0.019709 & -0.1527 & 0.439586 \tabularnewline
43 & -0.004423 & -0.0343 & 0.486393 \tabularnewline
44 & -0.2104 & -1.6297 & 0.054197 \tabularnewline
45 & -0.105717 & -0.8189 & 0.208047 \tabularnewline
46 & -0.036489 & -0.2826 & 0.389212 \tabularnewline
47 & -0.035623 & -0.2759 & 0.391772 \tabularnewline
48 & -0.062856 & -0.4869 & 0.314059 \tabularnewline
\hline
\end{tabular}
%Source: https://freestatistics.org/blog/index.php?pk=&T=2

[TABLE]
[ROW][C]Partial Autocorrelation Function[/C][/ROW]
[ROW][C]Time lag k[/C][C]PACF(k)[/C][C]T-STAT[/C][C]P-value[/C][/ROW]
[ROW][C]1[/C][C]0.737015[/C][C]5.7089[/C][C]0[/C][/ROW]
[ROW][C]2[/C][C]-0.214077[/C][C]-1.6582[/C][C]0.051245[/C][/ROW]
[ROW][C]3[/C][C]0.071478[/C][C]0.5537[/C][C]0.290932[/C][/ROW]
[ROW][C]4[/C][C]-0.160808[/C][C]-1.2456[/C][C]0.108875[/C][/ROW]
[ROW][C]5[/C][C]-0.12407[/C][C]-0.961[/C][C]0.170193[/C][/ROW]
[ROW][C]6[/C][C]0.031416[/C][C]0.2433[/C][C]0.404283[/C][/ROW]
[ROW][C]7[/C][C]0.068789[/C][C]0.5328[/C][C]0.298057[/C][/ROW]
[ROW][C]8[/C][C]0.007254[/C][C]0.0562[/C][C]0.477688[/C][/ROW]
[ROW][C]9[/C][C]-0.030724[/C][C]-0.238[/C][C]0.406352[/C][/ROW]
[ROW][C]10[/C][C]0.009997[/C][C]0.0774[/C][C]0.469266[/C][/ROW]
[ROW][C]11[/C][C]0.284499[/C][C]2.2037[/C][C]0.015697[/C][/ROW]
[ROW][C]12[/C][C]-0.001849[/C][C]-0.0143[/C][C]0.494311[/C][/ROW]
[ROW][C]13[/C][C]-0.532091[/C][C]-4.1216[/C][C]5.9e-05[/C][/ROW]
[ROW][C]14[/C][C]-0.111422[/C][C]-0.8631[/C][C]0.195767[/C][/ROW]
[ROW][C]15[/C][C]-0.057504[/C][C]-0.4454[/C][C]0.328808[/C][/ROW]
[ROW][C]16[/C][C]0.061526[/C][C]0.4766[/C][C]0.317696[/C][/ROW]
[ROW][C]17[/C][C]-0.121159[/C][C]-0.9385[/C][C]0.175877[/C][/ROW]
[ROW][C]18[/C][C]-0.059387[/C][C]-0.46[/C][C]0.323585[/C][/ROW]
[ROW][C]19[/C][C]-0.017551[/C][C]-0.136[/C][C]0.446157[/C][/ROW]
[ROW][C]20[/C][C]0.006091[/C][C]0.0472[/C][C]0.481264[/C][/ROW]
[ROW][C]21[/C][C]0.073834[/C][C]0.5719[/C][C]0.284758[/C][/ROW]
[ROW][C]22[/C][C]0.01503[/C][C]0.1164[/C][C]0.453852[/C][/ROW]
[ROW][C]23[/C][C]-0.139632[/C][C]-1.0816[/C][C]0.141883[/C][/ROW]
[ROW][C]24[/C][C]-0.017556[/C][C]-0.136[/C][C]0.446144[/C][/ROW]
[ROW][C]25[/C][C]-0.179582[/C][C]-1.391[/C][C]0.084676[/C][/ROW]
[ROW][C]26[/C][C]-0.06011[/C][C]-0.4656[/C][C]0.321591[/C][/ROW]
[ROW][C]27[/C][C]-0.013709[/C][C]-0.1062[/C][C]0.457894[/C][/ROW]
[ROW][C]28[/C][C]-0.074772[/C][C]-0.5792[/C][C]0.282318[/C][/ROW]
[ROW][C]29[/C][C]-0.068045[/C][C]-0.5271[/C][C]0.300043[/C][/ROW]
[ROW][C]30[/C][C]-0.089141[/C][C]-0.6905[/C][C]0.246276[/C][/ROW]
[ROW][C]31[/C][C]-0.075187[/C][C]-0.5824[/C][C]0.281241[/C][/ROW]
[ROW][C]32[/C][C]0.052883[/C][C]0.4096[/C][C]0.341768[/C][/ROW]
[ROW][C]33[/C][C]0.02667[/C][C]0.2066[/C][C]0.418517[/C][/ROW]
[ROW][C]34[/C][C]-0.06687[/C][C]-0.518[/C][C]0.303191[/C][/ROW]
[ROW][C]35[/C][C]0.007957[/C][C]0.0616[/C][C]0.47553[/C][/ROW]
[ROW][C]36[/C][C]0.021576[/C][C]0.1671[/C][C]0.433915[/C][/ROW]
[ROW][C]37[/C][C]0.079038[/C][C]0.6122[/C][C]0.271351[/C][/ROW]
[ROW][C]38[/C][C]0.065883[/C][C]0.5103[/C][C]0.305847[/C][/ROW]
[ROW][C]39[/C][C]-0.069681[/C][C]-0.5397[/C][C]0.295686[/C][/ROW]
[ROW][C]40[/C][C]-0.015532[/C][C]-0.1203[/C][C]0.45232[/C][/ROW]
[ROW][C]41[/C][C]0.000921[/C][C]0.0071[/C][C]0.497165[/C][/ROW]
[ROW][C]42[/C][C]-0.019709[/C][C]-0.1527[/C][C]0.439586[/C][/ROW]
[ROW][C]43[/C][C]-0.004423[/C][C]-0.0343[/C][C]0.486393[/C][/ROW]
[ROW][C]44[/C][C]-0.2104[/C][C]-1.6297[/C][C]0.054197[/C][/ROW]
[ROW][C]45[/C][C]-0.105717[/C][C]-0.8189[/C][C]0.208047[/C][/ROW]
[ROW][C]46[/C][C]-0.036489[/C][C]-0.2826[/C][C]0.389212[/C][/ROW]
[ROW][C]47[/C][C]-0.035623[/C][C]-0.2759[/C][C]0.391772[/C][/ROW]
[ROW][C]48[/C][C]-0.062856[/C][C]-0.4869[/C][C]0.314059[/C][/ROW]
[/TABLE]
Source: https://freestatistics.org/blog/index.php?pk=&T=2

Globally Unique Identifier (entire table): ba.freestatistics.org/blog/index.php?pk=&T=2

As an alternative you can also use a QR Code:  

The GUIDs for individual cells are displayed in the table below:

Partial Autocorrelation Function
Time lag kPACF(k)T-STATP-value
10.7370155.70890
2-0.214077-1.65820.051245
30.0714780.55370.290932
4-0.160808-1.24560.108875
5-0.12407-0.9610.170193
60.0314160.24330.404283
70.0687890.53280.298057
80.0072540.05620.477688
9-0.030724-0.2380.406352
100.0099970.07740.469266
110.2844992.20370.015697
12-0.001849-0.01430.494311
13-0.532091-4.12165.9e-05
14-0.111422-0.86310.195767
15-0.057504-0.44540.328808
160.0615260.47660.317696
17-0.121159-0.93850.175877
18-0.059387-0.460.323585
19-0.017551-0.1360.446157
200.0060910.04720.481264
210.0738340.57190.284758
220.015030.11640.453852
23-0.139632-1.08160.141883
24-0.017556-0.1360.446144
25-0.179582-1.3910.084676
26-0.06011-0.46560.321591
27-0.013709-0.10620.457894
28-0.074772-0.57920.282318
29-0.068045-0.52710.300043
30-0.089141-0.69050.246276
31-0.075187-0.58240.281241
320.0528830.40960.341768
330.026670.20660.418517
34-0.06687-0.5180.303191
350.0079570.06160.47553
360.0215760.16710.433915
370.0790380.61220.271351
380.0658830.51030.305847
39-0.069681-0.53970.295686
40-0.015532-0.12030.45232
410.0009210.00710.497165
42-0.019709-0.15270.439586
43-0.004423-0.03430.486393
44-0.2104-1.62970.054197
45-0.105717-0.81890.208047
46-0.036489-0.28260.389212
47-0.035623-0.27590.391772
48-0.062856-0.48690.314059


Parameters (Session):
par1 = 48 ; par2 = 1 ; par3 = 0 ; par4 = 0 ; par5 = 12 ; par6 = White Noise ; par7 = 0.95 ;
Parameters (R input):
par1 = 48 ; par2 = 1 ; par3 = 0 ; par4 = 0 ; par5 = 12 ; par6 = White Noise ; par7 = 0.95 ; par8 = ;
R code (references can be found in the software module):
if (par1 == 'Default') {
par1 = 10*log10(length(x))
} else {
par1 <- as.numeric(par1)
}
par2 <- as.numeric(par2)
par3 <- as.numeric(par3)
par4 <- as.numeric(par4)
par5 <- as.numeric(par5)
if (par6 == 'White Noise') par6 <- 'white' else par6 <- 'ma'
par7 <- as.numeric(par7)
if (par8 != '') par8 <- as.numeric(par8)
x <- na.omit(x)
ox <- x
if (par8 == '') {
if (par2 == 0) {
x <- log(x)
} else {
x <- (x ^ par2 - 1) / par2
}
} else {
x <- log(x,base=par8)
}
if (par3 > 0) x <- diff(x,lag=1,difference=par3)
if (par4 > 0) x <- diff(x,lag=par5,difference=par4)
bitmap(file='picts.png')
op <- par(mfrow=c(2,1))
plot(ox,type='l',main='Original Time Series',xlab='time',ylab='value')
if (par8=='') {
mytitle <- paste('Working Time Series (lambda=',par2,', d=',par3,', D=',par4,')',sep='')
mysub <- paste('(lambda=',par2,', d=',par3,', D=',par4,', CI=', par7, ', CI type=',par6,')',sep='')
} else {
mytitle <- paste('Working Time Series (base=',par8,', d=',par3,', D=',par4,')',sep='')
mysub <- paste('(base=',par8,', d=',par3,', D=',par4,', CI=', par7, ', CI type=',par6,')',sep='')
}
plot(x,type='l', main=mytitle,xlab='time',ylab='value')
par(op)
dev.off()
bitmap(file='pic1.png')
racf <- acf(x, par1, main='Autocorrelation', xlab='time lag', ylab='ACF', ci.type=par6, ci=par7, sub=mysub)
dev.off()
bitmap(file='pic2.png')
rpacf <- pacf(x,par1,main='Partial Autocorrelation',xlab='lags',ylab='PACF',sub=mysub)
dev.off()
(myacf <- c(racf$acf))
(mypacf <- c(rpacf$acf))
lengthx <- length(x)
sqrtn <- sqrt(lengthx)
load(file='createtable')
a<-table.start()
a<-table.row.start(a)
a<-table.element(a,'Autocorrelation Function',4,TRUE)
a<-table.row.end(a)
a<-table.row.start(a)
a<-table.element(a,'Time lag k',header=TRUE)
a<-table.element(a,hyperlink('basics.htm','ACF(k)','click here for more information about the Autocorrelation Function'),header=TRUE)
a<-table.element(a,'T-STAT',header=TRUE)
a<-table.element(a,'P-value',header=TRUE)
a<-table.row.end(a)
for (i in 2:(par1+1)) {
a<-table.row.start(a)
a<-table.element(a,i-1,header=TRUE)
a<-table.element(a,round(myacf[i],6))
mytstat <- myacf[i]*sqrtn
a<-table.element(a,round(mytstat,4))
a<-table.element(a,round(1-pt(abs(mytstat),lengthx),6))
a<-table.row.end(a)
}
a<-table.end(a)
table.save(a,file='mytable.tab')
a<-table.start()
a<-table.row.start(a)
a<-table.element(a,'Partial Autocorrelation Function',4,TRUE)
a<-table.row.end(a)
a<-table.row.start(a)
a<-table.element(a,'Time lag k',header=TRUE)
a<-table.element(a,hyperlink('basics.htm','PACF(k)','click here for more information about the Partial Autocorrelation Function'),header=TRUE)
a<-table.element(a,'T-STAT',header=TRUE)
a<-table.element(a,'P-value',header=TRUE)
a<-table.row.end(a)
for (i in 1:par1) {
a<-table.row.start(a)
a<-table.element(a,i,header=TRUE)
a<-table.element(a,round(mypacf[i],6))
mytstat <- mypacf[i]*sqrtn
a<-table.element(a,round(mytstat,4))
a<-table.element(a,round(1-pt(abs(mytstat),lengthx),6))
a<-table.row.end(a)
}
a<-table.end(a)
table.save(a,file='mytable1.tab')