Free Statistics

of Irreproducible Research!

Author's title

Author*Unverified author*
R Software Modulerwasp_autocorrelation.wasp
Title produced by software(Partial) Autocorrelation Function
Date of computationTue, 18 Oct 2016 13:05:49 +0100
Cite this page as followsStatistical Computations at FreeStatistics.org, Office for Research Development and Education, URL https://freestatistics.org/blog/index.php?v=date/2016/Oct/18/t14767923732zkxf3iiao6lklh.htm/, Retrieved Sun, 28 Apr 2024 18:50:47 +0200
Statistical Computations at FreeStatistics.org, Office for Research Development and Education, URL https://freestatistics.org/blog/index.php?pk=, Retrieved Sun, 28 Apr 2024 18:50:47 +0200
QR Codes:

Original text written by user:
IsPrivate?No (this computation is public)
User-defined keywords
Estimated Impact0
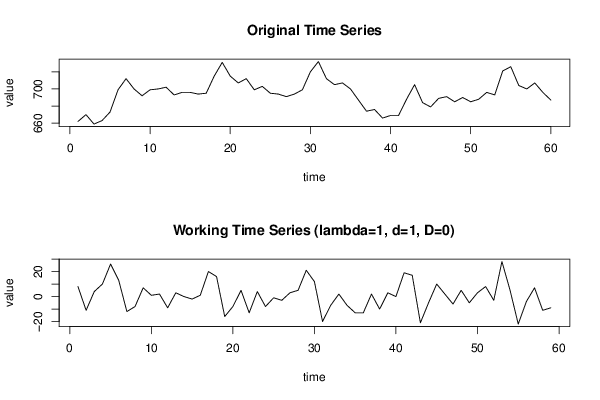
Dataseries X:
662
670
659
663
673
699
712
700
692
699
700
702
693
696
696
694
695
715
731
715
707
712
699
703
695
694
691
694
699
720
732
712
705
707
700
687
674
676
666
669
669
688
705
684
679
689
691
685
690
685
688
696
693
721
726
704
700
707
696
687


Summary of computational transaction
Raw Inputview raw input (R code)
Raw Outputview raw output of R engine
Computing time2 seconds
R Server'Gwilym Jenkins' @ jenkins.wessa.net

\begin{tabular}{lllllllll}
\hline
Summary of computational transaction \tabularnewline
Raw Input & view raw input (R code)  \tabularnewline
Raw Output & view raw output of R engine  \tabularnewline
Computing time & 2 seconds \tabularnewline
R Server & 'Gwilym Jenkins' @ jenkins.wessa.net \tabularnewline
\hline
\end{tabular}
%Source: https://freestatistics.org/blog/index.php?pk=&T=0

[TABLE]
[ROW][C]Summary of computational transaction[/C][/ROW]
[ROW][C]Raw Input[/C][C]view raw input (R code) [/C][/ROW]
[ROW][C]Raw Output[/C][C]view raw output of R engine [/C][/ROW]
[ROW][C]Computing time[/C][C]2 seconds[/C][/ROW]
[ROW][C]R Server[/C][C]'Gwilym Jenkins' @ jenkins.wessa.net[/C][/ROW]
[/TABLE]
Source: https://freestatistics.org/blog/index.php?pk=&T=0

Globally Unique Identifier (entire table): ba.freestatistics.org/blog/index.php?pk=&T=0

As an alternative you can also use a QR Code:  

The GUIDs for individual cells are displayed in the table below:

Summary of computational transaction
Raw Inputview raw input (R code)
Raw Outputview raw output of R engine
Computing time2 seconds
R Server'Gwilym Jenkins' @ jenkins.wessa.net


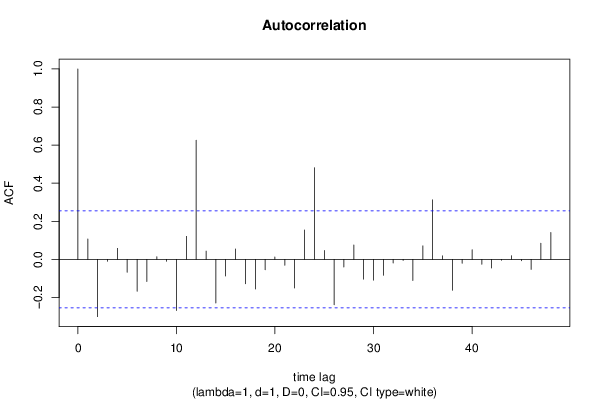
Autocorrelation Function
Time lag kACF(k)T-STATP-value
10.1073650.82470.206435
2-0.300822-2.31070.012183
3-0.009655-0.07420.470566
40.057910.44480.32904
5-0.067562-0.5190.302867
6-0.167467-1.28630.101674
7-0.116095-0.89170.188076
80.0135950.10440.458593
9-0.010169-0.07810.469002
10-0.268747-2.06430.021698
110.1207450.92750.178732
120.6255474.80496e-06
130.0434220.33350.369957
14-0.229573-1.76340.041507
15-0.087088-0.66890.253074
160.0546980.42010.337953
17-0.128405-0.98630.164007
18-0.155658-1.19560.118311
19-0.054854-0.42130.337519
200.0127210.09770.461247
21-0.031115-0.2390.405968
22-0.150735-1.15780.125802
230.1543041.18520.12034
240.4811453.69570.000241
250.0464730.3570.361196
26-0.238635-1.8330.035926
27-0.039947-0.30680.380024
280.0751420.57720.283008
29-0.103995-0.79880.213806
30-0.109084-0.83790.202737
31-0.083199-0.63910.262627
32-0.019537-0.15010.440611
33-0.005383-0.04130.48358
34-0.110907-0.85190.198859
350.0709980.54530.293786
360.3125852.4010.00976
370.0183720.14110.444128
38-0.161888-1.24350.109304
39-0.020228-0.15540.438529
400.0502350.38590.350494
41-0.025794-0.19810.421814
42-0.044934-0.34510.365607
43-0.00459-0.03530.485997
440.0190780.14650.441997
45-0.007707-0.05920.476498
46-0.052579-0.40390.343885
470.084590.64970.259189
480.1408471.08190.141857

\begin{tabular}{lllllllll}
\hline
Autocorrelation Function \tabularnewline
Time lag k & ACF(k) & T-STAT & P-value \tabularnewline
1 & 0.107365 & 0.8247 & 0.206435 \tabularnewline
2 & -0.300822 & -2.3107 & 0.012183 \tabularnewline
3 & -0.009655 & -0.0742 & 0.470566 \tabularnewline
4 & 0.05791 & 0.4448 & 0.32904 \tabularnewline
5 & -0.067562 & -0.519 & 0.302867 \tabularnewline
6 & -0.167467 & -1.2863 & 0.101674 \tabularnewline
7 & -0.116095 & -0.8917 & 0.188076 \tabularnewline
8 & 0.013595 & 0.1044 & 0.458593 \tabularnewline
9 & -0.010169 & -0.0781 & 0.469002 \tabularnewline
10 & -0.268747 & -2.0643 & 0.021698 \tabularnewline
11 & 0.120745 & 0.9275 & 0.178732 \tabularnewline
12 & 0.625547 & 4.8049 & 6e-06 \tabularnewline
13 & 0.043422 & 0.3335 & 0.369957 \tabularnewline
14 & -0.229573 & -1.7634 & 0.041507 \tabularnewline
15 & -0.087088 & -0.6689 & 0.253074 \tabularnewline
16 & 0.054698 & 0.4201 & 0.337953 \tabularnewline
17 & -0.128405 & -0.9863 & 0.164007 \tabularnewline
18 & -0.155658 & -1.1956 & 0.118311 \tabularnewline
19 & -0.054854 & -0.4213 & 0.337519 \tabularnewline
20 & 0.012721 & 0.0977 & 0.461247 \tabularnewline
21 & -0.031115 & -0.239 & 0.405968 \tabularnewline
22 & -0.150735 & -1.1578 & 0.125802 \tabularnewline
23 & 0.154304 & 1.1852 & 0.12034 \tabularnewline
24 & 0.481145 & 3.6957 & 0.000241 \tabularnewline
25 & 0.046473 & 0.357 & 0.361196 \tabularnewline
26 & -0.238635 & -1.833 & 0.035926 \tabularnewline
27 & -0.039947 & -0.3068 & 0.380024 \tabularnewline
28 & 0.075142 & 0.5772 & 0.283008 \tabularnewline
29 & -0.103995 & -0.7988 & 0.213806 \tabularnewline
30 & -0.109084 & -0.8379 & 0.202737 \tabularnewline
31 & -0.083199 & -0.6391 & 0.262627 \tabularnewline
32 & -0.019537 & -0.1501 & 0.440611 \tabularnewline
33 & -0.005383 & -0.0413 & 0.48358 \tabularnewline
34 & -0.110907 & -0.8519 & 0.198859 \tabularnewline
35 & 0.070998 & 0.5453 & 0.293786 \tabularnewline
36 & 0.312585 & 2.401 & 0.00976 \tabularnewline
37 & 0.018372 & 0.1411 & 0.444128 \tabularnewline
38 & -0.161888 & -1.2435 & 0.109304 \tabularnewline
39 & -0.020228 & -0.1554 & 0.438529 \tabularnewline
40 & 0.050235 & 0.3859 & 0.350494 \tabularnewline
41 & -0.025794 & -0.1981 & 0.421814 \tabularnewline
42 & -0.044934 & -0.3451 & 0.365607 \tabularnewline
43 & -0.00459 & -0.0353 & 0.485997 \tabularnewline
44 & 0.019078 & 0.1465 & 0.441997 \tabularnewline
45 & -0.007707 & -0.0592 & 0.476498 \tabularnewline
46 & -0.052579 & -0.4039 & 0.343885 \tabularnewline
47 & 0.08459 & 0.6497 & 0.259189 \tabularnewline
48 & 0.140847 & 1.0819 & 0.141857 \tabularnewline
\hline
\end{tabular}
%Source: https://freestatistics.org/blog/index.php?pk=&T=1

[TABLE]
[ROW][C]Autocorrelation Function[/C][/ROW]
[ROW][C]Time lag k[/C][C]ACF(k)[/C][C]T-STAT[/C][C]P-value[/C][/ROW]
[ROW][C]1[/C][C]0.107365[/C][C]0.8247[/C][C]0.206435[/C][/ROW]
[ROW][C]2[/C][C]-0.300822[/C][C]-2.3107[/C][C]0.012183[/C][/ROW]
[ROW][C]3[/C][C]-0.009655[/C][C]-0.0742[/C][C]0.470566[/C][/ROW]
[ROW][C]4[/C][C]0.05791[/C][C]0.4448[/C][C]0.32904[/C][/ROW]
[ROW][C]5[/C][C]-0.067562[/C][C]-0.519[/C][C]0.302867[/C][/ROW]
[ROW][C]6[/C][C]-0.167467[/C][C]-1.2863[/C][C]0.101674[/C][/ROW]
[ROW][C]7[/C][C]-0.116095[/C][C]-0.8917[/C][C]0.188076[/C][/ROW]
[ROW][C]8[/C][C]0.013595[/C][C]0.1044[/C][C]0.458593[/C][/ROW]
[ROW][C]9[/C][C]-0.010169[/C][C]-0.0781[/C][C]0.469002[/C][/ROW]
[ROW][C]10[/C][C]-0.268747[/C][C]-2.0643[/C][C]0.021698[/C][/ROW]
[ROW][C]11[/C][C]0.120745[/C][C]0.9275[/C][C]0.178732[/C][/ROW]
[ROW][C]12[/C][C]0.625547[/C][C]4.8049[/C][C]6e-06[/C][/ROW]
[ROW][C]13[/C][C]0.043422[/C][C]0.3335[/C][C]0.369957[/C][/ROW]
[ROW][C]14[/C][C]-0.229573[/C][C]-1.7634[/C][C]0.041507[/C][/ROW]
[ROW][C]15[/C][C]-0.087088[/C][C]-0.6689[/C][C]0.253074[/C][/ROW]
[ROW][C]16[/C][C]0.054698[/C][C]0.4201[/C][C]0.337953[/C][/ROW]
[ROW][C]17[/C][C]-0.128405[/C][C]-0.9863[/C][C]0.164007[/C][/ROW]
[ROW][C]18[/C][C]-0.155658[/C][C]-1.1956[/C][C]0.118311[/C][/ROW]
[ROW][C]19[/C][C]-0.054854[/C][C]-0.4213[/C][C]0.337519[/C][/ROW]
[ROW][C]20[/C][C]0.012721[/C][C]0.0977[/C][C]0.461247[/C][/ROW]
[ROW][C]21[/C][C]-0.031115[/C][C]-0.239[/C][C]0.405968[/C][/ROW]
[ROW][C]22[/C][C]-0.150735[/C][C]-1.1578[/C][C]0.125802[/C][/ROW]
[ROW][C]23[/C][C]0.154304[/C][C]1.1852[/C][C]0.12034[/C][/ROW]
[ROW][C]24[/C][C]0.481145[/C][C]3.6957[/C][C]0.000241[/C][/ROW]
[ROW][C]25[/C][C]0.046473[/C][C]0.357[/C][C]0.361196[/C][/ROW]
[ROW][C]26[/C][C]-0.238635[/C][C]-1.833[/C][C]0.035926[/C][/ROW]
[ROW][C]27[/C][C]-0.039947[/C][C]-0.3068[/C][C]0.380024[/C][/ROW]
[ROW][C]28[/C][C]0.075142[/C][C]0.5772[/C][C]0.283008[/C][/ROW]
[ROW][C]29[/C][C]-0.103995[/C][C]-0.7988[/C][C]0.213806[/C][/ROW]
[ROW][C]30[/C][C]-0.109084[/C][C]-0.8379[/C][C]0.202737[/C][/ROW]
[ROW][C]31[/C][C]-0.083199[/C][C]-0.6391[/C][C]0.262627[/C][/ROW]
[ROW][C]32[/C][C]-0.019537[/C][C]-0.1501[/C][C]0.440611[/C][/ROW]
[ROW][C]33[/C][C]-0.005383[/C][C]-0.0413[/C][C]0.48358[/C][/ROW]
[ROW][C]34[/C][C]-0.110907[/C][C]-0.8519[/C][C]0.198859[/C][/ROW]
[ROW][C]35[/C][C]0.070998[/C][C]0.5453[/C][C]0.293786[/C][/ROW]
[ROW][C]36[/C][C]0.312585[/C][C]2.401[/C][C]0.00976[/C][/ROW]
[ROW][C]37[/C][C]0.018372[/C][C]0.1411[/C][C]0.444128[/C][/ROW]
[ROW][C]38[/C][C]-0.161888[/C][C]-1.2435[/C][C]0.109304[/C][/ROW]
[ROW][C]39[/C][C]-0.020228[/C][C]-0.1554[/C][C]0.438529[/C][/ROW]
[ROW][C]40[/C][C]0.050235[/C][C]0.3859[/C][C]0.350494[/C][/ROW]
[ROW][C]41[/C][C]-0.025794[/C][C]-0.1981[/C][C]0.421814[/C][/ROW]
[ROW][C]42[/C][C]-0.044934[/C][C]-0.3451[/C][C]0.365607[/C][/ROW]
[ROW][C]43[/C][C]-0.00459[/C][C]-0.0353[/C][C]0.485997[/C][/ROW]
[ROW][C]44[/C][C]0.019078[/C][C]0.1465[/C][C]0.441997[/C][/ROW]
[ROW][C]45[/C][C]-0.007707[/C][C]-0.0592[/C][C]0.476498[/C][/ROW]
[ROW][C]46[/C][C]-0.052579[/C][C]-0.4039[/C][C]0.343885[/C][/ROW]
[ROW][C]47[/C][C]0.08459[/C][C]0.6497[/C][C]0.259189[/C][/ROW]
[ROW][C]48[/C][C]0.140847[/C][C]1.0819[/C][C]0.141857[/C][/ROW]
[/TABLE]
Source: https://freestatistics.org/blog/index.php?pk=&T=1

Globally Unique Identifier (entire table): ba.freestatistics.org/blog/index.php?pk=&T=1

As an alternative you can also use a QR Code:  

The GUIDs for individual cells are displayed in the table below:

Autocorrelation Function
Time lag kACF(k)T-STATP-value
10.1073650.82470.206435
2-0.300822-2.31070.012183
3-0.009655-0.07420.470566
40.057910.44480.32904
5-0.067562-0.5190.302867
6-0.167467-1.28630.101674
7-0.116095-0.89170.188076
80.0135950.10440.458593
9-0.010169-0.07810.469002
10-0.268747-2.06430.021698
110.1207450.92750.178732
120.6255474.80496e-06
130.0434220.33350.369957
14-0.229573-1.76340.041507
15-0.087088-0.66890.253074
160.0546980.42010.337953
17-0.128405-0.98630.164007
18-0.155658-1.19560.118311
19-0.054854-0.42130.337519
200.0127210.09770.461247
21-0.031115-0.2390.405968
22-0.150735-1.15780.125802
230.1543041.18520.12034
240.4811453.69570.000241
250.0464730.3570.361196
26-0.238635-1.8330.035926
27-0.039947-0.30680.380024
280.0751420.57720.283008
29-0.103995-0.79880.213806
30-0.109084-0.83790.202737
31-0.083199-0.63910.262627
32-0.019537-0.15010.440611
33-0.005383-0.04130.48358
34-0.110907-0.85190.198859
350.0709980.54530.293786
360.3125852.4010.00976
370.0183720.14110.444128
38-0.161888-1.24350.109304
39-0.020228-0.15540.438529
400.0502350.38590.350494
41-0.025794-0.19810.421814
42-0.044934-0.34510.365607
43-0.00459-0.03530.485997
440.0190780.14650.441997
45-0.007707-0.05920.476498
46-0.052579-0.40390.343885
470.084590.64970.259189
480.1408471.08190.141857


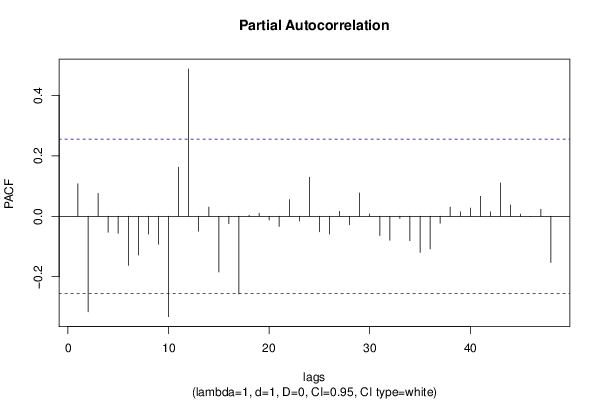
Partial Autocorrelation Function
Time lag kPACF(k)T-STATP-value
10.1073650.82470.206435
2-0.315992-2.42720.009144
30.0750470.57640.283253
4-0.052897-0.40630.342993
5-0.056429-0.43340.333137
6-0.16257-1.24870.108349
7-0.128365-0.9860.164081
8-0.058972-0.4530.326114
9-0.092439-0.710.24024
10-0.332064-2.55060.006684
110.1620951.24510.109013
120.4872083.74230.000208
13-0.049327-0.37890.353065
140.030240.23230.408563
15-0.184661-1.41840.080667
16-0.02441-0.18750.425959
17-0.257073-1.97460.026499
180.0031720.02440.490321
190.009970.07660.469607
20-0.012489-0.09590.46195
21-0.033577-0.25790.398688
220.0555140.42640.335679
23-0.015583-0.11970.452564
240.1292270.99260.162477
25-0.051549-0.3960.346782
26-0.05903-0.45340.325955
270.0162850.12510.45044
28-0.028366-0.21790.414136
290.0770.59140.27824
300.0076470.05870.476681
31-0.063899-0.49080.312687
32-0.07913-0.60780.272824
33-0.00703-0.0540.478559
34-0.08063-0.61930.269042
35-0.119413-0.91720.181379
36-0.107905-0.82880.205269
37-0.023137-0.17770.429777
380.0301520.23160.408825
390.0147460.11330.455103
400.0270050.20740.418194
410.0657490.5050.307711
420.0144830.11120.455901
430.1101450.8460.200474
440.0373880.28720.387491
450.0070820.05440.478401
462.7e-052e-040.499916
470.0229440.17620.430356
48-0.153167-1.17650.122061

\begin{tabular}{lllllllll}
\hline
Partial Autocorrelation Function \tabularnewline
Time lag k & PACF(k) & T-STAT & P-value \tabularnewline
1 & 0.107365 & 0.8247 & 0.206435 \tabularnewline
2 & -0.315992 & -2.4272 & 0.009144 \tabularnewline
3 & 0.075047 & 0.5764 & 0.283253 \tabularnewline
4 & -0.052897 & -0.4063 & 0.342993 \tabularnewline
5 & -0.056429 & -0.4334 & 0.333137 \tabularnewline
6 & -0.16257 & -1.2487 & 0.108349 \tabularnewline
7 & -0.128365 & -0.986 & 0.164081 \tabularnewline
8 & -0.058972 & -0.453 & 0.326114 \tabularnewline
9 & -0.092439 & -0.71 & 0.24024 \tabularnewline
10 & -0.332064 & -2.5506 & 0.006684 \tabularnewline
11 & 0.162095 & 1.2451 & 0.109013 \tabularnewline
12 & 0.487208 & 3.7423 & 0.000208 \tabularnewline
13 & -0.049327 & -0.3789 & 0.353065 \tabularnewline
14 & 0.03024 & 0.2323 & 0.408563 \tabularnewline
15 & -0.184661 & -1.4184 & 0.080667 \tabularnewline
16 & -0.02441 & -0.1875 & 0.425959 \tabularnewline
17 & -0.257073 & -1.9746 & 0.026499 \tabularnewline
18 & 0.003172 & 0.0244 & 0.490321 \tabularnewline
19 & 0.00997 & 0.0766 & 0.469607 \tabularnewline
20 & -0.012489 & -0.0959 & 0.46195 \tabularnewline
21 & -0.033577 & -0.2579 & 0.398688 \tabularnewline
22 & 0.055514 & 0.4264 & 0.335679 \tabularnewline
23 & -0.015583 & -0.1197 & 0.452564 \tabularnewline
24 & 0.129227 & 0.9926 & 0.162477 \tabularnewline
25 & -0.051549 & -0.396 & 0.346782 \tabularnewline
26 & -0.05903 & -0.4534 & 0.325955 \tabularnewline
27 & 0.016285 & 0.1251 & 0.45044 \tabularnewline
28 & -0.028366 & -0.2179 & 0.414136 \tabularnewline
29 & 0.077 & 0.5914 & 0.27824 \tabularnewline
30 & 0.007647 & 0.0587 & 0.476681 \tabularnewline
31 & -0.063899 & -0.4908 & 0.312687 \tabularnewline
32 & -0.07913 & -0.6078 & 0.272824 \tabularnewline
33 & -0.00703 & -0.054 & 0.478559 \tabularnewline
34 & -0.08063 & -0.6193 & 0.269042 \tabularnewline
35 & -0.119413 & -0.9172 & 0.181379 \tabularnewline
36 & -0.107905 & -0.8288 & 0.205269 \tabularnewline
37 & -0.023137 & -0.1777 & 0.429777 \tabularnewline
38 & 0.030152 & 0.2316 & 0.408825 \tabularnewline
39 & 0.014746 & 0.1133 & 0.455103 \tabularnewline
40 & 0.027005 & 0.2074 & 0.418194 \tabularnewline
41 & 0.065749 & 0.505 & 0.307711 \tabularnewline
42 & 0.014483 & 0.1112 & 0.455901 \tabularnewline
43 & 0.110145 & 0.846 & 0.200474 \tabularnewline
44 & 0.037388 & 0.2872 & 0.387491 \tabularnewline
45 & 0.007082 & 0.0544 & 0.478401 \tabularnewline
46 & 2.7e-05 & 2e-04 & 0.499916 \tabularnewline
47 & 0.022944 & 0.1762 & 0.430356 \tabularnewline
48 & -0.153167 & -1.1765 & 0.122061 \tabularnewline
\hline
\end{tabular}
%Source: https://freestatistics.org/blog/index.php?pk=&T=2

[TABLE]
[ROW][C]Partial Autocorrelation Function[/C][/ROW]
[ROW][C]Time lag k[/C][C]PACF(k)[/C][C]T-STAT[/C][C]P-value[/C][/ROW]
[ROW][C]1[/C][C]0.107365[/C][C]0.8247[/C][C]0.206435[/C][/ROW]
[ROW][C]2[/C][C]-0.315992[/C][C]-2.4272[/C][C]0.009144[/C][/ROW]
[ROW][C]3[/C][C]0.075047[/C][C]0.5764[/C][C]0.283253[/C][/ROW]
[ROW][C]4[/C][C]-0.052897[/C][C]-0.4063[/C][C]0.342993[/C][/ROW]
[ROW][C]5[/C][C]-0.056429[/C][C]-0.4334[/C][C]0.333137[/C][/ROW]
[ROW][C]6[/C][C]-0.16257[/C][C]-1.2487[/C][C]0.108349[/C][/ROW]
[ROW][C]7[/C][C]-0.128365[/C][C]-0.986[/C][C]0.164081[/C][/ROW]
[ROW][C]8[/C][C]-0.058972[/C][C]-0.453[/C][C]0.326114[/C][/ROW]
[ROW][C]9[/C][C]-0.092439[/C][C]-0.71[/C][C]0.24024[/C][/ROW]
[ROW][C]10[/C][C]-0.332064[/C][C]-2.5506[/C][C]0.006684[/C][/ROW]
[ROW][C]11[/C][C]0.162095[/C][C]1.2451[/C][C]0.109013[/C][/ROW]
[ROW][C]12[/C][C]0.487208[/C][C]3.7423[/C][C]0.000208[/C][/ROW]
[ROW][C]13[/C][C]-0.049327[/C][C]-0.3789[/C][C]0.353065[/C][/ROW]
[ROW][C]14[/C][C]0.03024[/C][C]0.2323[/C][C]0.408563[/C][/ROW]
[ROW][C]15[/C][C]-0.184661[/C][C]-1.4184[/C][C]0.080667[/C][/ROW]
[ROW][C]16[/C][C]-0.02441[/C][C]-0.1875[/C][C]0.425959[/C][/ROW]
[ROW][C]17[/C][C]-0.257073[/C][C]-1.9746[/C][C]0.026499[/C][/ROW]
[ROW][C]18[/C][C]0.003172[/C][C]0.0244[/C][C]0.490321[/C][/ROW]
[ROW][C]19[/C][C]0.00997[/C][C]0.0766[/C][C]0.469607[/C][/ROW]
[ROW][C]20[/C][C]-0.012489[/C][C]-0.0959[/C][C]0.46195[/C][/ROW]
[ROW][C]21[/C][C]-0.033577[/C][C]-0.2579[/C][C]0.398688[/C][/ROW]
[ROW][C]22[/C][C]0.055514[/C][C]0.4264[/C][C]0.335679[/C][/ROW]
[ROW][C]23[/C][C]-0.015583[/C][C]-0.1197[/C][C]0.452564[/C][/ROW]
[ROW][C]24[/C][C]0.129227[/C][C]0.9926[/C][C]0.162477[/C][/ROW]
[ROW][C]25[/C][C]-0.051549[/C][C]-0.396[/C][C]0.346782[/C][/ROW]
[ROW][C]26[/C][C]-0.05903[/C][C]-0.4534[/C][C]0.325955[/C][/ROW]
[ROW][C]27[/C][C]0.016285[/C][C]0.1251[/C][C]0.45044[/C][/ROW]
[ROW][C]28[/C][C]-0.028366[/C][C]-0.2179[/C][C]0.414136[/C][/ROW]
[ROW][C]29[/C][C]0.077[/C][C]0.5914[/C][C]0.27824[/C][/ROW]
[ROW][C]30[/C][C]0.007647[/C][C]0.0587[/C][C]0.476681[/C][/ROW]
[ROW][C]31[/C][C]-0.063899[/C][C]-0.4908[/C][C]0.312687[/C][/ROW]
[ROW][C]32[/C][C]-0.07913[/C][C]-0.6078[/C][C]0.272824[/C][/ROW]
[ROW][C]33[/C][C]-0.00703[/C][C]-0.054[/C][C]0.478559[/C][/ROW]
[ROW][C]34[/C][C]-0.08063[/C][C]-0.6193[/C][C]0.269042[/C][/ROW]
[ROW][C]35[/C][C]-0.119413[/C][C]-0.9172[/C][C]0.181379[/C][/ROW]
[ROW][C]36[/C][C]-0.107905[/C][C]-0.8288[/C][C]0.205269[/C][/ROW]
[ROW][C]37[/C][C]-0.023137[/C][C]-0.1777[/C][C]0.429777[/C][/ROW]
[ROW][C]38[/C][C]0.030152[/C][C]0.2316[/C][C]0.408825[/C][/ROW]
[ROW][C]39[/C][C]0.014746[/C][C]0.1133[/C][C]0.455103[/C][/ROW]
[ROW][C]40[/C][C]0.027005[/C][C]0.2074[/C][C]0.418194[/C][/ROW]
[ROW][C]41[/C][C]0.065749[/C][C]0.505[/C][C]0.307711[/C][/ROW]
[ROW][C]42[/C][C]0.014483[/C][C]0.1112[/C][C]0.455901[/C][/ROW]
[ROW][C]43[/C][C]0.110145[/C][C]0.846[/C][C]0.200474[/C][/ROW]
[ROW][C]44[/C][C]0.037388[/C][C]0.2872[/C][C]0.387491[/C][/ROW]
[ROW][C]45[/C][C]0.007082[/C][C]0.0544[/C][C]0.478401[/C][/ROW]
[ROW][C]46[/C][C]2.7e-05[/C][C]2e-04[/C][C]0.499916[/C][/ROW]
[ROW][C]47[/C][C]0.022944[/C][C]0.1762[/C][C]0.430356[/C][/ROW]
[ROW][C]48[/C][C]-0.153167[/C][C]-1.1765[/C][C]0.122061[/C][/ROW]
[/TABLE]
Source: https://freestatistics.org/blog/index.php?pk=&T=2

Globally Unique Identifier (entire table): ba.freestatistics.org/blog/index.php?pk=&T=2

As an alternative you can also use a QR Code:  

The GUIDs for individual cells are displayed in the table below:

Partial Autocorrelation Function
Time lag kPACF(k)T-STATP-value
10.1073650.82470.206435
2-0.315992-2.42720.009144
30.0750470.57640.283253
4-0.052897-0.40630.342993
5-0.056429-0.43340.333137
6-0.16257-1.24870.108349
7-0.128365-0.9860.164081
8-0.058972-0.4530.326114
9-0.092439-0.710.24024
10-0.332064-2.55060.006684
110.1620951.24510.109013
120.4872083.74230.000208
13-0.049327-0.37890.353065
140.030240.23230.408563
15-0.184661-1.41840.080667
16-0.02441-0.18750.425959
17-0.257073-1.97460.026499
180.0031720.02440.490321
190.009970.07660.469607
20-0.012489-0.09590.46195
21-0.033577-0.25790.398688
220.0555140.42640.335679
23-0.015583-0.11970.452564
240.1292270.99260.162477
25-0.051549-0.3960.346782
26-0.05903-0.45340.325955
270.0162850.12510.45044
28-0.028366-0.21790.414136
290.0770.59140.27824
300.0076470.05870.476681
31-0.063899-0.49080.312687
32-0.07913-0.60780.272824
33-0.00703-0.0540.478559
34-0.08063-0.61930.269042
35-0.119413-0.91720.181379
36-0.107905-0.82880.205269
37-0.023137-0.17770.429777
380.0301520.23160.408825
390.0147460.11330.455103
400.0270050.20740.418194
410.0657490.5050.307711
420.0144830.11120.455901
430.1101450.8460.200474
440.0373880.28720.387491
450.0070820.05440.478401
462.7e-052e-040.499916
470.0229440.17620.430356
48-0.153167-1.17650.122061


Parameters (Session):
par1 = 48 ; par2 = 1 ; par3 = 1 ; par4 = 0 ; par5 = 12 ; par6 = White Noise ; par7 = 0.95 ;
Parameters (R input):
par1 = 48 ; par2 = 1 ; par3 = 1 ; par4 = 0 ; par5 = 12 ; par6 = White Noise ; par7 = 0.95 ; par8 = ;
R code (references can be found in the software module):
if (par1 == 'Default') {
par1 = 10*log10(length(x))
} else {
par1 <- as.numeric(par1)
}
par2 <- as.numeric(par2)
par3 <- as.numeric(par3)
par4 <- as.numeric(par4)
par5 <- as.numeric(par5)
if (par6 == 'White Noise') par6 <- 'white' else par6 <- 'ma'
par7 <- as.numeric(par7)
if (par8 != '') par8 <- as.numeric(par8)
x <- na.omit(x)
ox <- x
if (par8 == '') {
if (par2 == 0) {
x <- log(x)
} else {
x <- (x ^ par2 - 1) / par2
}
} else {
x <- log(x,base=par8)
}
if (par3 > 0) x <- diff(x,lag=1,difference=par3)
if (par4 > 0) x <- diff(x,lag=par5,difference=par4)
bitmap(file='picts.png')
op <- par(mfrow=c(2,1))
plot(ox,type='l',main='Original Time Series',xlab='time',ylab='value')
if (par8=='') {
mytitle <- paste('Working Time Series (lambda=',par2,', d=',par3,', D=',par4,')',sep='')
mysub <- paste('(lambda=',par2,', d=',par3,', D=',par4,', CI=', par7, ', CI type=',par6,')',sep='')
} else {
mytitle <- paste('Working Time Series (base=',par8,', d=',par3,', D=',par4,')',sep='')
mysub <- paste('(base=',par8,', d=',par3,', D=',par4,', CI=', par7, ', CI type=',par6,')',sep='')
}
plot(x,type='l', main=mytitle,xlab='time',ylab='value')
par(op)
dev.off()
bitmap(file='pic1.png')
racf <- acf(x, par1, main='Autocorrelation', xlab='time lag', ylab='ACF', ci.type=par6, ci=par7, sub=mysub)
dev.off()
bitmap(file='pic2.png')
rpacf <- pacf(x,par1,main='Partial Autocorrelation',xlab='lags',ylab='PACF',sub=mysub)
dev.off()
(myacf <- c(racf$acf))
(mypacf <- c(rpacf$acf))
lengthx <- length(x)
sqrtn <- sqrt(lengthx)
load(file='createtable')
a<-table.start()
a<-table.row.start(a)
a<-table.element(a,'Autocorrelation Function',4,TRUE)
a<-table.row.end(a)
a<-table.row.start(a)
a<-table.element(a,'Time lag k',header=TRUE)
a<-table.element(a,hyperlink('basics.htm','ACF(k)','click here for more information about the Autocorrelation Function'),header=TRUE)
a<-table.element(a,'T-STAT',header=TRUE)
a<-table.element(a,'P-value',header=TRUE)
a<-table.row.end(a)
for (i in 2:(par1+1)) {
a<-table.row.start(a)
a<-table.element(a,i-1,header=TRUE)
a<-table.element(a,round(myacf[i],6))
mytstat <- myacf[i]*sqrtn
a<-table.element(a,round(mytstat,4))
a<-table.element(a,round(1-pt(abs(mytstat),lengthx),6))
a<-table.row.end(a)
}
a<-table.end(a)
table.save(a,file='mytable.tab')
a<-table.start()
a<-table.row.start(a)
a<-table.element(a,'Partial Autocorrelation Function',4,TRUE)
a<-table.row.end(a)
a<-table.row.start(a)
a<-table.element(a,'Time lag k',header=TRUE)
a<-table.element(a,hyperlink('basics.htm','PACF(k)','click here for more information about the Partial Autocorrelation Function'),header=TRUE)
a<-table.element(a,'T-STAT',header=TRUE)
a<-table.element(a,'P-value',header=TRUE)
a<-table.row.end(a)
for (i in 1:par1) {
a<-table.row.start(a)
a<-table.element(a,i,header=TRUE)
a<-table.element(a,round(mypacf[i],6))
mytstat <- mypacf[i]*sqrtn
a<-table.element(a,round(mytstat,4))
a<-table.element(a,round(1-pt(abs(mytstat),lengthx),6))
a<-table.row.end(a)
}
a<-table.end(a)
table.save(a,file='mytable1.tab')