Free Statistics

of Irreproducible Research!

Author's title

Author*Unverified author*
R Software Modulerwasp_autocorrelation.wasp
Title produced by software(Partial) Autocorrelation Function
Date of computationTue, 18 Oct 2016 17:02:15 +0100
Cite this page as followsStatistical Computations at FreeStatistics.org, Office for Research Development and Education, URL https://freestatistics.org/blog/index.php?v=date/2016/Oct/18/t147680657058o621bxzw069id.htm/, Retrieved Sat, 27 Apr 2024 16:32:16 +0200
Statistical Computations at FreeStatistics.org, Office for Research Development and Education, URL https://freestatistics.org/blog/index.php?pk=, Retrieved Sat, 27 Apr 2024 16:32:16 +0200
QR Codes:

Original text written by user:
IsPrivate?No (this computation is public)
User-defined keywords
Estimated Impact0
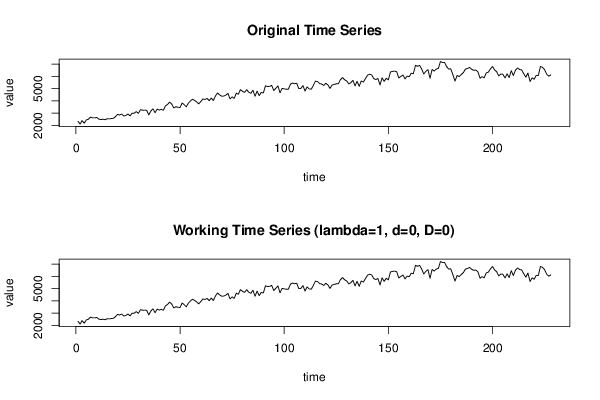
Dataseries X:
2341
2115
2402
2180
2453
2507
2679
2622
2618
2648
2523
2473
2513
2466
2544
2537
2564
2582
2716
2904
2851
2932
2772
2811
2935
2783
3003
2995
3127
2985
3287
3236
3252
3228
2856
3176
3362
3036
3330
3251
3318
3238
3597
3708
3902
3745
3426
3526
3483
3458
3824
3696
3518
3814
3996
4136
4037
3915
3760
3955
4160
4115
4202
4018
4233
4029
4401
4645
4491
4379
4394
4472
4614
4160
4328
4202
4635
4542
4920
4774
4698
4916
4703
4616
4873
4375
4801
4427
4684
4648
5225
5174
5181
5266
4839
5032
5221
4658
5014
4980
4952
4946
5365
5456
5397
5436
4995
5019
5249
4799
5137
4979
4951
5265
5612
5572
5403
5373
5252
5437
5296
5011
5294
5335
5398
5396
5724
5898
5718
5625
5380
5488
5678
5224
5596
5184
5620
5531
5816
6086
6175
6112
5813
5740
5821
5294
5881
5589
5845
5706
6355
6404
6426
6375
5869
5994
6105
5792
6011
5968
6255
6208
6897
6814
6897
6596
6188
6406
6548
5842
6555
6424
6596
6645
7203
7128
7133
6778
6593
6591
6120
5612
6070
5983
6145
6303
6588
6640
6719
6575
6487
6510
6365
5844
5974
5880
6279
6342
6598
6801
6529
6369
6028
6187
6164
5866
6198
5898
6462
6063
6496
6678
6554
6513
6210
5928
6268
5582
5869
5764
6082
6062
6810
6727
6537
6175
6014
6109


Summary of computational transaction
Raw Inputview raw input (R code)
Raw Outputview raw output of R engine
Computing time2 seconds
R Server'Sir Ronald Aylmer Fisher' @ fisher.wessa.net

\begin{tabular}{lllllllll}
\hline
Summary of computational transaction \tabularnewline
Raw Input & view raw input (R code)  \tabularnewline
Raw Output & view raw output of R engine  \tabularnewline
Computing time & 2 seconds \tabularnewline
R Server & 'Sir Ronald Aylmer Fisher' @ fisher.wessa.net \tabularnewline
\hline
\end{tabular}
%Source: https://freestatistics.org/blog/index.php?pk=&T=0

[TABLE]
[ROW][C]Summary of computational transaction[/C][/ROW]
[ROW][C]Raw Input[/C][C]view raw input (R code) [/C][/ROW]
[ROW][C]Raw Output[/C][C]view raw output of R engine [/C][/ROW]
[ROW][C]Computing time[/C][C]2 seconds[/C][/ROW]
[ROW][C]R Server[/C][C]'Sir Ronald Aylmer Fisher' @ fisher.wessa.net[/C][/ROW]
[/TABLE]
Source: https://freestatistics.org/blog/index.php?pk=&T=0

Globally Unique Identifier (entire table): ba.freestatistics.org/blog/index.php?pk=&T=0

As an alternative you can also use a QR Code:  

The GUIDs for individual cells are displayed in the table below:

Summary of computational transaction
Raw Inputview raw input (R code)
Raw Outputview raw output of R engine
Computing time2 seconds
R Server'Sir Ronald Aylmer Fisher' @ fisher.wessa.net


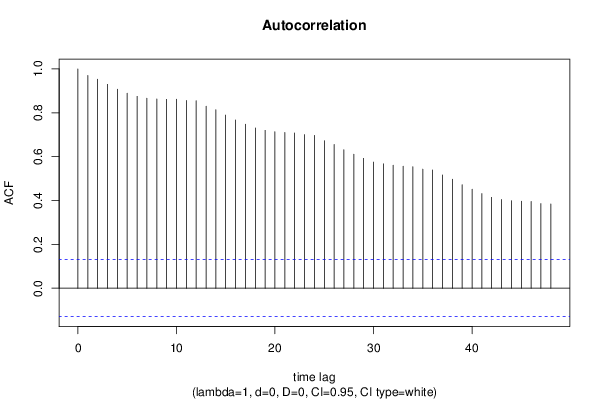
Autocorrelation Function
Time lag kACF(k)T-STATP-value
10.97053614.65480
20.95325414.39380
30.92970114.03820
40.90766913.70550
50.88923813.42720
60.87513.21220
70.86662213.08570
80.8630813.03220
90.86139813.00680
100.86169613.01130
110.8558312.92280
120.85517812.91290
130.82976112.52910
140.81427112.29520
150.78957711.92230
160.76733411.58650
170.74803111.2950
180.73071411.03350
190.72004610.87250
200.71378710.77790
210.7100610.72170
220.70801910.69080
230.7003410.57490
240.69692410.52330
250.67220410.15010
260.6552999.89480
270.6313699.53350
280.6112539.22970
290.5921058.94060
300.5750118.68250
310.5670258.56190
320.561058.47170
330.5565618.40390
340.5542248.36860
350.5429538.19840
360.5394018.14480
370.5160337.79190
380.4966377.49910
390.4722477.13080
400.4512136.81320
410.4314786.51520
420.4144156.25750
430.404966.11480
440.3990456.02540
450.3964515.98630
460.3956395.9740
470.3856555.82330
480.383855.7960

\begin{tabular}{lllllllll}
\hline
Autocorrelation Function \tabularnewline
Time lag k & ACF(k) & T-STAT & P-value \tabularnewline
1 & 0.970536 & 14.6548 & 0 \tabularnewline
2 & 0.953254 & 14.3938 & 0 \tabularnewline
3 & 0.929701 & 14.0382 & 0 \tabularnewline
4 & 0.907669 & 13.7055 & 0 \tabularnewline
5 & 0.889238 & 13.4272 & 0 \tabularnewline
6 & 0.875 & 13.2122 & 0 \tabularnewline
7 & 0.866622 & 13.0857 & 0 \tabularnewline
8 & 0.86308 & 13.0322 & 0 \tabularnewline
9 & 0.861398 & 13.0068 & 0 \tabularnewline
10 & 0.861696 & 13.0113 & 0 \tabularnewline
11 & 0.85583 & 12.9228 & 0 \tabularnewline
12 & 0.855178 & 12.9129 & 0 \tabularnewline
13 & 0.829761 & 12.5291 & 0 \tabularnewline
14 & 0.814271 & 12.2952 & 0 \tabularnewline
15 & 0.789577 & 11.9223 & 0 \tabularnewline
16 & 0.767334 & 11.5865 & 0 \tabularnewline
17 & 0.748031 & 11.295 & 0 \tabularnewline
18 & 0.730714 & 11.0335 & 0 \tabularnewline
19 & 0.720046 & 10.8725 & 0 \tabularnewline
20 & 0.713787 & 10.7779 & 0 \tabularnewline
21 & 0.71006 & 10.7217 & 0 \tabularnewline
22 & 0.708019 & 10.6908 & 0 \tabularnewline
23 & 0.70034 & 10.5749 & 0 \tabularnewline
24 & 0.696924 & 10.5233 & 0 \tabularnewline
25 & 0.672204 & 10.1501 & 0 \tabularnewline
26 & 0.655299 & 9.8948 & 0 \tabularnewline
27 & 0.631369 & 9.5335 & 0 \tabularnewline
28 & 0.611253 & 9.2297 & 0 \tabularnewline
29 & 0.592105 & 8.9406 & 0 \tabularnewline
30 & 0.575011 & 8.6825 & 0 \tabularnewline
31 & 0.567025 & 8.5619 & 0 \tabularnewline
32 & 0.56105 & 8.4717 & 0 \tabularnewline
33 & 0.556561 & 8.4039 & 0 \tabularnewline
34 & 0.554224 & 8.3686 & 0 \tabularnewline
35 & 0.542953 & 8.1984 & 0 \tabularnewline
36 & 0.539401 & 8.1448 & 0 \tabularnewline
37 & 0.516033 & 7.7919 & 0 \tabularnewline
38 & 0.496637 & 7.4991 & 0 \tabularnewline
39 & 0.472247 & 7.1308 & 0 \tabularnewline
40 & 0.451213 & 6.8132 & 0 \tabularnewline
41 & 0.431478 & 6.5152 & 0 \tabularnewline
42 & 0.414415 & 6.2575 & 0 \tabularnewline
43 & 0.40496 & 6.1148 & 0 \tabularnewline
44 & 0.399045 & 6.0254 & 0 \tabularnewline
45 & 0.396451 & 5.9863 & 0 \tabularnewline
46 & 0.395639 & 5.974 & 0 \tabularnewline
47 & 0.385655 & 5.8233 & 0 \tabularnewline
48 & 0.38385 & 5.796 & 0 \tabularnewline
\hline
\end{tabular}
%Source: https://freestatistics.org/blog/index.php?pk=&T=1

[TABLE]
[ROW][C]Autocorrelation Function[/C][/ROW]
[ROW][C]Time lag k[/C][C]ACF(k)[/C][C]T-STAT[/C][C]P-value[/C][/ROW]
[ROW][C]1[/C][C]0.970536[/C][C]14.6548[/C][C]0[/C][/ROW]
[ROW][C]2[/C][C]0.953254[/C][C]14.3938[/C][C]0[/C][/ROW]
[ROW][C]3[/C][C]0.929701[/C][C]14.0382[/C][C]0[/C][/ROW]
[ROW][C]4[/C][C]0.907669[/C][C]13.7055[/C][C]0[/C][/ROW]
[ROW][C]5[/C][C]0.889238[/C][C]13.4272[/C][C]0[/C][/ROW]
[ROW][C]6[/C][C]0.875[/C][C]13.2122[/C][C]0[/C][/ROW]
[ROW][C]7[/C][C]0.866622[/C][C]13.0857[/C][C]0[/C][/ROW]
[ROW][C]8[/C][C]0.86308[/C][C]13.0322[/C][C]0[/C][/ROW]
[ROW][C]9[/C][C]0.861398[/C][C]13.0068[/C][C]0[/C][/ROW]
[ROW][C]10[/C][C]0.861696[/C][C]13.0113[/C][C]0[/C][/ROW]
[ROW][C]11[/C][C]0.85583[/C][C]12.9228[/C][C]0[/C][/ROW]
[ROW][C]12[/C][C]0.855178[/C][C]12.9129[/C][C]0[/C][/ROW]
[ROW][C]13[/C][C]0.829761[/C][C]12.5291[/C][C]0[/C][/ROW]
[ROW][C]14[/C][C]0.814271[/C][C]12.2952[/C][C]0[/C][/ROW]
[ROW][C]15[/C][C]0.789577[/C][C]11.9223[/C][C]0[/C][/ROW]
[ROW][C]16[/C][C]0.767334[/C][C]11.5865[/C][C]0[/C][/ROW]
[ROW][C]17[/C][C]0.748031[/C][C]11.295[/C][C]0[/C][/ROW]
[ROW][C]18[/C][C]0.730714[/C][C]11.0335[/C][C]0[/C][/ROW]
[ROW][C]19[/C][C]0.720046[/C][C]10.8725[/C][C]0[/C][/ROW]
[ROW][C]20[/C][C]0.713787[/C][C]10.7779[/C][C]0[/C][/ROW]
[ROW][C]21[/C][C]0.71006[/C][C]10.7217[/C][C]0[/C][/ROW]
[ROW][C]22[/C][C]0.708019[/C][C]10.6908[/C][C]0[/C][/ROW]
[ROW][C]23[/C][C]0.70034[/C][C]10.5749[/C][C]0[/C][/ROW]
[ROW][C]24[/C][C]0.696924[/C][C]10.5233[/C][C]0[/C][/ROW]
[ROW][C]25[/C][C]0.672204[/C][C]10.1501[/C][C]0[/C][/ROW]
[ROW][C]26[/C][C]0.655299[/C][C]9.8948[/C][C]0[/C][/ROW]
[ROW][C]27[/C][C]0.631369[/C][C]9.5335[/C][C]0[/C][/ROW]
[ROW][C]28[/C][C]0.611253[/C][C]9.2297[/C][C]0[/C][/ROW]
[ROW][C]29[/C][C]0.592105[/C][C]8.9406[/C][C]0[/C][/ROW]
[ROW][C]30[/C][C]0.575011[/C][C]8.6825[/C][C]0[/C][/ROW]
[ROW][C]31[/C][C]0.567025[/C][C]8.5619[/C][C]0[/C][/ROW]
[ROW][C]32[/C][C]0.56105[/C][C]8.4717[/C][C]0[/C][/ROW]
[ROW][C]33[/C][C]0.556561[/C][C]8.4039[/C][C]0[/C][/ROW]
[ROW][C]34[/C][C]0.554224[/C][C]8.3686[/C][C]0[/C][/ROW]
[ROW][C]35[/C][C]0.542953[/C][C]8.1984[/C][C]0[/C][/ROW]
[ROW][C]36[/C][C]0.539401[/C][C]8.1448[/C][C]0[/C][/ROW]
[ROW][C]37[/C][C]0.516033[/C][C]7.7919[/C][C]0[/C][/ROW]
[ROW][C]38[/C][C]0.496637[/C][C]7.4991[/C][C]0[/C][/ROW]
[ROW][C]39[/C][C]0.472247[/C][C]7.1308[/C][C]0[/C][/ROW]
[ROW][C]40[/C][C]0.451213[/C][C]6.8132[/C][C]0[/C][/ROW]
[ROW][C]41[/C][C]0.431478[/C][C]6.5152[/C][C]0[/C][/ROW]
[ROW][C]42[/C][C]0.414415[/C][C]6.2575[/C][C]0[/C][/ROW]
[ROW][C]43[/C][C]0.40496[/C][C]6.1148[/C][C]0[/C][/ROW]
[ROW][C]44[/C][C]0.399045[/C][C]6.0254[/C][C]0[/C][/ROW]
[ROW][C]45[/C][C]0.396451[/C][C]5.9863[/C][C]0[/C][/ROW]
[ROW][C]46[/C][C]0.395639[/C][C]5.974[/C][C]0[/C][/ROW]
[ROW][C]47[/C][C]0.385655[/C][C]5.8233[/C][C]0[/C][/ROW]
[ROW][C]48[/C][C]0.38385[/C][C]5.796[/C][C]0[/C][/ROW]
[/TABLE]
Source: https://freestatistics.org/blog/index.php?pk=&T=1

Globally Unique Identifier (entire table): ba.freestatistics.org/blog/index.php?pk=&T=1

As an alternative you can also use a QR Code:  

The GUIDs for individual cells are displayed in the table below:

Autocorrelation Function
Time lag kACF(k)T-STATP-value
10.97053614.65480
20.95325414.39380
30.92970114.03820
40.90766913.70550
50.88923813.42720
60.87513.21220
70.86662213.08570
80.8630813.03220
90.86139813.00680
100.86169613.01130
110.8558312.92280
120.85517812.91290
130.82976112.52910
140.81427112.29520
150.78957711.92230
160.76733411.58650
170.74803111.2950
180.73071411.03350
190.72004610.87250
200.71378710.77790
210.7100610.72170
220.70801910.69080
230.7003410.57490
240.69692410.52330
250.67220410.15010
260.6552999.89480
270.6313699.53350
280.6112539.22970
290.5921058.94060
300.5750118.68250
310.5670258.56190
320.561058.47170
330.5565618.40390
340.5542248.36860
350.5429538.19840
360.5394018.14480
370.5160337.79190
380.4966377.49910
390.4722477.13080
400.4512136.81320
410.4314786.51520
420.4144156.25750
430.404966.11480
440.3990456.02540
450.3964515.98630
460.3956395.9740
470.3856555.82330
480.383855.7960


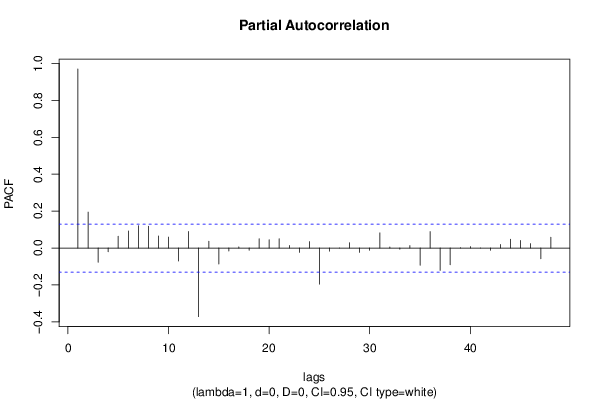
Partial Autocorrelation Function
Time lag kPACF(k)T-STATP-value
10.97053614.65480
20.1948552.94220.001797
3-0.077118-1.16450.122729
4-0.02046-0.30890.378823
50.0641420.96850.166906
60.0920371.38970.082983
70.1206511.82180.034899
80.1178511.77950.038244
90.0655440.98970.161686
100.0592790.89510.18584
11-0.070239-1.06060.145001
120.0898561.35680.088094
13-0.371711-5.61270
140.0366350.55320.29034
15-0.086676-1.30880.095965
16-0.016175-0.24420.403636
170.0062820.09490.462255
18-0.01199-0.1810.428245
190.0503880.76080.22377
200.0452320.6830.247653
210.0502640.7590.224327
220.0138020.20840.41755
23-0.023636-0.35690.360748
240.0349280.52740.299215
25-0.195565-2.9530.001738
26-0.016899-0.25520.399411
270.000470.00710.49717
280.0285680.43140.333305
29-0.023588-0.35620.361023
30-0.012287-0.18550.426492
310.0823761.24390.107415
320.0061910.09350.462803
33-0.006595-0.09960.46038
340.0133370.20140.420287
35-0.093612-1.41350.079435
360.0891711.34640.089748
37-0.120979-1.82670.034523
38-0.090177-1.36160.087328
390.0019640.02970.488185
400.0078040.11780.453149
41-0.00017-0.00260.498977
42-0.011931-0.18010.428599
430.019550.29520.384055
440.0479190.72360.235039
450.0410790.62030.267845
460.0241850.36520.357657
47-0.057874-0.87390.191554
480.0585170.88360.188926

\begin{tabular}{lllllllll}
\hline
Partial Autocorrelation Function \tabularnewline
Time lag k & PACF(k) & T-STAT & P-value \tabularnewline
1 & 0.970536 & 14.6548 & 0 \tabularnewline
2 & 0.194855 & 2.9422 & 0.001797 \tabularnewline
3 & -0.077118 & -1.1645 & 0.122729 \tabularnewline
4 & -0.02046 & -0.3089 & 0.378823 \tabularnewline
5 & 0.064142 & 0.9685 & 0.166906 \tabularnewline
6 & 0.092037 & 1.3897 & 0.082983 \tabularnewline
7 & 0.120651 & 1.8218 & 0.034899 \tabularnewline
8 & 0.117851 & 1.7795 & 0.038244 \tabularnewline
9 & 0.065544 & 0.9897 & 0.161686 \tabularnewline
10 & 0.059279 & 0.8951 & 0.18584 \tabularnewline
11 & -0.070239 & -1.0606 & 0.145001 \tabularnewline
12 & 0.089856 & 1.3568 & 0.088094 \tabularnewline
13 & -0.371711 & -5.6127 & 0 \tabularnewline
14 & 0.036635 & 0.5532 & 0.29034 \tabularnewline
15 & -0.086676 & -1.3088 & 0.095965 \tabularnewline
16 & -0.016175 & -0.2442 & 0.403636 \tabularnewline
17 & 0.006282 & 0.0949 & 0.462255 \tabularnewline
18 & -0.01199 & -0.181 & 0.428245 \tabularnewline
19 & 0.050388 & 0.7608 & 0.22377 \tabularnewline
20 & 0.045232 & 0.683 & 0.247653 \tabularnewline
21 & 0.050264 & 0.759 & 0.224327 \tabularnewline
22 & 0.013802 & 0.2084 & 0.41755 \tabularnewline
23 & -0.023636 & -0.3569 & 0.360748 \tabularnewline
24 & 0.034928 & 0.5274 & 0.299215 \tabularnewline
25 & -0.195565 & -2.953 & 0.001738 \tabularnewline
26 & -0.016899 & -0.2552 & 0.399411 \tabularnewline
27 & 0.00047 & 0.0071 & 0.49717 \tabularnewline
28 & 0.028568 & 0.4314 & 0.333305 \tabularnewline
29 & -0.023588 & -0.3562 & 0.361023 \tabularnewline
30 & -0.012287 & -0.1855 & 0.426492 \tabularnewline
31 & 0.082376 & 1.2439 & 0.107415 \tabularnewline
32 & 0.006191 & 0.0935 & 0.462803 \tabularnewline
33 & -0.006595 & -0.0996 & 0.46038 \tabularnewline
34 & 0.013337 & 0.2014 & 0.420287 \tabularnewline
35 & -0.093612 & -1.4135 & 0.079435 \tabularnewline
36 & 0.089171 & 1.3464 & 0.089748 \tabularnewline
37 & -0.120979 & -1.8267 & 0.034523 \tabularnewline
38 & -0.090177 & -1.3616 & 0.087328 \tabularnewline
39 & 0.001964 & 0.0297 & 0.488185 \tabularnewline
40 & 0.007804 & 0.1178 & 0.453149 \tabularnewline
41 & -0.00017 & -0.0026 & 0.498977 \tabularnewline
42 & -0.011931 & -0.1801 & 0.428599 \tabularnewline
43 & 0.01955 & 0.2952 & 0.384055 \tabularnewline
44 & 0.047919 & 0.7236 & 0.235039 \tabularnewline
45 & 0.041079 & 0.6203 & 0.267845 \tabularnewline
46 & 0.024185 & 0.3652 & 0.357657 \tabularnewline
47 & -0.057874 & -0.8739 & 0.191554 \tabularnewline
48 & 0.058517 & 0.8836 & 0.188926 \tabularnewline
\hline
\end{tabular}
%Source: https://freestatistics.org/blog/index.php?pk=&T=2

[TABLE]
[ROW][C]Partial Autocorrelation Function[/C][/ROW]
[ROW][C]Time lag k[/C][C]PACF(k)[/C][C]T-STAT[/C][C]P-value[/C][/ROW]
[ROW][C]1[/C][C]0.970536[/C][C]14.6548[/C][C]0[/C][/ROW]
[ROW][C]2[/C][C]0.194855[/C][C]2.9422[/C][C]0.001797[/C][/ROW]
[ROW][C]3[/C][C]-0.077118[/C][C]-1.1645[/C][C]0.122729[/C][/ROW]
[ROW][C]4[/C][C]-0.02046[/C][C]-0.3089[/C][C]0.378823[/C][/ROW]
[ROW][C]5[/C][C]0.064142[/C][C]0.9685[/C][C]0.166906[/C][/ROW]
[ROW][C]6[/C][C]0.092037[/C][C]1.3897[/C][C]0.082983[/C][/ROW]
[ROW][C]7[/C][C]0.120651[/C][C]1.8218[/C][C]0.034899[/C][/ROW]
[ROW][C]8[/C][C]0.117851[/C][C]1.7795[/C][C]0.038244[/C][/ROW]
[ROW][C]9[/C][C]0.065544[/C][C]0.9897[/C][C]0.161686[/C][/ROW]
[ROW][C]10[/C][C]0.059279[/C][C]0.8951[/C][C]0.18584[/C][/ROW]
[ROW][C]11[/C][C]-0.070239[/C][C]-1.0606[/C][C]0.145001[/C][/ROW]
[ROW][C]12[/C][C]0.089856[/C][C]1.3568[/C][C]0.088094[/C][/ROW]
[ROW][C]13[/C][C]-0.371711[/C][C]-5.6127[/C][C]0[/C][/ROW]
[ROW][C]14[/C][C]0.036635[/C][C]0.5532[/C][C]0.29034[/C][/ROW]
[ROW][C]15[/C][C]-0.086676[/C][C]-1.3088[/C][C]0.095965[/C][/ROW]
[ROW][C]16[/C][C]-0.016175[/C][C]-0.2442[/C][C]0.403636[/C][/ROW]
[ROW][C]17[/C][C]0.006282[/C][C]0.0949[/C][C]0.462255[/C][/ROW]
[ROW][C]18[/C][C]-0.01199[/C][C]-0.181[/C][C]0.428245[/C][/ROW]
[ROW][C]19[/C][C]0.050388[/C][C]0.7608[/C][C]0.22377[/C][/ROW]
[ROW][C]20[/C][C]0.045232[/C][C]0.683[/C][C]0.247653[/C][/ROW]
[ROW][C]21[/C][C]0.050264[/C][C]0.759[/C][C]0.224327[/C][/ROW]
[ROW][C]22[/C][C]0.013802[/C][C]0.2084[/C][C]0.41755[/C][/ROW]
[ROW][C]23[/C][C]-0.023636[/C][C]-0.3569[/C][C]0.360748[/C][/ROW]
[ROW][C]24[/C][C]0.034928[/C][C]0.5274[/C][C]0.299215[/C][/ROW]
[ROW][C]25[/C][C]-0.195565[/C][C]-2.953[/C][C]0.001738[/C][/ROW]
[ROW][C]26[/C][C]-0.016899[/C][C]-0.2552[/C][C]0.399411[/C][/ROW]
[ROW][C]27[/C][C]0.00047[/C][C]0.0071[/C][C]0.49717[/C][/ROW]
[ROW][C]28[/C][C]0.028568[/C][C]0.4314[/C][C]0.333305[/C][/ROW]
[ROW][C]29[/C][C]-0.023588[/C][C]-0.3562[/C][C]0.361023[/C][/ROW]
[ROW][C]30[/C][C]-0.012287[/C][C]-0.1855[/C][C]0.426492[/C][/ROW]
[ROW][C]31[/C][C]0.082376[/C][C]1.2439[/C][C]0.107415[/C][/ROW]
[ROW][C]32[/C][C]0.006191[/C][C]0.0935[/C][C]0.462803[/C][/ROW]
[ROW][C]33[/C][C]-0.006595[/C][C]-0.0996[/C][C]0.46038[/C][/ROW]
[ROW][C]34[/C][C]0.013337[/C][C]0.2014[/C][C]0.420287[/C][/ROW]
[ROW][C]35[/C][C]-0.093612[/C][C]-1.4135[/C][C]0.079435[/C][/ROW]
[ROW][C]36[/C][C]0.089171[/C][C]1.3464[/C][C]0.089748[/C][/ROW]
[ROW][C]37[/C][C]-0.120979[/C][C]-1.8267[/C][C]0.034523[/C][/ROW]
[ROW][C]38[/C][C]-0.090177[/C][C]-1.3616[/C][C]0.087328[/C][/ROW]
[ROW][C]39[/C][C]0.001964[/C][C]0.0297[/C][C]0.488185[/C][/ROW]
[ROW][C]40[/C][C]0.007804[/C][C]0.1178[/C][C]0.453149[/C][/ROW]
[ROW][C]41[/C][C]-0.00017[/C][C]-0.0026[/C][C]0.498977[/C][/ROW]
[ROW][C]42[/C][C]-0.011931[/C][C]-0.1801[/C][C]0.428599[/C][/ROW]
[ROW][C]43[/C][C]0.01955[/C][C]0.2952[/C][C]0.384055[/C][/ROW]
[ROW][C]44[/C][C]0.047919[/C][C]0.7236[/C][C]0.235039[/C][/ROW]
[ROW][C]45[/C][C]0.041079[/C][C]0.6203[/C][C]0.267845[/C][/ROW]
[ROW][C]46[/C][C]0.024185[/C][C]0.3652[/C][C]0.357657[/C][/ROW]
[ROW][C]47[/C][C]-0.057874[/C][C]-0.8739[/C][C]0.191554[/C][/ROW]
[ROW][C]48[/C][C]0.058517[/C][C]0.8836[/C][C]0.188926[/C][/ROW]
[/TABLE]
Source: https://freestatistics.org/blog/index.php?pk=&T=2

Globally Unique Identifier (entire table): ba.freestatistics.org/blog/index.php?pk=&T=2

As an alternative you can also use a QR Code:  

The GUIDs for individual cells are displayed in the table below:

Partial Autocorrelation Function
Time lag kPACF(k)T-STATP-value
10.97053614.65480
20.1948552.94220.001797
3-0.077118-1.16450.122729
4-0.02046-0.30890.378823
50.0641420.96850.166906
60.0920371.38970.082983
70.1206511.82180.034899
80.1178511.77950.038244
90.0655440.98970.161686
100.0592790.89510.18584
11-0.070239-1.06060.145001
120.0898561.35680.088094
13-0.371711-5.61270
140.0366350.55320.29034
15-0.086676-1.30880.095965
16-0.016175-0.24420.403636
170.0062820.09490.462255
18-0.01199-0.1810.428245
190.0503880.76080.22377
200.0452320.6830.247653
210.0502640.7590.224327
220.0138020.20840.41755
23-0.023636-0.35690.360748
240.0349280.52740.299215
25-0.195565-2.9530.001738
26-0.016899-0.25520.399411
270.000470.00710.49717
280.0285680.43140.333305
29-0.023588-0.35620.361023
30-0.012287-0.18550.426492
310.0823761.24390.107415
320.0061910.09350.462803
33-0.006595-0.09960.46038
340.0133370.20140.420287
35-0.093612-1.41350.079435
360.0891711.34640.089748
37-0.120979-1.82670.034523
38-0.090177-1.36160.087328
390.0019640.02970.488185
400.0078040.11780.453149
41-0.00017-0.00260.498977
42-0.011931-0.18010.428599
430.019550.29520.384055
440.0479190.72360.235039
450.0410790.62030.267845
460.0241850.36520.357657
47-0.057874-0.87390.191554
480.0585170.88360.188926


Parameters (Session):
par1 = 48 ; par2 = 1 ; par3 = 0 ; par4 = 0 ; par5 = 12 ; par6 = White Noise ; par7 = 0.95 ;
Parameters (R input):
par1 = 48 ; par2 = 1 ; par3 = 0 ; par4 = 0 ; par5 = 12 ; par6 = White Noise ; par7 = 0.95 ; par8 = ;
R code (references can be found in the software module):
if (par1 == 'Default') {
par1 = 10*log10(length(x))
} else {
par1 <- as.numeric(par1)
}
par2 <- as.numeric(par2)
par3 <- as.numeric(par3)
par4 <- as.numeric(par4)
par5 <- as.numeric(par5)
if (par6 == 'White Noise') par6 <- 'white' else par6 <- 'ma'
par7 <- as.numeric(par7)
if (par8 != '') par8 <- as.numeric(par8)
x <- na.omit(x)
ox <- x
if (par8 == '') {
if (par2 == 0) {
x <- log(x)
} else {
x <- (x ^ par2 - 1) / par2
}
} else {
x <- log(x,base=par8)
}
if (par3 > 0) x <- diff(x,lag=1,difference=par3)
if (par4 > 0) x <- diff(x,lag=par5,difference=par4)
bitmap(file='picts.png')
op <- par(mfrow=c(2,1))
plot(ox,type='l',main='Original Time Series',xlab='time',ylab='value')
if (par8=='') {
mytitle <- paste('Working Time Series (lambda=',par2,', d=',par3,', D=',par4,')',sep='')
mysub <- paste('(lambda=',par2,', d=',par3,', D=',par4,', CI=', par7, ', CI type=',par6,')',sep='')
} else {
mytitle <- paste('Working Time Series (base=',par8,', d=',par3,', D=',par4,')',sep='')
mysub <- paste('(base=',par8,', d=',par3,', D=',par4,', CI=', par7, ', CI type=',par6,')',sep='')
}
plot(x,type='l', main=mytitle,xlab='time',ylab='value')
par(op)
dev.off()
bitmap(file='pic1.png')
racf <- acf(x, par1, main='Autocorrelation', xlab='time lag', ylab='ACF', ci.type=par6, ci=par7, sub=mysub)
dev.off()
bitmap(file='pic2.png')
rpacf <- pacf(x,par1,main='Partial Autocorrelation',xlab='lags',ylab='PACF',sub=mysub)
dev.off()
(myacf <- c(racf$acf))
(mypacf <- c(rpacf$acf))
lengthx <- length(x)
sqrtn <- sqrt(lengthx)
load(file='createtable')
a<-table.start()
a<-table.row.start(a)
a<-table.element(a,'Autocorrelation Function',4,TRUE)
a<-table.row.end(a)
a<-table.row.start(a)
a<-table.element(a,'Time lag k',header=TRUE)
a<-table.element(a,hyperlink('basics.htm','ACF(k)','click here for more information about the Autocorrelation Function'),header=TRUE)
a<-table.element(a,'T-STAT',header=TRUE)
a<-table.element(a,'P-value',header=TRUE)
a<-table.row.end(a)
for (i in 2:(par1+1)) {
a<-table.row.start(a)
a<-table.element(a,i-1,header=TRUE)
a<-table.element(a,round(myacf[i],6))
mytstat <- myacf[i]*sqrtn
a<-table.element(a,round(mytstat,4))
a<-table.element(a,round(1-pt(abs(mytstat),lengthx),6))
a<-table.row.end(a)
}
a<-table.end(a)
table.save(a,file='mytable.tab')
a<-table.start()
a<-table.row.start(a)
a<-table.element(a,'Partial Autocorrelation Function',4,TRUE)
a<-table.row.end(a)
a<-table.row.start(a)
a<-table.element(a,'Time lag k',header=TRUE)
a<-table.element(a,hyperlink('basics.htm','PACF(k)','click here for more information about the Partial Autocorrelation Function'),header=TRUE)
a<-table.element(a,'T-STAT',header=TRUE)
a<-table.element(a,'P-value',header=TRUE)
a<-table.row.end(a)
for (i in 1:par1) {
a<-table.row.start(a)
a<-table.element(a,i,header=TRUE)
a<-table.element(a,round(mypacf[i],6))
mytstat <- mypacf[i]*sqrtn
a<-table.element(a,round(mytstat,4))
a<-table.element(a,round(1-pt(abs(mytstat),lengthx),6))
a<-table.row.end(a)
}
a<-table.end(a)
table.save(a,file='mytable1.tab')