Free Statistics

of Irreproducible Research!

Author's title

Author*Unverified author*
R Software Modulerwasp_autocorrelation.wasp
Title produced by software(Partial) Autocorrelation Function
Date of computationTue, 18 Oct 2016 17:47:06 +0100
Cite this page as followsStatistical Computations at FreeStatistics.org, Office for Research Development and Education, URL https://freestatistics.org/blog/index.php?v=date/2016/Oct/18/t14768092980t5acgq2mz2j3ty.htm/, Retrieved Sun, 28 Apr 2024 12:38:34 +0200
Statistical Computations at FreeStatistics.org, Office for Research Development and Education, URL https://freestatistics.org/blog/index.php?pk=, Retrieved Sun, 28 Apr 2024 12:38:34 +0200
QR Codes:

Original text written by user:
IsPrivate?No (this computation is public)
User-defined keywords
Estimated Impact0
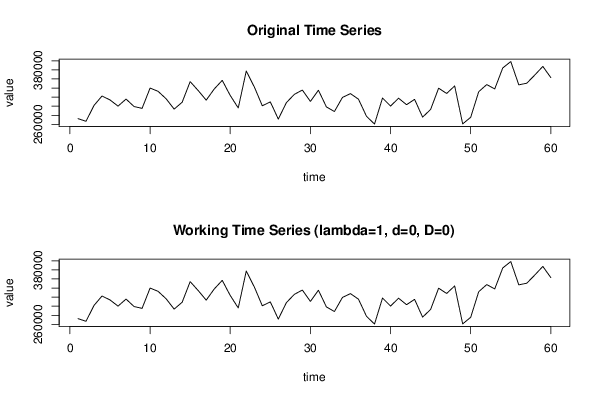
Dataseries X:
272 567
266 674
301 601
322 421
313 776
300 156
315 745
299 214
295 184
340 003
332 748
316 337
293 572
308 713
354 188
334 540
313 285
337 881
356 955
323 661
296 034
377 623
342 590
300 905
309 470
271 492
307 759
326 106
335 576
310 485
335 173
298 344
288 269
319 410
327 692
315 401
277 720
260 573
318 025
300 264
317 640
303 273
315 089
275 840
292 823
339 759
328 032
344 675
260 952
275 466
331 940
347 644
338 063
384 283
398 482
347 062
350 731
368 799
387 710
362 988


Summary of computational transaction
Raw Inputview raw input (R code)
Raw Outputview raw output of R engine
Computing time1 seconds
R Server'Sir Ronald Aylmer Fisher' @ fisher.wessa.net
R Framework error message
Warning: there are blank lines in the 'Data' field.
Please, use NA for missing data - blank lines are simply
 deleted and are NOT treated as missing values.

\begin{tabular}{lllllllll}
\hline
Summary of computational transaction \tabularnewline
Raw Input & view raw input (R code)  \tabularnewline
Raw Output & view raw output of R engine  \tabularnewline
Computing time & 1 seconds \tabularnewline
R Server & 'Sir Ronald Aylmer Fisher' @ fisher.wessa.net \tabularnewline
R Framework error message & 
Warning: there are blank lines in the 'Data' field.
Please, use NA for missing data - blank lines are simply
 deleted and are NOT treated as missing values.
\tabularnewline \hline \end{tabular} %Source: https://freestatistics.org/blog/index.php?pk=&T=0

[TABLE]
[ROW][C]Summary of computational transaction[/C][/ROW]
[ROW][C]Raw Input[/C][C]view raw input (R code) [/C][/ROW]
[ROW][C]Raw Output[/C][C]view raw output of R engine [/C][/ROW]
[ROW][C]Computing time[/C][C]1 seconds[/C][/ROW]
[ROW][C]R Server[/C][C]'Sir Ronald Aylmer Fisher' @ fisher.wessa.net[/C][/ROW]
[ROW][C]R Framework error message[/C][C]
Warning: there are blank lines in the 'Data' field.
Please, use NA for missing data - blank lines are simply
 deleted and are NOT treated as missing values.
[/C][/ROW] [/TABLE] Source: https://freestatistics.org/blog/index.php?pk=&T=0

Globally Unique Identifier (entire table): ba.freestatistics.org/blog/index.php?pk=&T=0

As an alternative you can also use a QR Code:  

The GUIDs for individual cells are displayed in the table below:

Summary of computational transaction
Raw Inputview raw input (R code)
Raw Outputview raw output of R engine
Computing time1 seconds
R Server'Sir Ronald Aylmer Fisher' @ fisher.wessa.net
R Framework error message
Warning: there are blank lines in the 'Data' field.
Please, use NA for missing data - blank lines are simply
 deleted and are NOT treated as missing values.


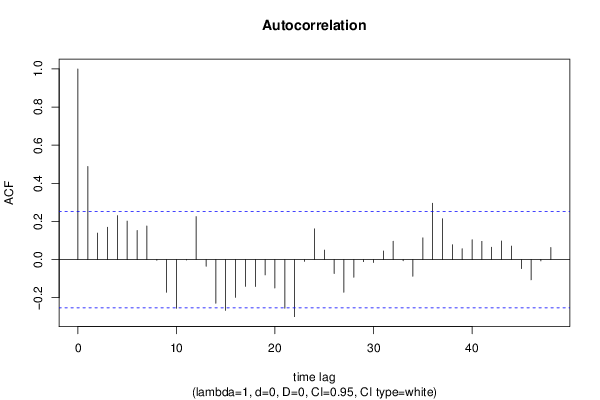
Autocorrelation Function
Time lag kACF(k)T-STATP-value
10.4882523.7820.00018
20.1388521.07550.143219
30.1695141.31310.097083
40.2306521.78660.039525
50.2019721.56450.061483
60.1526141.18210.120906
70.1764261.36660.088427
8-0.003531-0.02740.489134
9-0.171197-1.32610.094918
10-0.255034-1.97550.026409
11-0.002531-0.01960.492213
120.2253031.74520.043036
13-0.035399-0.27420.392437
14-0.228928-1.77330.04063
15-0.266305-2.06280.021734
16-0.198362-1.53650.064836
17-0.140479-1.08810.140442
18-0.14089-1.09130.139746
19-0.080185-0.62110.268439
20-0.149082-1.15480.126379
21-0.255243-1.97710.026315
22-0.299376-2.3190.01191
23-0.009419-0.0730.471039
240.1610411.24740.108546
250.0496610.38470.350919
26-0.073297-0.56780.28616
27-0.171252-1.32650.094849
28-0.093072-0.72090.236876
29-0.010636-0.08240.467306
30-0.015368-0.1190.452821
310.0453150.3510.363407
320.0962690.74570.229381
33-0.00595-0.04610.481698
34-0.087465-0.67750.250347
350.1139140.88240.190548
360.2957512.29090.012749
370.2145681.6620.050861
380.0780740.60480.27381
390.0571960.4430.329665
400.104240.80740.211302
410.0954630.73950.231258
420.0642960.4980.310141
430.097720.75690.226025
440.0707620.54810.29282
45-0.047317-0.36650.357634
46-0.106346-0.82380.206671
47-0.00688-0.05330.478839
480.0632430.48990.313004

\begin{tabular}{lllllllll}
\hline
Autocorrelation Function \tabularnewline
Time lag k & ACF(k) & T-STAT & P-value \tabularnewline
1 & 0.488252 & 3.782 & 0.00018 \tabularnewline
2 & 0.138852 & 1.0755 & 0.143219 \tabularnewline
3 & 0.169514 & 1.3131 & 0.097083 \tabularnewline
4 & 0.230652 & 1.7866 & 0.039525 \tabularnewline
5 & 0.201972 & 1.5645 & 0.061483 \tabularnewline
6 & 0.152614 & 1.1821 & 0.120906 \tabularnewline
7 & 0.176426 & 1.3666 & 0.088427 \tabularnewline
8 & -0.003531 & -0.0274 & 0.489134 \tabularnewline
9 & -0.171197 & -1.3261 & 0.094918 \tabularnewline
10 & -0.255034 & -1.9755 & 0.026409 \tabularnewline
11 & -0.002531 & -0.0196 & 0.492213 \tabularnewline
12 & 0.225303 & 1.7452 & 0.043036 \tabularnewline
13 & -0.035399 & -0.2742 & 0.392437 \tabularnewline
14 & -0.228928 & -1.7733 & 0.04063 \tabularnewline
15 & -0.266305 & -2.0628 & 0.021734 \tabularnewline
16 & -0.198362 & -1.5365 & 0.064836 \tabularnewline
17 & -0.140479 & -1.0881 & 0.140442 \tabularnewline
18 & -0.14089 & -1.0913 & 0.139746 \tabularnewline
19 & -0.080185 & -0.6211 & 0.268439 \tabularnewline
20 & -0.149082 & -1.1548 & 0.126379 \tabularnewline
21 & -0.255243 & -1.9771 & 0.026315 \tabularnewline
22 & -0.299376 & -2.319 & 0.01191 \tabularnewline
23 & -0.009419 & -0.073 & 0.471039 \tabularnewline
24 & 0.161041 & 1.2474 & 0.108546 \tabularnewline
25 & 0.049661 & 0.3847 & 0.350919 \tabularnewline
26 & -0.073297 & -0.5678 & 0.28616 \tabularnewline
27 & -0.171252 & -1.3265 & 0.094849 \tabularnewline
28 & -0.093072 & -0.7209 & 0.236876 \tabularnewline
29 & -0.010636 & -0.0824 & 0.467306 \tabularnewline
30 & -0.015368 & -0.119 & 0.452821 \tabularnewline
31 & 0.045315 & 0.351 & 0.363407 \tabularnewline
32 & 0.096269 & 0.7457 & 0.229381 \tabularnewline
33 & -0.00595 & -0.0461 & 0.481698 \tabularnewline
34 & -0.087465 & -0.6775 & 0.250347 \tabularnewline
35 & 0.113914 & 0.8824 & 0.190548 \tabularnewline
36 & 0.295751 & 2.2909 & 0.012749 \tabularnewline
37 & 0.214568 & 1.662 & 0.050861 \tabularnewline
38 & 0.078074 & 0.6048 & 0.27381 \tabularnewline
39 & 0.057196 & 0.443 & 0.329665 \tabularnewline
40 & 0.10424 & 0.8074 & 0.211302 \tabularnewline
41 & 0.095463 & 0.7395 & 0.231258 \tabularnewline
42 & 0.064296 & 0.498 & 0.310141 \tabularnewline
43 & 0.09772 & 0.7569 & 0.226025 \tabularnewline
44 & 0.070762 & 0.5481 & 0.29282 \tabularnewline
45 & -0.047317 & -0.3665 & 0.357634 \tabularnewline
46 & -0.106346 & -0.8238 & 0.206671 \tabularnewline
47 & -0.00688 & -0.0533 & 0.478839 \tabularnewline
48 & 0.063243 & 0.4899 & 0.313004 \tabularnewline
\hline
\end{tabular}
%Source: https://freestatistics.org/blog/index.php?pk=&T=1

[TABLE]
[ROW][C]Autocorrelation Function[/C][/ROW]
[ROW][C]Time lag k[/C][C]ACF(k)[/C][C]T-STAT[/C][C]P-value[/C][/ROW]
[ROW][C]1[/C][C]0.488252[/C][C]3.782[/C][C]0.00018[/C][/ROW]
[ROW][C]2[/C][C]0.138852[/C][C]1.0755[/C][C]0.143219[/C][/ROW]
[ROW][C]3[/C][C]0.169514[/C][C]1.3131[/C][C]0.097083[/C][/ROW]
[ROW][C]4[/C][C]0.230652[/C][C]1.7866[/C][C]0.039525[/C][/ROW]
[ROW][C]5[/C][C]0.201972[/C][C]1.5645[/C][C]0.061483[/C][/ROW]
[ROW][C]6[/C][C]0.152614[/C][C]1.1821[/C][C]0.120906[/C][/ROW]
[ROW][C]7[/C][C]0.176426[/C][C]1.3666[/C][C]0.088427[/C][/ROW]
[ROW][C]8[/C][C]-0.003531[/C][C]-0.0274[/C][C]0.489134[/C][/ROW]
[ROW][C]9[/C][C]-0.171197[/C][C]-1.3261[/C][C]0.094918[/C][/ROW]
[ROW][C]10[/C][C]-0.255034[/C][C]-1.9755[/C][C]0.026409[/C][/ROW]
[ROW][C]11[/C][C]-0.002531[/C][C]-0.0196[/C][C]0.492213[/C][/ROW]
[ROW][C]12[/C][C]0.225303[/C][C]1.7452[/C][C]0.043036[/C][/ROW]
[ROW][C]13[/C][C]-0.035399[/C][C]-0.2742[/C][C]0.392437[/C][/ROW]
[ROW][C]14[/C][C]-0.228928[/C][C]-1.7733[/C][C]0.04063[/C][/ROW]
[ROW][C]15[/C][C]-0.266305[/C][C]-2.0628[/C][C]0.021734[/C][/ROW]
[ROW][C]16[/C][C]-0.198362[/C][C]-1.5365[/C][C]0.064836[/C][/ROW]
[ROW][C]17[/C][C]-0.140479[/C][C]-1.0881[/C][C]0.140442[/C][/ROW]
[ROW][C]18[/C][C]-0.14089[/C][C]-1.0913[/C][C]0.139746[/C][/ROW]
[ROW][C]19[/C][C]-0.080185[/C][C]-0.6211[/C][C]0.268439[/C][/ROW]
[ROW][C]20[/C][C]-0.149082[/C][C]-1.1548[/C][C]0.126379[/C][/ROW]
[ROW][C]21[/C][C]-0.255243[/C][C]-1.9771[/C][C]0.026315[/C][/ROW]
[ROW][C]22[/C][C]-0.299376[/C][C]-2.319[/C][C]0.01191[/C][/ROW]
[ROW][C]23[/C][C]-0.009419[/C][C]-0.073[/C][C]0.471039[/C][/ROW]
[ROW][C]24[/C][C]0.161041[/C][C]1.2474[/C][C]0.108546[/C][/ROW]
[ROW][C]25[/C][C]0.049661[/C][C]0.3847[/C][C]0.350919[/C][/ROW]
[ROW][C]26[/C][C]-0.073297[/C][C]-0.5678[/C][C]0.28616[/C][/ROW]
[ROW][C]27[/C][C]-0.171252[/C][C]-1.3265[/C][C]0.094849[/C][/ROW]
[ROW][C]28[/C][C]-0.093072[/C][C]-0.7209[/C][C]0.236876[/C][/ROW]
[ROW][C]29[/C][C]-0.010636[/C][C]-0.0824[/C][C]0.467306[/C][/ROW]
[ROW][C]30[/C][C]-0.015368[/C][C]-0.119[/C][C]0.452821[/C][/ROW]
[ROW][C]31[/C][C]0.045315[/C][C]0.351[/C][C]0.363407[/C][/ROW]
[ROW][C]32[/C][C]0.096269[/C][C]0.7457[/C][C]0.229381[/C][/ROW]
[ROW][C]33[/C][C]-0.00595[/C][C]-0.0461[/C][C]0.481698[/C][/ROW]
[ROW][C]34[/C][C]-0.087465[/C][C]-0.6775[/C][C]0.250347[/C][/ROW]
[ROW][C]35[/C][C]0.113914[/C][C]0.8824[/C][C]0.190548[/C][/ROW]
[ROW][C]36[/C][C]0.295751[/C][C]2.2909[/C][C]0.012749[/C][/ROW]
[ROW][C]37[/C][C]0.214568[/C][C]1.662[/C][C]0.050861[/C][/ROW]
[ROW][C]38[/C][C]0.078074[/C][C]0.6048[/C][C]0.27381[/C][/ROW]
[ROW][C]39[/C][C]0.057196[/C][C]0.443[/C][C]0.329665[/C][/ROW]
[ROW][C]40[/C][C]0.10424[/C][C]0.8074[/C][C]0.211302[/C][/ROW]
[ROW][C]41[/C][C]0.095463[/C][C]0.7395[/C][C]0.231258[/C][/ROW]
[ROW][C]42[/C][C]0.064296[/C][C]0.498[/C][C]0.310141[/C][/ROW]
[ROW][C]43[/C][C]0.09772[/C][C]0.7569[/C][C]0.226025[/C][/ROW]
[ROW][C]44[/C][C]0.070762[/C][C]0.5481[/C][C]0.29282[/C][/ROW]
[ROW][C]45[/C][C]-0.047317[/C][C]-0.3665[/C][C]0.357634[/C][/ROW]
[ROW][C]46[/C][C]-0.106346[/C][C]-0.8238[/C][C]0.206671[/C][/ROW]
[ROW][C]47[/C][C]-0.00688[/C][C]-0.0533[/C][C]0.478839[/C][/ROW]
[ROW][C]48[/C][C]0.063243[/C][C]0.4899[/C][C]0.313004[/C][/ROW]
[/TABLE]
Source: https://freestatistics.org/blog/index.php?pk=&T=1

Globally Unique Identifier (entire table): ba.freestatistics.org/blog/index.php?pk=&T=1

As an alternative you can also use a QR Code:  

The GUIDs for individual cells are displayed in the table below:

Autocorrelation Function
Time lag kACF(k)T-STATP-value
10.4882523.7820.00018
20.1388521.07550.143219
30.1695141.31310.097083
40.2306521.78660.039525
50.2019721.56450.061483
60.1526141.18210.120906
70.1764261.36660.088427
8-0.003531-0.02740.489134
9-0.171197-1.32610.094918
10-0.255034-1.97550.026409
11-0.002531-0.01960.492213
120.2253031.74520.043036
13-0.035399-0.27420.392437
14-0.228928-1.77330.04063
15-0.266305-2.06280.021734
16-0.198362-1.53650.064836
17-0.140479-1.08810.140442
18-0.14089-1.09130.139746
19-0.080185-0.62110.268439
20-0.149082-1.15480.126379
21-0.255243-1.97710.026315
22-0.299376-2.3190.01191
23-0.009419-0.0730.471039
240.1610411.24740.108546
250.0496610.38470.350919
26-0.073297-0.56780.28616
27-0.171252-1.32650.094849
28-0.093072-0.72090.236876
29-0.010636-0.08240.467306
30-0.015368-0.1190.452821
310.0453150.3510.363407
320.0962690.74570.229381
33-0.00595-0.04610.481698
34-0.087465-0.67750.250347
350.1139140.88240.190548
360.2957512.29090.012749
370.2145681.6620.050861
380.0780740.60480.27381
390.0571960.4430.329665
400.104240.80740.211302
410.0954630.73950.231258
420.0642960.4980.310141
430.097720.75690.226025
440.0707620.54810.29282
45-0.047317-0.36650.357634
46-0.106346-0.82380.206671
47-0.00688-0.05330.478839
480.0632430.48990.313004


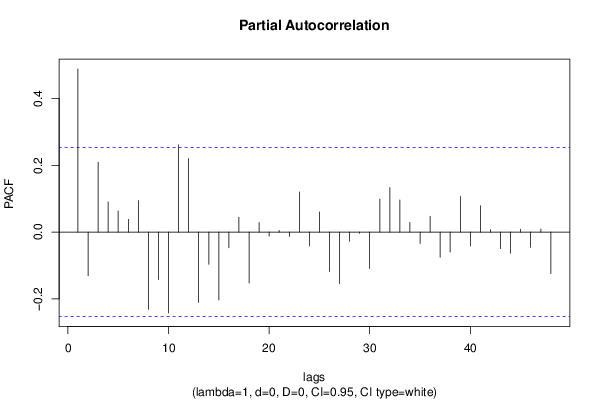
Partial Autocorrelation Function
Time lag kPACF(k)T-STATP-value
10.4882523.7820.00018
2-0.130694-1.01240.157717
30.2092851.62110.055119
40.0900230.69730.24415
50.0632180.48970.313071
60.0382280.29610.384083
70.0942150.72980.234179
8-0.231244-1.79120.039152
9-0.141954-1.09960.137956
10-0.241952-1.87420.03289
110.2610572.02210.023814
120.2202091.70570.046615
13-0.210776-1.63270.053889
14-0.09622-0.74530.229494
15-0.202804-1.57090.060731
16-0.046962-0.36380.358657
170.0447040.34630.365173
18-0.152225-1.17910.121501
190.0284460.22030.413175
20-0.01179-0.09130.463769
210.0048840.03780.484973
22-0.012924-0.10010.460297
230.1202060.93110.177763
24-0.041716-0.32310.373861
250.0603030.46710.321059
26-0.117884-0.91310.182416
27-0.154494-1.19670.118064
28-0.027546-0.21340.415882
29-0.003677-0.02850.488685
30-0.109167-0.84560.200567
310.0987260.76470.223714
320.1336091.03490.152428
330.0962770.74580.229363
340.0287810.22290.41217
35-0.033726-0.26120.3974
360.0476070.36880.356801
37-0.07541-0.58410.280663
38-0.059508-0.4610.323251
390.1063630.82390.206635
40-0.041374-0.32050.37486
410.079010.6120.271423
420.0069870.05410.47851
43-0.049581-0.38410.351149
44-0.063401-0.49110.312574
450.0083130.06440.474436
46-0.045526-0.35260.362796
470.0089910.06960.472355
48-0.12374-0.95850.170832

\begin{tabular}{lllllllll}
\hline
Partial Autocorrelation Function \tabularnewline
Time lag k & PACF(k) & T-STAT & P-value \tabularnewline
1 & 0.488252 & 3.782 & 0.00018 \tabularnewline
2 & -0.130694 & -1.0124 & 0.157717 \tabularnewline
3 & 0.209285 & 1.6211 & 0.055119 \tabularnewline
4 & 0.090023 & 0.6973 & 0.24415 \tabularnewline
5 & 0.063218 & 0.4897 & 0.313071 \tabularnewline
6 & 0.038228 & 0.2961 & 0.384083 \tabularnewline
7 & 0.094215 & 0.7298 & 0.234179 \tabularnewline
8 & -0.231244 & -1.7912 & 0.039152 \tabularnewline
9 & -0.141954 & -1.0996 & 0.137956 \tabularnewline
10 & -0.241952 & -1.8742 & 0.03289 \tabularnewline
11 & 0.261057 & 2.0221 & 0.023814 \tabularnewline
12 & 0.220209 & 1.7057 & 0.046615 \tabularnewline
13 & -0.210776 & -1.6327 & 0.053889 \tabularnewline
14 & -0.09622 & -0.7453 & 0.229494 \tabularnewline
15 & -0.202804 & -1.5709 & 0.060731 \tabularnewline
16 & -0.046962 & -0.3638 & 0.358657 \tabularnewline
17 & 0.044704 & 0.3463 & 0.365173 \tabularnewline
18 & -0.152225 & -1.1791 & 0.121501 \tabularnewline
19 & 0.028446 & 0.2203 & 0.413175 \tabularnewline
20 & -0.01179 & -0.0913 & 0.463769 \tabularnewline
21 & 0.004884 & 0.0378 & 0.484973 \tabularnewline
22 & -0.012924 & -0.1001 & 0.460297 \tabularnewline
23 & 0.120206 & 0.9311 & 0.177763 \tabularnewline
24 & -0.041716 & -0.3231 & 0.373861 \tabularnewline
25 & 0.060303 & 0.4671 & 0.321059 \tabularnewline
26 & -0.117884 & -0.9131 & 0.182416 \tabularnewline
27 & -0.154494 & -1.1967 & 0.118064 \tabularnewline
28 & -0.027546 & -0.2134 & 0.415882 \tabularnewline
29 & -0.003677 & -0.0285 & 0.488685 \tabularnewline
30 & -0.109167 & -0.8456 & 0.200567 \tabularnewline
31 & 0.098726 & 0.7647 & 0.223714 \tabularnewline
32 & 0.133609 & 1.0349 & 0.152428 \tabularnewline
33 & 0.096277 & 0.7458 & 0.229363 \tabularnewline
34 & 0.028781 & 0.2229 & 0.41217 \tabularnewline
35 & -0.033726 & -0.2612 & 0.3974 \tabularnewline
36 & 0.047607 & 0.3688 & 0.356801 \tabularnewline
37 & -0.07541 & -0.5841 & 0.280663 \tabularnewline
38 & -0.059508 & -0.461 & 0.323251 \tabularnewline
39 & 0.106363 & 0.8239 & 0.206635 \tabularnewline
40 & -0.041374 & -0.3205 & 0.37486 \tabularnewline
41 & 0.07901 & 0.612 & 0.271423 \tabularnewline
42 & 0.006987 & 0.0541 & 0.47851 \tabularnewline
43 & -0.049581 & -0.3841 & 0.351149 \tabularnewline
44 & -0.063401 & -0.4911 & 0.312574 \tabularnewline
45 & 0.008313 & 0.0644 & 0.474436 \tabularnewline
46 & -0.045526 & -0.3526 & 0.362796 \tabularnewline
47 & 0.008991 & 0.0696 & 0.472355 \tabularnewline
48 & -0.12374 & -0.9585 & 0.170832 \tabularnewline
\hline
\end{tabular}
%Source: https://freestatistics.org/blog/index.php?pk=&T=2

[TABLE]
[ROW][C]Partial Autocorrelation Function[/C][/ROW]
[ROW][C]Time lag k[/C][C]PACF(k)[/C][C]T-STAT[/C][C]P-value[/C][/ROW]
[ROW][C]1[/C][C]0.488252[/C][C]3.782[/C][C]0.00018[/C][/ROW]
[ROW][C]2[/C][C]-0.130694[/C][C]-1.0124[/C][C]0.157717[/C][/ROW]
[ROW][C]3[/C][C]0.209285[/C][C]1.6211[/C][C]0.055119[/C][/ROW]
[ROW][C]4[/C][C]0.090023[/C][C]0.6973[/C][C]0.24415[/C][/ROW]
[ROW][C]5[/C][C]0.063218[/C][C]0.4897[/C][C]0.313071[/C][/ROW]
[ROW][C]6[/C][C]0.038228[/C][C]0.2961[/C][C]0.384083[/C][/ROW]
[ROW][C]7[/C][C]0.094215[/C][C]0.7298[/C][C]0.234179[/C][/ROW]
[ROW][C]8[/C][C]-0.231244[/C][C]-1.7912[/C][C]0.039152[/C][/ROW]
[ROW][C]9[/C][C]-0.141954[/C][C]-1.0996[/C][C]0.137956[/C][/ROW]
[ROW][C]10[/C][C]-0.241952[/C][C]-1.8742[/C][C]0.03289[/C][/ROW]
[ROW][C]11[/C][C]0.261057[/C][C]2.0221[/C][C]0.023814[/C][/ROW]
[ROW][C]12[/C][C]0.220209[/C][C]1.7057[/C][C]0.046615[/C][/ROW]
[ROW][C]13[/C][C]-0.210776[/C][C]-1.6327[/C][C]0.053889[/C][/ROW]
[ROW][C]14[/C][C]-0.09622[/C][C]-0.7453[/C][C]0.229494[/C][/ROW]
[ROW][C]15[/C][C]-0.202804[/C][C]-1.5709[/C][C]0.060731[/C][/ROW]
[ROW][C]16[/C][C]-0.046962[/C][C]-0.3638[/C][C]0.358657[/C][/ROW]
[ROW][C]17[/C][C]0.044704[/C][C]0.3463[/C][C]0.365173[/C][/ROW]
[ROW][C]18[/C][C]-0.152225[/C][C]-1.1791[/C][C]0.121501[/C][/ROW]
[ROW][C]19[/C][C]0.028446[/C][C]0.2203[/C][C]0.413175[/C][/ROW]
[ROW][C]20[/C][C]-0.01179[/C][C]-0.0913[/C][C]0.463769[/C][/ROW]
[ROW][C]21[/C][C]0.004884[/C][C]0.0378[/C][C]0.484973[/C][/ROW]
[ROW][C]22[/C][C]-0.012924[/C][C]-0.1001[/C][C]0.460297[/C][/ROW]
[ROW][C]23[/C][C]0.120206[/C][C]0.9311[/C][C]0.177763[/C][/ROW]
[ROW][C]24[/C][C]-0.041716[/C][C]-0.3231[/C][C]0.373861[/C][/ROW]
[ROW][C]25[/C][C]0.060303[/C][C]0.4671[/C][C]0.321059[/C][/ROW]
[ROW][C]26[/C][C]-0.117884[/C][C]-0.9131[/C][C]0.182416[/C][/ROW]
[ROW][C]27[/C][C]-0.154494[/C][C]-1.1967[/C][C]0.118064[/C][/ROW]
[ROW][C]28[/C][C]-0.027546[/C][C]-0.2134[/C][C]0.415882[/C][/ROW]
[ROW][C]29[/C][C]-0.003677[/C][C]-0.0285[/C][C]0.488685[/C][/ROW]
[ROW][C]30[/C][C]-0.109167[/C][C]-0.8456[/C][C]0.200567[/C][/ROW]
[ROW][C]31[/C][C]0.098726[/C][C]0.7647[/C][C]0.223714[/C][/ROW]
[ROW][C]32[/C][C]0.133609[/C][C]1.0349[/C][C]0.152428[/C][/ROW]
[ROW][C]33[/C][C]0.096277[/C][C]0.7458[/C][C]0.229363[/C][/ROW]
[ROW][C]34[/C][C]0.028781[/C][C]0.2229[/C][C]0.41217[/C][/ROW]
[ROW][C]35[/C][C]-0.033726[/C][C]-0.2612[/C][C]0.3974[/C][/ROW]
[ROW][C]36[/C][C]0.047607[/C][C]0.3688[/C][C]0.356801[/C][/ROW]
[ROW][C]37[/C][C]-0.07541[/C][C]-0.5841[/C][C]0.280663[/C][/ROW]
[ROW][C]38[/C][C]-0.059508[/C][C]-0.461[/C][C]0.323251[/C][/ROW]
[ROW][C]39[/C][C]0.106363[/C][C]0.8239[/C][C]0.206635[/C][/ROW]
[ROW][C]40[/C][C]-0.041374[/C][C]-0.3205[/C][C]0.37486[/C][/ROW]
[ROW][C]41[/C][C]0.07901[/C][C]0.612[/C][C]0.271423[/C][/ROW]
[ROW][C]42[/C][C]0.006987[/C][C]0.0541[/C][C]0.47851[/C][/ROW]
[ROW][C]43[/C][C]-0.049581[/C][C]-0.3841[/C][C]0.351149[/C][/ROW]
[ROW][C]44[/C][C]-0.063401[/C][C]-0.4911[/C][C]0.312574[/C][/ROW]
[ROW][C]45[/C][C]0.008313[/C][C]0.0644[/C][C]0.474436[/C][/ROW]
[ROW][C]46[/C][C]-0.045526[/C][C]-0.3526[/C][C]0.362796[/C][/ROW]
[ROW][C]47[/C][C]0.008991[/C][C]0.0696[/C][C]0.472355[/C][/ROW]
[ROW][C]48[/C][C]-0.12374[/C][C]-0.9585[/C][C]0.170832[/C][/ROW]
[/TABLE]
Source: https://freestatistics.org/blog/index.php?pk=&T=2

Globally Unique Identifier (entire table): ba.freestatistics.org/blog/index.php?pk=&T=2

As an alternative you can also use a QR Code:  

The GUIDs for individual cells are displayed in the table below:

Partial Autocorrelation Function
Time lag kPACF(k)T-STATP-value
10.4882523.7820.00018
2-0.130694-1.01240.157717
30.2092851.62110.055119
40.0900230.69730.24415
50.0632180.48970.313071
60.0382280.29610.384083
70.0942150.72980.234179
8-0.231244-1.79120.039152
9-0.141954-1.09960.137956
10-0.241952-1.87420.03289
110.2610572.02210.023814
120.2202091.70570.046615
13-0.210776-1.63270.053889
14-0.09622-0.74530.229494
15-0.202804-1.57090.060731
16-0.046962-0.36380.358657
170.0447040.34630.365173
18-0.152225-1.17910.121501
190.0284460.22030.413175
20-0.01179-0.09130.463769
210.0048840.03780.484973
22-0.012924-0.10010.460297
230.1202060.93110.177763
24-0.041716-0.32310.373861
250.0603030.46710.321059
26-0.117884-0.91310.182416
27-0.154494-1.19670.118064
28-0.027546-0.21340.415882
29-0.003677-0.02850.488685
30-0.109167-0.84560.200567
310.0987260.76470.223714
320.1336091.03490.152428
330.0962770.74580.229363
340.0287810.22290.41217
35-0.033726-0.26120.3974
360.0476070.36880.356801
37-0.07541-0.58410.280663
38-0.059508-0.4610.323251
390.1063630.82390.206635
40-0.041374-0.32050.37486
410.079010.6120.271423
420.0069870.05410.47851
43-0.049581-0.38410.351149
44-0.063401-0.49110.312574
450.0083130.06440.474436
46-0.045526-0.35260.362796
470.0089910.06960.472355
48-0.12374-0.95850.170832


Parameters (Session):
par1 = 48 ; par2 = 1 ; par3 = 0 ; par4 = 0 ; par5 = 12 ; par6 = White Noise ; par7 = 0.95 ;
Parameters (R input):
par1 = 48 ; par2 = 1 ; par3 = 0 ; par4 = 0 ; par5 = 12 ; par6 = White Noise ; par7 = 0.95 ; par8 = ;
R code (references can be found in the software module):
if (par1 == 'Default') {
par1 = 10*log10(length(x))
} else {
par1 <- as.numeric(par1)
}
par2 <- as.numeric(par2)
par3 <- as.numeric(par3)
par4 <- as.numeric(par4)
par5 <- as.numeric(par5)
if (par6 == 'White Noise') par6 <- 'white' else par6 <- 'ma'
par7 <- as.numeric(par7)
if (par8 != '') par8 <- as.numeric(par8)
x <- na.omit(x)
ox <- x
if (par8 == '') {
if (par2 == 0) {
x <- log(x)
} else {
x <- (x ^ par2 - 1) / par2
}
} else {
x <- log(x,base=par8)
}
if (par3 > 0) x <- diff(x,lag=1,difference=par3)
if (par4 > 0) x <- diff(x,lag=par5,difference=par4)
bitmap(file='picts.png')
op <- par(mfrow=c(2,1))
plot(ox,type='l',main='Original Time Series',xlab='time',ylab='value')
if (par8=='') {
mytitle <- paste('Working Time Series (lambda=',par2,', d=',par3,', D=',par4,')',sep='')
mysub <- paste('(lambda=',par2,', d=',par3,', D=',par4,', CI=', par7, ', CI type=',par6,')',sep='')
} else {
mytitle <- paste('Working Time Series (base=',par8,', d=',par3,', D=',par4,')',sep='')
mysub <- paste('(base=',par8,', d=',par3,', D=',par4,', CI=', par7, ', CI type=',par6,')',sep='')
}
plot(x,type='l', main=mytitle,xlab='time',ylab='value')
par(op)
dev.off()
bitmap(file='pic1.png')
racf <- acf(x, par1, main='Autocorrelation', xlab='time lag', ylab='ACF', ci.type=par6, ci=par7, sub=mysub)
dev.off()
bitmap(file='pic2.png')
rpacf <- pacf(x,par1,main='Partial Autocorrelation',xlab='lags',ylab='PACF',sub=mysub)
dev.off()
(myacf <- c(racf$acf))
(mypacf <- c(rpacf$acf))
lengthx <- length(x)
sqrtn <- sqrt(lengthx)
load(file='createtable')
a<-table.start()
a<-table.row.start(a)
a<-table.element(a,'Autocorrelation Function',4,TRUE)
a<-table.row.end(a)
a<-table.row.start(a)
a<-table.element(a,'Time lag k',header=TRUE)
a<-table.element(a,hyperlink('basics.htm','ACF(k)','click here for more information about the Autocorrelation Function'),header=TRUE)
a<-table.element(a,'T-STAT',header=TRUE)
a<-table.element(a,'P-value',header=TRUE)
a<-table.row.end(a)
for (i in 2:(par1+1)) {
a<-table.row.start(a)
a<-table.element(a,i-1,header=TRUE)
a<-table.element(a,round(myacf[i],6))
mytstat <- myacf[i]*sqrtn
a<-table.element(a,round(mytstat,4))
a<-table.element(a,round(1-pt(abs(mytstat),lengthx),6))
a<-table.row.end(a)
}
a<-table.end(a)
table.save(a,file='mytable.tab')
a<-table.start()
a<-table.row.start(a)
a<-table.element(a,'Partial Autocorrelation Function',4,TRUE)
a<-table.row.end(a)
a<-table.row.start(a)
a<-table.element(a,'Time lag k',header=TRUE)
a<-table.element(a,hyperlink('basics.htm','PACF(k)','click here for more information about the Partial Autocorrelation Function'),header=TRUE)
a<-table.element(a,'T-STAT',header=TRUE)
a<-table.element(a,'P-value',header=TRUE)
a<-table.row.end(a)
for (i in 1:par1) {
a<-table.row.start(a)
a<-table.element(a,i,header=TRUE)
a<-table.element(a,round(mypacf[i],6))
mytstat <- mypacf[i]*sqrtn
a<-table.element(a,round(mytstat,4))
a<-table.element(a,round(1-pt(abs(mytstat),lengthx),6))
a<-table.row.end(a)
}
a<-table.end(a)
table.save(a,file='mytable1.tab')