Free Statistics

of Irreproducible Research!

Author's title

Author*Unverified author*
R Software Modulerwasp_autocorrelation.wasp
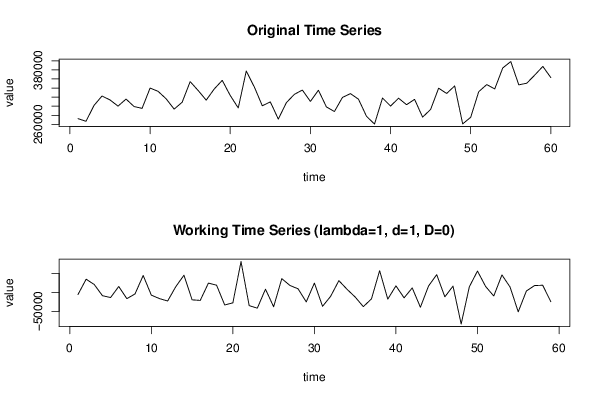
Title produced by software(Partial) Autocorrelation Function
Date of computationTue, 18 Oct 2016 17:50:25 +0100
Cite this page as followsStatistical Computations at FreeStatistics.org, Office for Research Development and Education, URL https://freestatistics.org/blog/index.php?v=date/2016/Oct/18/t1476809498b8lbxc1gqypnxo0.htm/, Retrieved Sun, 28 Apr 2024 18:32:01 +0200
Statistical Computations at FreeStatistics.org, Office for Research Development and Education, URL https://freestatistics.org/blog/index.php?pk=, Retrieved Sun, 28 Apr 2024 18:32:01 +0200
QR Codes:

Original text written by user:
IsPrivate?No (this computation is public)
User-defined keywords
Estimated Impact0
Dataseries X:
272567
266674
301601
322421
313776
300156
315745
299214
295184
340003
332748
316337
293572
308713
354188
334540
313285
337881
356955
323661
296034
377623
342590
300905
309470
271492
307759
326106
335576
310485
335173
298344
288269
319410
327692
315401
277720
260573
318025
300264
317640
303273
315089
275840
292823
339759
328032
344675
260952
275466
331940
347644
338063
384283
398482
347062
350731
368799
387710
362988


Summary of computational transaction
Raw Inputview raw input (R code)
Raw Outputview raw output of R engine
Computing time2 seconds
R Server'George Udny Yule' @ yule.wessa.net
R Framework error message
Warning: there are blank lines in the 'Data' field.
Please, use NA for missing data - blank lines are simply
 deleted and are NOT treated as missing values.

\begin{tabular}{lllllllll}
\hline
Summary of computational transaction \tabularnewline
Raw Input & view raw input (R code)  \tabularnewline
Raw Output & view raw output of R engine  \tabularnewline
Computing time & 2 seconds \tabularnewline
R Server & 'George Udny Yule' @ yule.wessa.net \tabularnewline
R Framework error message & 
Warning: there are blank lines in the 'Data' field.
Please, use NA for missing data - blank lines are simply
 deleted and are NOT treated as missing values.
\tabularnewline \hline \end{tabular} %Source: https://freestatistics.org/blog/index.php?pk=&T=0

[TABLE]
[ROW][C]Summary of computational transaction[/C][/ROW]
[ROW][C]Raw Input[/C][C]view raw input (R code) [/C][/ROW]
[ROW][C]Raw Output[/C][C]view raw output of R engine [/C][/ROW]
[ROW][C]Computing time[/C][C]2 seconds[/C][/ROW]
[ROW][C]R Server[/C][C]'George Udny Yule' @ yule.wessa.net[/C][/ROW]
[ROW][C]R Framework error message[/C][C]
Warning: there are blank lines in the 'Data' field.
Please, use NA for missing data - blank lines are simply
 deleted and are NOT treated as missing values.
[/C][/ROW] [/TABLE] Source: https://freestatistics.org/blog/index.php?pk=&T=0

Globally Unique Identifier (entire table): ba.freestatistics.org/blog/index.php?pk=&T=0

As an alternative you can also use a QR Code:  

The GUIDs for individual cells are displayed in the table below:

Summary of computational transaction
Raw Inputview raw input (R code)
Raw Outputview raw output of R engine
Computing time2 seconds
R Server'George Udny Yule' @ yule.wessa.net
R Framework error message
Warning: there are blank lines in the 'Data' field.
Please, use NA for missing data - blank lines are simply
 deleted and are NOT treated as missing values.


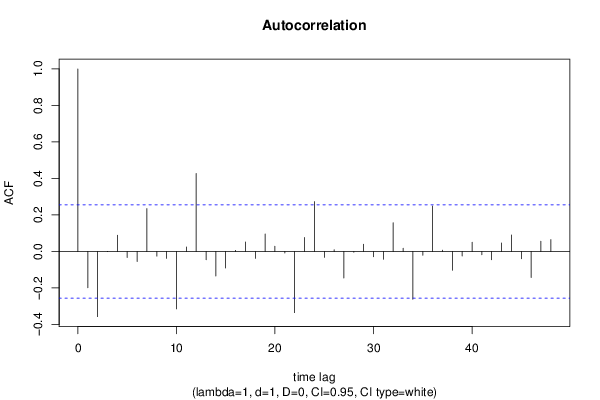
Autocorrelation Function
Time lag kACF(k)T-STATP-value
1-0.19843-1.52420.066405
2-0.357138-2.74320.004022
3-0.001123-0.00860.496573
40.0888590.68250.248784
5-0.032871-0.25250.400771
6-0.054743-0.42050.337828
70.2348531.80390.038173
8-0.025621-0.19680.422332
9-0.037855-0.29080.386124
10-0.314763-2.41770.009362
110.0243210.18680.426223
120.427233.28160.000868
13-0.045849-0.35220.362982
14-0.13477-1.03520.152404
15-0.090439-0.69470.244993
160.0060390.04640.481578
170.0516180.39650.346588
18-0.038076-0.29250.385477
190.096070.73790.231742
200.02820.21660.414632
21-0.008718-0.0670.473419
22-0.335156-2.57440.006286
230.0764230.5870.279715
240.2731842.09840.020082
25-0.032412-0.2490.402127
260.009670.07430.47052
27-0.145429-1.11710.134248
28-0.004404-0.03380.486563
290.0396620.30460.380853
30-0.029089-0.22340.411983
31-0.043082-0.33090.370938
320.1574781.20960.115626
330.0180110.13830.445221
34-0.262092-2.01320.024333
35-0.020845-0.16010.436668
360.248991.91250.030333
370.0072250.05550.477966
38-0.103146-0.79230.215687
39-0.024548-0.18860.425545
400.0501420.38510.350757
41-0.017875-0.13730.44563
42-0.045401-0.34870.364265
430.046330.35590.361604
440.0907420.6970.244269
45-0.039683-0.30480.380792
46-0.142681-1.0960.138777
470.0562790.43230.333554
480.0650680.49980.309537

\begin{tabular}{lllllllll}
\hline
Autocorrelation Function \tabularnewline
Time lag k & ACF(k) & T-STAT & P-value \tabularnewline
1 & -0.19843 & -1.5242 & 0.066405 \tabularnewline
2 & -0.357138 & -2.7432 & 0.004022 \tabularnewline
3 & -0.001123 & -0.0086 & 0.496573 \tabularnewline
4 & 0.088859 & 0.6825 & 0.248784 \tabularnewline
5 & -0.032871 & -0.2525 & 0.400771 \tabularnewline
6 & -0.054743 & -0.4205 & 0.337828 \tabularnewline
7 & 0.234853 & 1.8039 & 0.038173 \tabularnewline
8 & -0.025621 & -0.1968 & 0.422332 \tabularnewline
9 & -0.037855 & -0.2908 & 0.386124 \tabularnewline
10 & -0.314763 & -2.4177 & 0.009362 \tabularnewline
11 & 0.024321 & 0.1868 & 0.426223 \tabularnewline
12 & 0.42723 & 3.2816 & 0.000868 \tabularnewline
13 & -0.045849 & -0.3522 & 0.362982 \tabularnewline
14 & -0.13477 & -1.0352 & 0.152404 \tabularnewline
15 & -0.090439 & -0.6947 & 0.244993 \tabularnewline
16 & 0.006039 & 0.0464 & 0.481578 \tabularnewline
17 & 0.051618 & 0.3965 & 0.346588 \tabularnewline
18 & -0.038076 & -0.2925 & 0.385477 \tabularnewline
19 & 0.09607 & 0.7379 & 0.231742 \tabularnewline
20 & 0.0282 & 0.2166 & 0.414632 \tabularnewline
21 & -0.008718 & -0.067 & 0.473419 \tabularnewline
22 & -0.335156 & -2.5744 & 0.006286 \tabularnewline
23 & 0.076423 & 0.587 & 0.279715 \tabularnewline
24 & 0.273184 & 2.0984 & 0.020082 \tabularnewline
25 & -0.032412 & -0.249 & 0.402127 \tabularnewline
26 & 0.00967 & 0.0743 & 0.47052 \tabularnewline
27 & -0.145429 & -1.1171 & 0.134248 \tabularnewline
28 & -0.004404 & -0.0338 & 0.486563 \tabularnewline
29 & 0.039662 & 0.3046 & 0.380853 \tabularnewline
30 & -0.029089 & -0.2234 & 0.411983 \tabularnewline
31 & -0.043082 & -0.3309 & 0.370938 \tabularnewline
32 & 0.157478 & 1.2096 & 0.115626 \tabularnewline
33 & 0.018011 & 0.1383 & 0.445221 \tabularnewline
34 & -0.262092 & -2.0132 & 0.024333 \tabularnewline
35 & -0.020845 & -0.1601 & 0.436668 \tabularnewline
36 & 0.24899 & 1.9125 & 0.030333 \tabularnewline
37 & 0.007225 & 0.0555 & 0.477966 \tabularnewline
38 & -0.103146 & -0.7923 & 0.215687 \tabularnewline
39 & -0.024548 & -0.1886 & 0.425545 \tabularnewline
40 & 0.050142 & 0.3851 & 0.350757 \tabularnewline
41 & -0.017875 & -0.1373 & 0.44563 \tabularnewline
42 & -0.045401 & -0.3487 & 0.364265 \tabularnewline
43 & 0.04633 & 0.3559 & 0.361604 \tabularnewline
44 & 0.090742 & 0.697 & 0.244269 \tabularnewline
45 & -0.039683 & -0.3048 & 0.380792 \tabularnewline
46 & -0.142681 & -1.096 & 0.138777 \tabularnewline
47 & 0.056279 & 0.4323 & 0.333554 \tabularnewline
48 & 0.065068 & 0.4998 & 0.309537 \tabularnewline
\hline
\end{tabular}
%Source: https://freestatistics.org/blog/index.php?pk=&T=1

[TABLE]
[ROW][C]Autocorrelation Function[/C][/ROW]
[ROW][C]Time lag k[/C][C]ACF(k)[/C][C]T-STAT[/C][C]P-value[/C][/ROW]
[ROW][C]1[/C][C]-0.19843[/C][C]-1.5242[/C][C]0.066405[/C][/ROW]
[ROW][C]2[/C][C]-0.357138[/C][C]-2.7432[/C][C]0.004022[/C][/ROW]
[ROW][C]3[/C][C]-0.001123[/C][C]-0.0086[/C][C]0.496573[/C][/ROW]
[ROW][C]4[/C][C]0.088859[/C][C]0.6825[/C][C]0.248784[/C][/ROW]
[ROW][C]5[/C][C]-0.032871[/C][C]-0.2525[/C][C]0.400771[/C][/ROW]
[ROW][C]6[/C][C]-0.054743[/C][C]-0.4205[/C][C]0.337828[/C][/ROW]
[ROW][C]7[/C][C]0.234853[/C][C]1.8039[/C][C]0.038173[/C][/ROW]
[ROW][C]8[/C][C]-0.025621[/C][C]-0.1968[/C][C]0.422332[/C][/ROW]
[ROW][C]9[/C][C]-0.037855[/C][C]-0.2908[/C][C]0.386124[/C][/ROW]
[ROW][C]10[/C][C]-0.314763[/C][C]-2.4177[/C][C]0.009362[/C][/ROW]
[ROW][C]11[/C][C]0.024321[/C][C]0.1868[/C][C]0.426223[/C][/ROW]
[ROW][C]12[/C][C]0.42723[/C][C]3.2816[/C][C]0.000868[/C][/ROW]
[ROW][C]13[/C][C]-0.045849[/C][C]-0.3522[/C][C]0.362982[/C][/ROW]
[ROW][C]14[/C][C]-0.13477[/C][C]-1.0352[/C][C]0.152404[/C][/ROW]
[ROW][C]15[/C][C]-0.090439[/C][C]-0.6947[/C][C]0.244993[/C][/ROW]
[ROW][C]16[/C][C]0.006039[/C][C]0.0464[/C][C]0.481578[/C][/ROW]
[ROW][C]17[/C][C]0.051618[/C][C]0.3965[/C][C]0.346588[/C][/ROW]
[ROW][C]18[/C][C]-0.038076[/C][C]-0.2925[/C][C]0.385477[/C][/ROW]
[ROW][C]19[/C][C]0.09607[/C][C]0.7379[/C][C]0.231742[/C][/ROW]
[ROW][C]20[/C][C]0.0282[/C][C]0.2166[/C][C]0.414632[/C][/ROW]
[ROW][C]21[/C][C]-0.008718[/C][C]-0.067[/C][C]0.473419[/C][/ROW]
[ROW][C]22[/C][C]-0.335156[/C][C]-2.5744[/C][C]0.006286[/C][/ROW]
[ROW][C]23[/C][C]0.076423[/C][C]0.587[/C][C]0.279715[/C][/ROW]
[ROW][C]24[/C][C]0.273184[/C][C]2.0984[/C][C]0.020082[/C][/ROW]
[ROW][C]25[/C][C]-0.032412[/C][C]-0.249[/C][C]0.402127[/C][/ROW]
[ROW][C]26[/C][C]0.00967[/C][C]0.0743[/C][C]0.47052[/C][/ROW]
[ROW][C]27[/C][C]-0.145429[/C][C]-1.1171[/C][C]0.134248[/C][/ROW]
[ROW][C]28[/C][C]-0.004404[/C][C]-0.0338[/C][C]0.486563[/C][/ROW]
[ROW][C]29[/C][C]0.039662[/C][C]0.3046[/C][C]0.380853[/C][/ROW]
[ROW][C]30[/C][C]-0.029089[/C][C]-0.2234[/C][C]0.411983[/C][/ROW]
[ROW][C]31[/C][C]-0.043082[/C][C]-0.3309[/C][C]0.370938[/C][/ROW]
[ROW][C]32[/C][C]0.157478[/C][C]1.2096[/C][C]0.115626[/C][/ROW]
[ROW][C]33[/C][C]0.018011[/C][C]0.1383[/C][C]0.445221[/C][/ROW]
[ROW][C]34[/C][C]-0.262092[/C][C]-2.0132[/C][C]0.024333[/C][/ROW]
[ROW][C]35[/C][C]-0.020845[/C][C]-0.1601[/C][C]0.436668[/C][/ROW]
[ROW][C]36[/C][C]0.24899[/C][C]1.9125[/C][C]0.030333[/C][/ROW]
[ROW][C]37[/C][C]0.007225[/C][C]0.0555[/C][C]0.477966[/C][/ROW]
[ROW][C]38[/C][C]-0.103146[/C][C]-0.7923[/C][C]0.215687[/C][/ROW]
[ROW][C]39[/C][C]-0.024548[/C][C]-0.1886[/C][C]0.425545[/C][/ROW]
[ROW][C]40[/C][C]0.050142[/C][C]0.3851[/C][C]0.350757[/C][/ROW]
[ROW][C]41[/C][C]-0.017875[/C][C]-0.1373[/C][C]0.44563[/C][/ROW]
[ROW][C]42[/C][C]-0.045401[/C][C]-0.3487[/C][C]0.364265[/C][/ROW]
[ROW][C]43[/C][C]0.04633[/C][C]0.3559[/C][C]0.361604[/C][/ROW]
[ROW][C]44[/C][C]0.090742[/C][C]0.697[/C][C]0.244269[/C][/ROW]
[ROW][C]45[/C][C]-0.039683[/C][C]-0.3048[/C][C]0.380792[/C][/ROW]
[ROW][C]46[/C][C]-0.142681[/C][C]-1.096[/C][C]0.138777[/C][/ROW]
[ROW][C]47[/C][C]0.056279[/C][C]0.4323[/C][C]0.333554[/C][/ROW]
[ROW][C]48[/C][C]0.065068[/C][C]0.4998[/C][C]0.309537[/C][/ROW]
[/TABLE]
Source: https://freestatistics.org/blog/index.php?pk=&T=1

Globally Unique Identifier (entire table): ba.freestatistics.org/blog/index.php?pk=&T=1

As an alternative you can also use a QR Code:  

The GUIDs for individual cells are displayed in the table below:

Autocorrelation Function
Time lag kACF(k)T-STATP-value
1-0.19843-1.52420.066405
2-0.357138-2.74320.004022
3-0.001123-0.00860.496573
40.0888590.68250.248784
5-0.032871-0.25250.400771
6-0.054743-0.42050.337828
70.2348531.80390.038173
8-0.025621-0.19680.422332
9-0.037855-0.29080.386124
10-0.314763-2.41770.009362
110.0243210.18680.426223
120.427233.28160.000868
13-0.045849-0.35220.362982
14-0.13477-1.03520.152404
15-0.090439-0.69470.244993
160.0060390.04640.481578
170.0516180.39650.346588
18-0.038076-0.29250.385477
190.096070.73790.231742
200.02820.21660.414632
21-0.008718-0.0670.473419
22-0.335156-2.57440.006286
230.0764230.5870.279715
240.2731842.09840.020082
25-0.032412-0.2490.402127
260.009670.07430.47052
27-0.145429-1.11710.134248
28-0.004404-0.03380.486563
290.0396620.30460.380853
30-0.029089-0.22340.411983
31-0.043082-0.33090.370938
320.1574781.20960.115626
330.0180110.13830.445221
34-0.262092-2.01320.024333
35-0.020845-0.16010.436668
360.248991.91250.030333
370.0072250.05550.477966
38-0.103146-0.79230.215687
39-0.024548-0.18860.425545
400.0501420.38510.350757
41-0.017875-0.13730.44563
42-0.045401-0.34870.364265
430.046330.35590.361604
440.0907420.6970.244269
45-0.039683-0.30480.380792
46-0.142681-1.0960.138777
470.0562790.43230.333554
480.0650680.49980.309537


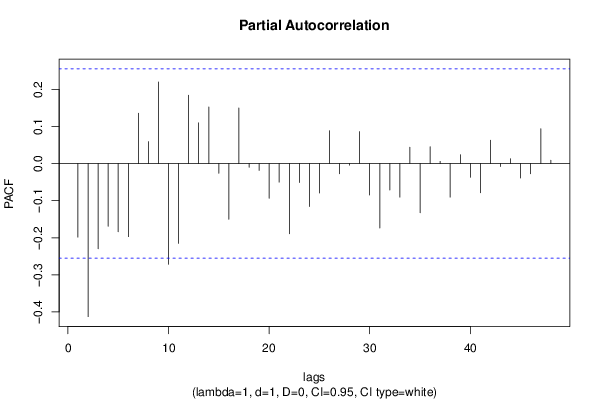
Partial Autocorrelation Function
Time lag kPACF(k)T-STATP-value
1-0.19843-1.52420.066405
2-0.412765-3.17050.001207
3-0.229806-1.76520.041355
4-0.169016-1.29820.09963
5-0.18405-1.41370.081351
6-0.196979-1.5130.067807
70.1356371.04180.150866
80.0591870.45460.325523
90.2199691.68960.04819
10-0.271632-2.08640.020635
11-0.215129-1.65240.051879
120.1842471.41520.081129
130.1097960.84340.201216
140.1526961.17290.122779
15-0.026118-0.20060.420844
16-0.150096-1.15290.126799
170.1498831.15130.127132
18-0.010032-0.07710.469421
19-0.018317-0.14070.444295
20-0.093589-0.71890.237528
21-0.050001-0.38410.351155
22-0.18924-1.45360.07568
23-0.051067-0.39230.348142
24-0.115933-0.89050.188408
25-0.079541-0.6110.271784
260.0887460.68170.249056
27-0.027687-0.21270.416161
28-0.004174-0.03210.487265
290.0861730.66190.255303
30-0.08475-0.6510.258795
31-0.173748-1.33460.09357
32-0.071293-0.54760.293011
33-0.090575-0.69570.244667
340.0439540.33760.368424
35-0.132602-1.01850.156291
360.0455910.35020.363722
370.0058880.04520.48204
38-0.090436-0.69470.244999
390.0237710.18260.427874
40-0.03674-0.28220.389387
41-0.078609-0.60380.274142
420.0630830.48460.314895
43-0.007848-0.06030.476066
440.0129450.09940.460568
45-0.038896-0.29880.383084
46-0.027498-0.21120.416723
470.0941630.72330.236184
480.0091830.07050.472003

\begin{tabular}{lllllllll}
\hline
Partial Autocorrelation Function \tabularnewline
Time lag k & PACF(k) & T-STAT & P-value \tabularnewline
1 & -0.19843 & -1.5242 & 0.066405 \tabularnewline
2 & -0.412765 & -3.1705 & 0.001207 \tabularnewline
3 & -0.229806 & -1.7652 & 0.041355 \tabularnewline
4 & -0.169016 & -1.2982 & 0.09963 \tabularnewline
5 & -0.18405 & -1.4137 & 0.081351 \tabularnewline
6 & -0.196979 & -1.513 & 0.067807 \tabularnewline
7 & 0.135637 & 1.0418 & 0.150866 \tabularnewline
8 & 0.059187 & 0.4546 & 0.325523 \tabularnewline
9 & 0.219969 & 1.6896 & 0.04819 \tabularnewline
10 & -0.271632 & -2.0864 & 0.020635 \tabularnewline
11 & -0.215129 & -1.6524 & 0.051879 \tabularnewline
12 & 0.184247 & 1.4152 & 0.081129 \tabularnewline
13 & 0.109796 & 0.8434 & 0.201216 \tabularnewline
14 & 0.152696 & 1.1729 & 0.122779 \tabularnewline
15 & -0.026118 & -0.2006 & 0.420844 \tabularnewline
16 & -0.150096 & -1.1529 & 0.126799 \tabularnewline
17 & 0.149883 & 1.1513 & 0.127132 \tabularnewline
18 & -0.010032 & -0.0771 & 0.469421 \tabularnewline
19 & -0.018317 & -0.1407 & 0.444295 \tabularnewline
20 & -0.093589 & -0.7189 & 0.237528 \tabularnewline
21 & -0.050001 & -0.3841 & 0.351155 \tabularnewline
22 & -0.18924 & -1.4536 & 0.07568 \tabularnewline
23 & -0.051067 & -0.3923 & 0.348142 \tabularnewline
24 & -0.115933 & -0.8905 & 0.188408 \tabularnewline
25 & -0.079541 & -0.611 & 0.271784 \tabularnewline
26 & 0.088746 & 0.6817 & 0.249056 \tabularnewline
27 & -0.027687 & -0.2127 & 0.416161 \tabularnewline
28 & -0.004174 & -0.0321 & 0.487265 \tabularnewline
29 & 0.086173 & 0.6619 & 0.255303 \tabularnewline
30 & -0.08475 & -0.651 & 0.258795 \tabularnewline
31 & -0.173748 & -1.3346 & 0.09357 \tabularnewline
32 & -0.071293 & -0.5476 & 0.293011 \tabularnewline
33 & -0.090575 & -0.6957 & 0.244667 \tabularnewline
34 & 0.043954 & 0.3376 & 0.368424 \tabularnewline
35 & -0.132602 & -1.0185 & 0.156291 \tabularnewline
36 & 0.045591 & 0.3502 & 0.363722 \tabularnewline
37 & 0.005888 & 0.0452 & 0.48204 \tabularnewline
38 & -0.090436 & -0.6947 & 0.244999 \tabularnewline
39 & 0.023771 & 0.1826 & 0.427874 \tabularnewline
40 & -0.03674 & -0.2822 & 0.389387 \tabularnewline
41 & -0.078609 & -0.6038 & 0.274142 \tabularnewline
42 & 0.063083 & 0.4846 & 0.314895 \tabularnewline
43 & -0.007848 & -0.0603 & 0.476066 \tabularnewline
44 & 0.012945 & 0.0994 & 0.460568 \tabularnewline
45 & -0.038896 & -0.2988 & 0.383084 \tabularnewline
46 & -0.027498 & -0.2112 & 0.416723 \tabularnewline
47 & 0.094163 & 0.7233 & 0.236184 \tabularnewline
48 & 0.009183 & 0.0705 & 0.472003 \tabularnewline
\hline
\end{tabular}
%Source: https://freestatistics.org/blog/index.php?pk=&T=2

[TABLE]
[ROW][C]Partial Autocorrelation Function[/C][/ROW]
[ROW][C]Time lag k[/C][C]PACF(k)[/C][C]T-STAT[/C][C]P-value[/C][/ROW]
[ROW][C]1[/C][C]-0.19843[/C][C]-1.5242[/C][C]0.066405[/C][/ROW]
[ROW][C]2[/C][C]-0.412765[/C][C]-3.1705[/C][C]0.001207[/C][/ROW]
[ROW][C]3[/C][C]-0.229806[/C][C]-1.7652[/C][C]0.041355[/C][/ROW]
[ROW][C]4[/C][C]-0.169016[/C][C]-1.2982[/C][C]0.09963[/C][/ROW]
[ROW][C]5[/C][C]-0.18405[/C][C]-1.4137[/C][C]0.081351[/C][/ROW]
[ROW][C]6[/C][C]-0.196979[/C][C]-1.513[/C][C]0.067807[/C][/ROW]
[ROW][C]7[/C][C]0.135637[/C][C]1.0418[/C][C]0.150866[/C][/ROW]
[ROW][C]8[/C][C]0.059187[/C][C]0.4546[/C][C]0.325523[/C][/ROW]
[ROW][C]9[/C][C]0.219969[/C][C]1.6896[/C][C]0.04819[/C][/ROW]
[ROW][C]10[/C][C]-0.271632[/C][C]-2.0864[/C][C]0.020635[/C][/ROW]
[ROW][C]11[/C][C]-0.215129[/C][C]-1.6524[/C][C]0.051879[/C][/ROW]
[ROW][C]12[/C][C]0.184247[/C][C]1.4152[/C][C]0.081129[/C][/ROW]
[ROW][C]13[/C][C]0.109796[/C][C]0.8434[/C][C]0.201216[/C][/ROW]
[ROW][C]14[/C][C]0.152696[/C][C]1.1729[/C][C]0.122779[/C][/ROW]
[ROW][C]15[/C][C]-0.026118[/C][C]-0.2006[/C][C]0.420844[/C][/ROW]
[ROW][C]16[/C][C]-0.150096[/C][C]-1.1529[/C][C]0.126799[/C][/ROW]
[ROW][C]17[/C][C]0.149883[/C][C]1.1513[/C][C]0.127132[/C][/ROW]
[ROW][C]18[/C][C]-0.010032[/C][C]-0.0771[/C][C]0.469421[/C][/ROW]
[ROW][C]19[/C][C]-0.018317[/C][C]-0.1407[/C][C]0.444295[/C][/ROW]
[ROW][C]20[/C][C]-0.093589[/C][C]-0.7189[/C][C]0.237528[/C][/ROW]
[ROW][C]21[/C][C]-0.050001[/C][C]-0.3841[/C][C]0.351155[/C][/ROW]
[ROW][C]22[/C][C]-0.18924[/C][C]-1.4536[/C][C]0.07568[/C][/ROW]
[ROW][C]23[/C][C]-0.051067[/C][C]-0.3923[/C][C]0.348142[/C][/ROW]
[ROW][C]24[/C][C]-0.115933[/C][C]-0.8905[/C][C]0.188408[/C][/ROW]
[ROW][C]25[/C][C]-0.079541[/C][C]-0.611[/C][C]0.271784[/C][/ROW]
[ROW][C]26[/C][C]0.088746[/C][C]0.6817[/C][C]0.249056[/C][/ROW]
[ROW][C]27[/C][C]-0.027687[/C][C]-0.2127[/C][C]0.416161[/C][/ROW]
[ROW][C]28[/C][C]-0.004174[/C][C]-0.0321[/C][C]0.487265[/C][/ROW]
[ROW][C]29[/C][C]0.086173[/C][C]0.6619[/C][C]0.255303[/C][/ROW]
[ROW][C]30[/C][C]-0.08475[/C][C]-0.651[/C][C]0.258795[/C][/ROW]
[ROW][C]31[/C][C]-0.173748[/C][C]-1.3346[/C][C]0.09357[/C][/ROW]
[ROW][C]32[/C][C]-0.071293[/C][C]-0.5476[/C][C]0.293011[/C][/ROW]
[ROW][C]33[/C][C]-0.090575[/C][C]-0.6957[/C][C]0.244667[/C][/ROW]
[ROW][C]34[/C][C]0.043954[/C][C]0.3376[/C][C]0.368424[/C][/ROW]
[ROW][C]35[/C][C]-0.132602[/C][C]-1.0185[/C][C]0.156291[/C][/ROW]
[ROW][C]36[/C][C]0.045591[/C][C]0.3502[/C][C]0.363722[/C][/ROW]
[ROW][C]37[/C][C]0.005888[/C][C]0.0452[/C][C]0.48204[/C][/ROW]
[ROW][C]38[/C][C]-0.090436[/C][C]-0.6947[/C][C]0.244999[/C][/ROW]
[ROW][C]39[/C][C]0.023771[/C][C]0.1826[/C][C]0.427874[/C][/ROW]
[ROW][C]40[/C][C]-0.03674[/C][C]-0.2822[/C][C]0.389387[/C][/ROW]
[ROW][C]41[/C][C]-0.078609[/C][C]-0.6038[/C][C]0.274142[/C][/ROW]
[ROW][C]42[/C][C]0.063083[/C][C]0.4846[/C][C]0.314895[/C][/ROW]
[ROW][C]43[/C][C]-0.007848[/C][C]-0.0603[/C][C]0.476066[/C][/ROW]
[ROW][C]44[/C][C]0.012945[/C][C]0.0994[/C][C]0.460568[/C][/ROW]
[ROW][C]45[/C][C]-0.038896[/C][C]-0.2988[/C][C]0.383084[/C][/ROW]
[ROW][C]46[/C][C]-0.027498[/C][C]-0.2112[/C][C]0.416723[/C][/ROW]
[ROW][C]47[/C][C]0.094163[/C][C]0.7233[/C][C]0.236184[/C][/ROW]
[ROW][C]48[/C][C]0.009183[/C][C]0.0705[/C][C]0.472003[/C][/ROW]
[/TABLE]
Source: https://freestatistics.org/blog/index.php?pk=&T=2

Globally Unique Identifier (entire table): ba.freestatistics.org/blog/index.php?pk=&T=2

As an alternative you can also use a QR Code:  

The GUIDs for individual cells are displayed in the table below:

Partial Autocorrelation Function
Time lag kPACF(k)T-STATP-value
1-0.19843-1.52420.066405
2-0.412765-3.17050.001207
3-0.229806-1.76520.041355
4-0.169016-1.29820.09963
5-0.18405-1.41370.081351
6-0.196979-1.5130.067807
70.1356371.04180.150866
80.0591870.45460.325523
90.2199691.68960.04819
10-0.271632-2.08640.020635
11-0.215129-1.65240.051879
120.1842471.41520.081129
130.1097960.84340.201216
140.1526961.17290.122779
15-0.026118-0.20060.420844
16-0.150096-1.15290.126799
170.1498831.15130.127132
18-0.010032-0.07710.469421
19-0.018317-0.14070.444295
20-0.093589-0.71890.237528
21-0.050001-0.38410.351155
22-0.18924-1.45360.07568
23-0.051067-0.39230.348142
24-0.115933-0.89050.188408
25-0.079541-0.6110.271784
260.0887460.68170.249056
27-0.027687-0.21270.416161
28-0.004174-0.03210.487265
290.0861730.66190.255303
30-0.08475-0.6510.258795
31-0.173748-1.33460.09357
32-0.071293-0.54760.293011
33-0.090575-0.69570.244667
340.0439540.33760.368424
35-0.132602-1.01850.156291
360.0455910.35020.363722
370.0058880.04520.48204
38-0.090436-0.69470.244999
390.0237710.18260.427874
40-0.03674-0.28220.389387
41-0.078609-0.60380.274142
420.0630830.48460.314895
43-0.007848-0.06030.476066
440.0129450.09940.460568
45-0.038896-0.29880.383084
46-0.027498-0.21120.416723
470.0941630.72330.236184
480.0091830.07050.472003


Parameters (Session):
par1 = 48 ; par2 = 1 ; par3 = 1 ; par4 = 0 ; par5 = 12 ; par6 = White Noise ; par7 = 0.95 ;
Parameters (R input):
par1 = 48 ; par2 = 1 ; par3 = 1 ; par4 = 0 ; par5 = 12 ; par6 = White Noise ; par7 = 0.95 ; par8 = ;
R code (references can be found in the software module):
if (par1 == 'Default') {
par1 = 10*log10(length(x))
} else {
par1 <- as.numeric(par1)
}
par2 <- as.numeric(par2)
par3 <- as.numeric(par3)
par4 <- as.numeric(par4)
par5 <- as.numeric(par5)
if (par6 == 'White Noise') par6 <- 'white' else par6 <- 'ma'
par7 <- as.numeric(par7)
if (par8 != '') par8 <- as.numeric(par8)
x <- na.omit(x)
ox <- x
if (par8 == '') {
if (par2 == 0) {
x <- log(x)
} else {
x <- (x ^ par2 - 1) / par2
}
} else {
x <- log(x,base=par8)
}
if (par3 > 0) x <- diff(x,lag=1,difference=par3)
if (par4 > 0) x <- diff(x,lag=par5,difference=par4)
bitmap(file='picts.png')
op <- par(mfrow=c(2,1))
plot(ox,type='l',main='Original Time Series',xlab='time',ylab='value')
if (par8=='') {
mytitle <- paste('Working Time Series (lambda=',par2,', d=',par3,', D=',par4,')',sep='')
mysub <- paste('(lambda=',par2,', d=',par3,', D=',par4,', CI=', par7, ', CI type=',par6,')',sep='')
} else {
mytitle <- paste('Working Time Series (base=',par8,', d=',par3,', D=',par4,')',sep='')
mysub <- paste('(base=',par8,', d=',par3,', D=',par4,', CI=', par7, ', CI type=',par6,')',sep='')
}
plot(x,type='l', main=mytitle,xlab='time',ylab='value')
par(op)
dev.off()
bitmap(file='pic1.png')
racf <- acf(x, par1, main='Autocorrelation', xlab='time lag', ylab='ACF', ci.type=par6, ci=par7, sub=mysub)
dev.off()
bitmap(file='pic2.png')
rpacf <- pacf(x,par1,main='Partial Autocorrelation',xlab='lags',ylab='PACF',sub=mysub)
dev.off()
(myacf <- c(racf$acf))
(mypacf <- c(rpacf$acf))
lengthx <- length(x)
sqrtn <- sqrt(lengthx)
load(file='createtable')
a<-table.start()
a<-table.row.start(a)
a<-table.element(a,'Autocorrelation Function',4,TRUE)
a<-table.row.end(a)
a<-table.row.start(a)
a<-table.element(a,'Time lag k',header=TRUE)
a<-table.element(a,hyperlink('basics.htm','ACF(k)','click here for more information about the Autocorrelation Function'),header=TRUE)
a<-table.element(a,'T-STAT',header=TRUE)
a<-table.element(a,'P-value',header=TRUE)
a<-table.row.end(a)
for (i in 2:(par1+1)) {
a<-table.row.start(a)
a<-table.element(a,i-1,header=TRUE)
a<-table.element(a,round(myacf[i],6))
mytstat <- myacf[i]*sqrtn
a<-table.element(a,round(mytstat,4))
a<-table.element(a,round(1-pt(abs(mytstat),lengthx),6))
a<-table.row.end(a)
}
a<-table.end(a)
table.save(a,file='mytable.tab')
a<-table.start()
a<-table.row.start(a)
a<-table.element(a,'Partial Autocorrelation Function',4,TRUE)
a<-table.row.end(a)
a<-table.row.start(a)
a<-table.element(a,'Time lag k',header=TRUE)
a<-table.element(a,hyperlink('basics.htm','PACF(k)','click here for more information about the Partial Autocorrelation Function'),header=TRUE)
a<-table.element(a,'T-STAT',header=TRUE)
a<-table.element(a,'P-value',header=TRUE)
a<-table.row.end(a)
for (i in 1:par1) {
a<-table.row.start(a)
a<-table.element(a,i,header=TRUE)
a<-table.element(a,round(mypacf[i],6))
mytstat <- mypacf[i]*sqrtn
a<-table.element(a,round(mytstat,4))
a<-table.element(a,round(1-pt(abs(mytstat),lengthx),6))
a<-table.row.end(a)
}
a<-table.end(a)
table.save(a,file='mytable1.tab')