Free Statistics

of Irreproducible Research!

Author's title

Author*Unverified author*
R Software Modulerwasp_autocorrelation.wasp
Title produced by software(Partial) Autocorrelation Function
Date of computationTue, 18 Oct 2016 17:56:08 +0100
Cite this page as followsStatistical Computations at FreeStatistics.org, Office for Research Development and Education, URL https://freestatistics.org/blog/index.php?v=date/2016/Oct/18/t1476809829i2j7czq3s92t79z.htm/, Retrieved Sat, 27 Apr 2024 15:22:27 +0200
Statistical Computations at FreeStatistics.org, Office for Research Development and Education, URL https://freestatistics.org/blog/index.php?pk=, Retrieved Sat, 27 Apr 2024 15:22:27 +0200
QR Codes:

Original text written by user:
IsPrivate?No (this computation is public)
User-defined keywords
Estimated Impact0
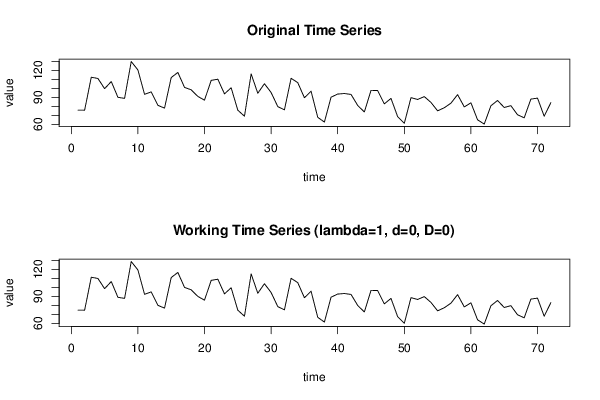
Dataseries X:
75,8
75,7
112,3
110,9
99,6
107,5
90
88,8
129,7
120,4
93,3
96
81,1
78
111,9
117,6
101
98,3
91
86,8
108,8
110,1
93,8
100,6
75,7
69
116
94,5
105,1
95,3
79,7
76,1
111,1
106,3
89,5
96,8
67,8
62,5
90,1
93,6
94,2
93,2
81
73,7
97,7
97,5
82,7
88,8
68,5
61,1
89,6
87,6
90,8
84,3
75
78,4
83,5
93
79,3
83,9
65
60,3
80,6
86,5
78,7
80,7
70,6
67,2
88
89,1
69
84,1


Summary of computational transaction
Raw Inputview raw input (R code)
Raw Outputview raw output of R engine
Computing time2 seconds
R Server'Herman Ole Andreas Wold' @ wold.wessa.net

\begin{tabular}{lllllllll}
\hline
Summary of computational transaction \tabularnewline
Raw Input & view raw input (R code)  \tabularnewline
Raw Output & view raw output of R engine  \tabularnewline
Computing time & 2 seconds \tabularnewline
R Server & 'Herman Ole Andreas Wold' @ wold.wessa.net \tabularnewline
\hline
\end{tabular}
%Source: https://freestatistics.org/blog/index.php?pk=&T=0

[TABLE]
[ROW][C]Summary of computational transaction[/C][/ROW]
[ROW][C]Raw Input[/C][C]view raw input (R code) [/C][/ROW]
[ROW][C]Raw Output[/C][C]view raw output of R engine [/C][/ROW]
[ROW][C]Computing time[/C][C]2 seconds[/C][/ROW]
[ROW][C]R Server[/C][C]'Herman Ole Andreas Wold' @ wold.wessa.net[/C][/ROW]
[/TABLE]
Source: https://freestatistics.org/blog/index.php?pk=&T=0

Globally Unique Identifier (entire table): ba.freestatistics.org/blog/index.php?pk=&T=0

As an alternative you can also use a QR Code:  

The GUIDs for individual cells are displayed in the table below:

Summary of computational transaction
Raw Inputview raw input (R code)
Raw Outputview raw output of R engine
Computing time2 seconds
R Server'Herman Ole Andreas Wold' @ wold.wessa.net


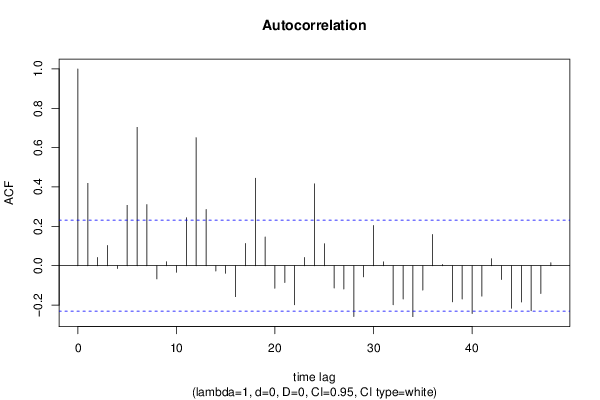
Autocorrelation Function
Time lag kACF(k)T-STATP-value
10.4183743.550.000342
20.0413870.35120.363239
30.1023890.86880.193923
4-0.014414-0.12230.4515
50.3064722.60050.005645
60.7031555.96650
70.3105182.63480.00515
8-0.067111-0.56950.285409
90.0202210.17160.432124
10-0.033558-0.28470.388327
110.2438652.06930.021056
120.6507715.5220
130.2857742.42490.008912
14-0.026861-0.22790.410176
15-0.038518-0.32680.372369
16-0.157419-1.33570.09292
170.1124730.95440.171547
180.4444553.77130.000165
190.1455691.23520.110387
20-0.114783-0.9740.166668
21-0.0852-0.72290.236028
22-0.198335-1.68290.04836
230.0415460.35250.362736
240.4159633.52960.000365
250.1114960.94610.173637
26-0.113231-0.96080.169934
27-0.118781-1.00790.158442
28-0.258449-2.1930.015769
29-0.056771-0.48170.315734
300.2043231.73370.043623
310.0195490.16590.434357
32-0.198982-1.68840.047829
33-0.16975-1.44040.077048
34-0.259099-2.19850.015563
35-0.124157-1.05350.147816
360.1581461.34190.091921
370.0057120.04850.480739
38-0.183862-1.56010.061558
39-0.169634-1.43940.077186
40-0.243304-2.06450.021287
41-0.154786-1.31340.096608
420.034960.29660.383797
43-0.070021-0.59420.277137
44-0.216241-1.83490.035328
45-0.184832-1.56840.060592
46-0.229245-1.94520.027827
47-0.141653-1.2020.116658
480.0153590.13030.448337

\begin{tabular}{lllllllll}
\hline
Autocorrelation Function \tabularnewline
Time lag k & ACF(k) & T-STAT & P-value \tabularnewline
1 & 0.418374 & 3.55 & 0.000342 \tabularnewline
2 & 0.041387 & 0.3512 & 0.363239 \tabularnewline
3 & 0.102389 & 0.8688 & 0.193923 \tabularnewline
4 & -0.014414 & -0.1223 & 0.4515 \tabularnewline
5 & 0.306472 & 2.6005 & 0.005645 \tabularnewline
6 & 0.703155 & 5.9665 & 0 \tabularnewline
7 & 0.310518 & 2.6348 & 0.00515 \tabularnewline
8 & -0.067111 & -0.5695 & 0.285409 \tabularnewline
9 & 0.020221 & 0.1716 & 0.432124 \tabularnewline
10 & -0.033558 & -0.2847 & 0.388327 \tabularnewline
11 & 0.243865 & 2.0693 & 0.021056 \tabularnewline
12 & 0.650771 & 5.522 & 0 \tabularnewline
13 & 0.285774 & 2.4249 & 0.008912 \tabularnewline
14 & -0.026861 & -0.2279 & 0.410176 \tabularnewline
15 & -0.038518 & -0.3268 & 0.372369 \tabularnewline
16 & -0.157419 & -1.3357 & 0.09292 \tabularnewline
17 & 0.112473 & 0.9544 & 0.171547 \tabularnewline
18 & 0.444455 & 3.7713 & 0.000165 \tabularnewline
19 & 0.145569 & 1.2352 & 0.110387 \tabularnewline
20 & -0.114783 & -0.974 & 0.166668 \tabularnewline
21 & -0.0852 & -0.7229 & 0.236028 \tabularnewline
22 & -0.198335 & -1.6829 & 0.04836 \tabularnewline
23 & 0.041546 & 0.3525 & 0.362736 \tabularnewline
24 & 0.415963 & 3.5296 & 0.000365 \tabularnewline
25 & 0.111496 & 0.9461 & 0.173637 \tabularnewline
26 & -0.113231 & -0.9608 & 0.169934 \tabularnewline
27 & -0.118781 & -1.0079 & 0.158442 \tabularnewline
28 & -0.258449 & -2.193 & 0.015769 \tabularnewline
29 & -0.056771 & -0.4817 & 0.315734 \tabularnewline
30 & 0.204323 & 1.7337 & 0.043623 \tabularnewline
31 & 0.019549 & 0.1659 & 0.434357 \tabularnewline
32 & -0.198982 & -1.6884 & 0.047829 \tabularnewline
33 & -0.16975 & -1.4404 & 0.077048 \tabularnewline
34 & -0.259099 & -2.1985 & 0.015563 \tabularnewline
35 & -0.124157 & -1.0535 & 0.147816 \tabularnewline
36 & 0.158146 & 1.3419 & 0.091921 \tabularnewline
37 & 0.005712 & 0.0485 & 0.480739 \tabularnewline
38 & -0.183862 & -1.5601 & 0.061558 \tabularnewline
39 & -0.169634 & -1.4394 & 0.077186 \tabularnewline
40 & -0.243304 & -2.0645 & 0.021287 \tabularnewline
41 & -0.154786 & -1.3134 & 0.096608 \tabularnewline
42 & 0.03496 & 0.2966 & 0.383797 \tabularnewline
43 & -0.070021 & -0.5942 & 0.277137 \tabularnewline
44 & -0.216241 & -1.8349 & 0.035328 \tabularnewline
45 & -0.184832 & -1.5684 & 0.060592 \tabularnewline
46 & -0.229245 & -1.9452 & 0.027827 \tabularnewline
47 & -0.141653 & -1.202 & 0.116658 \tabularnewline
48 & 0.015359 & 0.1303 & 0.448337 \tabularnewline
\hline
\end{tabular}
%Source: https://freestatistics.org/blog/index.php?pk=&T=1

[TABLE]
[ROW][C]Autocorrelation Function[/C][/ROW]
[ROW][C]Time lag k[/C][C]ACF(k)[/C][C]T-STAT[/C][C]P-value[/C][/ROW]
[ROW][C]1[/C][C]0.418374[/C][C]3.55[/C][C]0.000342[/C][/ROW]
[ROW][C]2[/C][C]0.041387[/C][C]0.3512[/C][C]0.363239[/C][/ROW]
[ROW][C]3[/C][C]0.102389[/C][C]0.8688[/C][C]0.193923[/C][/ROW]
[ROW][C]4[/C][C]-0.014414[/C][C]-0.1223[/C][C]0.4515[/C][/ROW]
[ROW][C]5[/C][C]0.306472[/C][C]2.6005[/C][C]0.005645[/C][/ROW]
[ROW][C]6[/C][C]0.703155[/C][C]5.9665[/C][C]0[/C][/ROW]
[ROW][C]7[/C][C]0.310518[/C][C]2.6348[/C][C]0.00515[/C][/ROW]
[ROW][C]8[/C][C]-0.067111[/C][C]-0.5695[/C][C]0.285409[/C][/ROW]
[ROW][C]9[/C][C]0.020221[/C][C]0.1716[/C][C]0.432124[/C][/ROW]
[ROW][C]10[/C][C]-0.033558[/C][C]-0.2847[/C][C]0.388327[/C][/ROW]
[ROW][C]11[/C][C]0.243865[/C][C]2.0693[/C][C]0.021056[/C][/ROW]
[ROW][C]12[/C][C]0.650771[/C][C]5.522[/C][C]0[/C][/ROW]
[ROW][C]13[/C][C]0.285774[/C][C]2.4249[/C][C]0.008912[/C][/ROW]
[ROW][C]14[/C][C]-0.026861[/C][C]-0.2279[/C][C]0.410176[/C][/ROW]
[ROW][C]15[/C][C]-0.038518[/C][C]-0.3268[/C][C]0.372369[/C][/ROW]
[ROW][C]16[/C][C]-0.157419[/C][C]-1.3357[/C][C]0.09292[/C][/ROW]
[ROW][C]17[/C][C]0.112473[/C][C]0.9544[/C][C]0.171547[/C][/ROW]
[ROW][C]18[/C][C]0.444455[/C][C]3.7713[/C][C]0.000165[/C][/ROW]
[ROW][C]19[/C][C]0.145569[/C][C]1.2352[/C][C]0.110387[/C][/ROW]
[ROW][C]20[/C][C]-0.114783[/C][C]-0.974[/C][C]0.166668[/C][/ROW]
[ROW][C]21[/C][C]-0.0852[/C][C]-0.7229[/C][C]0.236028[/C][/ROW]
[ROW][C]22[/C][C]-0.198335[/C][C]-1.6829[/C][C]0.04836[/C][/ROW]
[ROW][C]23[/C][C]0.041546[/C][C]0.3525[/C][C]0.362736[/C][/ROW]
[ROW][C]24[/C][C]0.415963[/C][C]3.5296[/C][C]0.000365[/C][/ROW]
[ROW][C]25[/C][C]0.111496[/C][C]0.9461[/C][C]0.173637[/C][/ROW]
[ROW][C]26[/C][C]-0.113231[/C][C]-0.9608[/C][C]0.169934[/C][/ROW]
[ROW][C]27[/C][C]-0.118781[/C][C]-1.0079[/C][C]0.158442[/C][/ROW]
[ROW][C]28[/C][C]-0.258449[/C][C]-2.193[/C][C]0.015769[/C][/ROW]
[ROW][C]29[/C][C]-0.056771[/C][C]-0.4817[/C][C]0.315734[/C][/ROW]
[ROW][C]30[/C][C]0.204323[/C][C]1.7337[/C][C]0.043623[/C][/ROW]
[ROW][C]31[/C][C]0.019549[/C][C]0.1659[/C][C]0.434357[/C][/ROW]
[ROW][C]32[/C][C]-0.198982[/C][C]-1.6884[/C][C]0.047829[/C][/ROW]
[ROW][C]33[/C][C]-0.16975[/C][C]-1.4404[/C][C]0.077048[/C][/ROW]
[ROW][C]34[/C][C]-0.259099[/C][C]-2.1985[/C][C]0.015563[/C][/ROW]
[ROW][C]35[/C][C]-0.124157[/C][C]-1.0535[/C][C]0.147816[/C][/ROW]
[ROW][C]36[/C][C]0.158146[/C][C]1.3419[/C][C]0.091921[/C][/ROW]
[ROW][C]37[/C][C]0.005712[/C][C]0.0485[/C][C]0.480739[/C][/ROW]
[ROW][C]38[/C][C]-0.183862[/C][C]-1.5601[/C][C]0.061558[/C][/ROW]
[ROW][C]39[/C][C]-0.169634[/C][C]-1.4394[/C][C]0.077186[/C][/ROW]
[ROW][C]40[/C][C]-0.243304[/C][C]-2.0645[/C][C]0.021287[/C][/ROW]
[ROW][C]41[/C][C]-0.154786[/C][C]-1.3134[/C][C]0.096608[/C][/ROW]
[ROW][C]42[/C][C]0.03496[/C][C]0.2966[/C][C]0.383797[/C][/ROW]
[ROW][C]43[/C][C]-0.070021[/C][C]-0.5942[/C][C]0.277137[/C][/ROW]
[ROW][C]44[/C][C]-0.216241[/C][C]-1.8349[/C][C]0.035328[/C][/ROW]
[ROW][C]45[/C][C]-0.184832[/C][C]-1.5684[/C][C]0.060592[/C][/ROW]
[ROW][C]46[/C][C]-0.229245[/C][C]-1.9452[/C][C]0.027827[/C][/ROW]
[ROW][C]47[/C][C]-0.141653[/C][C]-1.202[/C][C]0.116658[/C][/ROW]
[ROW][C]48[/C][C]0.015359[/C][C]0.1303[/C][C]0.448337[/C][/ROW]
[/TABLE]
Source: https://freestatistics.org/blog/index.php?pk=&T=1

Globally Unique Identifier (entire table): ba.freestatistics.org/blog/index.php?pk=&T=1

As an alternative you can also use a QR Code:  

The GUIDs for individual cells are displayed in the table below:

Autocorrelation Function
Time lag kACF(k)T-STATP-value
10.4183743.550.000342
20.0413870.35120.363239
30.1023890.86880.193923
4-0.014414-0.12230.4515
50.3064722.60050.005645
60.7031555.96650
70.3105182.63480.00515
8-0.067111-0.56950.285409
90.0202210.17160.432124
10-0.033558-0.28470.388327
110.2438652.06930.021056
120.6507715.5220
130.2857742.42490.008912
14-0.026861-0.22790.410176
15-0.038518-0.32680.372369
16-0.157419-1.33570.09292
170.1124730.95440.171547
180.4444553.77130.000165
190.1455691.23520.110387
20-0.114783-0.9740.166668
21-0.0852-0.72290.236028
22-0.198335-1.68290.04836
230.0415460.35250.362736
240.4159633.52960.000365
250.1114960.94610.173637
26-0.113231-0.96080.169934
27-0.118781-1.00790.158442
28-0.258449-2.1930.015769
29-0.056771-0.48170.315734
300.2043231.73370.043623
310.0195490.16590.434357
32-0.198982-1.68840.047829
33-0.16975-1.44040.077048
34-0.259099-2.19850.015563
35-0.124157-1.05350.147816
360.1581461.34190.091921
370.0057120.04850.480739
38-0.183862-1.56010.061558
39-0.169634-1.43940.077186
40-0.243304-2.06450.021287
41-0.154786-1.31340.096608
420.034960.29660.383797
43-0.070021-0.59420.277137
44-0.216241-1.83490.035328
45-0.184832-1.56840.060592
46-0.229245-1.94520.027827
47-0.141653-1.2020.116658
480.0153590.13030.448337


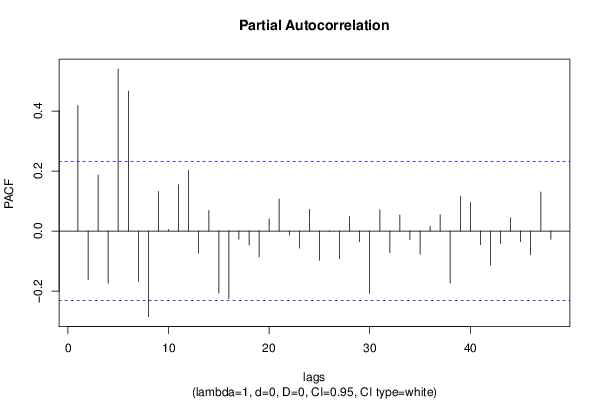
Partial Autocorrelation Function
Time lag kPACF(k)T-STATP-value
10.4183743.550.000342
2-0.162007-1.37470.086748
30.1867861.58490.058682
4-0.174093-1.47720.071988
50.540264.58439e-06
60.4665383.95878.7e-05
7-0.167555-1.42180.079708
8-0.285304-2.42090.009003
90.1319711.11980.133259
100.0052260.04430.482377
110.1543821.310.097184
120.2014541.70940.045843
13-0.073006-0.61950.268779
140.068770.58350.28068
15-0.206417-1.75150.042058
16-0.225472-1.91320.02985
17-0.027011-0.22920.409684
18-0.046763-0.39680.346346
19-0.085988-0.72960.23399
200.0401350.34060.367215
210.1070910.90870.18327
22-0.013227-0.11220.455476
23-0.056929-0.48310.31526
240.0723190.61360.270691
25-0.097507-0.82740.205379
26-0.001485-0.01260.49499
27-0.091899-0.77980.219036
280.048920.41510.339651
29-0.035247-0.29910.38287
30-0.20787-1.76380.041001
310.0712410.60450.273707
32-0.071814-0.60940.2721
330.053750.45610.32485
34-0.028366-0.24070.405238
35-0.077294-0.65590.257002
360.0161510.1370.44569
370.0544570.46210.322708
38-0.173335-1.47080.072852
390.1151450.9770.165911
400.0958070.8130.209463
41-0.045849-0.3890.349196
42-0.113105-0.95970.170203
43-0.042539-0.3610.359595
440.0441810.37490.354423
45-0.035945-0.3050.380623
46-0.078942-0.66980.25255
470.1301661.10450.136529
48-0.027623-0.23440.407674

\begin{tabular}{lllllllll}
\hline
Partial Autocorrelation Function \tabularnewline
Time lag k & PACF(k) & T-STAT & P-value \tabularnewline
1 & 0.418374 & 3.55 & 0.000342 \tabularnewline
2 & -0.162007 & -1.3747 & 0.086748 \tabularnewline
3 & 0.186786 & 1.5849 & 0.058682 \tabularnewline
4 & -0.174093 & -1.4772 & 0.071988 \tabularnewline
5 & 0.54026 & 4.5843 & 9e-06 \tabularnewline
6 & 0.466538 & 3.9587 & 8.7e-05 \tabularnewline
7 & -0.167555 & -1.4218 & 0.079708 \tabularnewline
8 & -0.285304 & -2.4209 & 0.009003 \tabularnewline
9 & 0.131971 & 1.1198 & 0.133259 \tabularnewline
10 & 0.005226 & 0.0443 & 0.482377 \tabularnewline
11 & 0.154382 & 1.31 & 0.097184 \tabularnewline
12 & 0.201454 & 1.7094 & 0.045843 \tabularnewline
13 & -0.073006 & -0.6195 & 0.268779 \tabularnewline
14 & 0.06877 & 0.5835 & 0.28068 \tabularnewline
15 & -0.206417 & -1.7515 & 0.042058 \tabularnewline
16 & -0.225472 & -1.9132 & 0.02985 \tabularnewline
17 & -0.027011 & -0.2292 & 0.409684 \tabularnewline
18 & -0.046763 & -0.3968 & 0.346346 \tabularnewline
19 & -0.085988 & -0.7296 & 0.23399 \tabularnewline
20 & 0.040135 & 0.3406 & 0.367215 \tabularnewline
21 & 0.107091 & 0.9087 & 0.18327 \tabularnewline
22 & -0.013227 & -0.1122 & 0.455476 \tabularnewline
23 & -0.056929 & -0.4831 & 0.31526 \tabularnewline
24 & 0.072319 & 0.6136 & 0.270691 \tabularnewline
25 & -0.097507 & -0.8274 & 0.205379 \tabularnewline
26 & -0.001485 & -0.0126 & 0.49499 \tabularnewline
27 & -0.091899 & -0.7798 & 0.219036 \tabularnewline
28 & 0.04892 & 0.4151 & 0.339651 \tabularnewline
29 & -0.035247 & -0.2991 & 0.38287 \tabularnewline
30 & -0.20787 & -1.7638 & 0.041001 \tabularnewline
31 & 0.071241 & 0.6045 & 0.273707 \tabularnewline
32 & -0.071814 & -0.6094 & 0.2721 \tabularnewline
33 & 0.05375 & 0.4561 & 0.32485 \tabularnewline
34 & -0.028366 & -0.2407 & 0.405238 \tabularnewline
35 & -0.077294 & -0.6559 & 0.257002 \tabularnewline
36 & 0.016151 & 0.137 & 0.44569 \tabularnewline
37 & 0.054457 & 0.4621 & 0.322708 \tabularnewline
38 & -0.173335 & -1.4708 & 0.072852 \tabularnewline
39 & 0.115145 & 0.977 & 0.165911 \tabularnewline
40 & 0.095807 & 0.813 & 0.209463 \tabularnewline
41 & -0.045849 & -0.389 & 0.349196 \tabularnewline
42 & -0.113105 & -0.9597 & 0.170203 \tabularnewline
43 & -0.042539 & -0.361 & 0.359595 \tabularnewline
44 & 0.044181 & 0.3749 & 0.354423 \tabularnewline
45 & -0.035945 & -0.305 & 0.380623 \tabularnewline
46 & -0.078942 & -0.6698 & 0.25255 \tabularnewline
47 & 0.130166 & 1.1045 & 0.136529 \tabularnewline
48 & -0.027623 & -0.2344 & 0.407674 \tabularnewline
\hline
\end{tabular}
%Source: https://freestatistics.org/blog/index.php?pk=&T=2

[TABLE]
[ROW][C]Partial Autocorrelation Function[/C][/ROW]
[ROW][C]Time lag k[/C][C]PACF(k)[/C][C]T-STAT[/C][C]P-value[/C][/ROW]
[ROW][C]1[/C][C]0.418374[/C][C]3.55[/C][C]0.000342[/C][/ROW]
[ROW][C]2[/C][C]-0.162007[/C][C]-1.3747[/C][C]0.086748[/C][/ROW]
[ROW][C]3[/C][C]0.186786[/C][C]1.5849[/C][C]0.058682[/C][/ROW]
[ROW][C]4[/C][C]-0.174093[/C][C]-1.4772[/C][C]0.071988[/C][/ROW]
[ROW][C]5[/C][C]0.54026[/C][C]4.5843[/C][C]9e-06[/C][/ROW]
[ROW][C]6[/C][C]0.466538[/C][C]3.9587[/C][C]8.7e-05[/C][/ROW]
[ROW][C]7[/C][C]-0.167555[/C][C]-1.4218[/C][C]0.079708[/C][/ROW]
[ROW][C]8[/C][C]-0.285304[/C][C]-2.4209[/C][C]0.009003[/C][/ROW]
[ROW][C]9[/C][C]0.131971[/C][C]1.1198[/C][C]0.133259[/C][/ROW]
[ROW][C]10[/C][C]0.005226[/C][C]0.0443[/C][C]0.482377[/C][/ROW]
[ROW][C]11[/C][C]0.154382[/C][C]1.31[/C][C]0.097184[/C][/ROW]
[ROW][C]12[/C][C]0.201454[/C][C]1.7094[/C][C]0.045843[/C][/ROW]
[ROW][C]13[/C][C]-0.073006[/C][C]-0.6195[/C][C]0.268779[/C][/ROW]
[ROW][C]14[/C][C]0.06877[/C][C]0.5835[/C][C]0.28068[/C][/ROW]
[ROW][C]15[/C][C]-0.206417[/C][C]-1.7515[/C][C]0.042058[/C][/ROW]
[ROW][C]16[/C][C]-0.225472[/C][C]-1.9132[/C][C]0.02985[/C][/ROW]
[ROW][C]17[/C][C]-0.027011[/C][C]-0.2292[/C][C]0.409684[/C][/ROW]
[ROW][C]18[/C][C]-0.046763[/C][C]-0.3968[/C][C]0.346346[/C][/ROW]
[ROW][C]19[/C][C]-0.085988[/C][C]-0.7296[/C][C]0.23399[/C][/ROW]
[ROW][C]20[/C][C]0.040135[/C][C]0.3406[/C][C]0.367215[/C][/ROW]
[ROW][C]21[/C][C]0.107091[/C][C]0.9087[/C][C]0.18327[/C][/ROW]
[ROW][C]22[/C][C]-0.013227[/C][C]-0.1122[/C][C]0.455476[/C][/ROW]
[ROW][C]23[/C][C]-0.056929[/C][C]-0.4831[/C][C]0.31526[/C][/ROW]
[ROW][C]24[/C][C]0.072319[/C][C]0.6136[/C][C]0.270691[/C][/ROW]
[ROW][C]25[/C][C]-0.097507[/C][C]-0.8274[/C][C]0.205379[/C][/ROW]
[ROW][C]26[/C][C]-0.001485[/C][C]-0.0126[/C][C]0.49499[/C][/ROW]
[ROW][C]27[/C][C]-0.091899[/C][C]-0.7798[/C][C]0.219036[/C][/ROW]
[ROW][C]28[/C][C]0.04892[/C][C]0.4151[/C][C]0.339651[/C][/ROW]
[ROW][C]29[/C][C]-0.035247[/C][C]-0.2991[/C][C]0.38287[/C][/ROW]
[ROW][C]30[/C][C]-0.20787[/C][C]-1.7638[/C][C]0.041001[/C][/ROW]
[ROW][C]31[/C][C]0.071241[/C][C]0.6045[/C][C]0.273707[/C][/ROW]
[ROW][C]32[/C][C]-0.071814[/C][C]-0.6094[/C][C]0.2721[/C][/ROW]
[ROW][C]33[/C][C]0.05375[/C][C]0.4561[/C][C]0.32485[/C][/ROW]
[ROW][C]34[/C][C]-0.028366[/C][C]-0.2407[/C][C]0.405238[/C][/ROW]
[ROW][C]35[/C][C]-0.077294[/C][C]-0.6559[/C][C]0.257002[/C][/ROW]
[ROW][C]36[/C][C]0.016151[/C][C]0.137[/C][C]0.44569[/C][/ROW]
[ROW][C]37[/C][C]0.054457[/C][C]0.4621[/C][C]0.322708[/C][/ROW]
[ROW][C]38[/C][C]-0.173335[/C][C]-1.4708[/C][C]0.072852[/C][/ROW]
[ROW][C]39[/C][C]0.115145[/C][C]0.977[/C][C]0.165911[/C][/ROW]
[ROW][C]40[/C][C]0.095807[/C][C]0.813[/C][C]0.209463[/C][/ROW]
[ROW][C]41[/C][C]-0.045849[/C][C]-0.389[/C][C]0.349196[/C][/ROW]
[ROW][C]42[/C][C]-0.113105[/C][C]-0.9597[/C][C]0.170203[/C][/ROW]
[ROW][C]43[/C][C]-0.042539[/C][C]-0.361[/C][C]0.359595[/C][/ROW]
[ROW][C]44[/C][C]0.044181[/C][C]0.3749[/C][C]0.354423[/C][/ROW]
[ROW][C]45[/C][C]-0.035945[/C][C]-0.305[/C][C]0.380623[/C][/ROW]
[ROW][C]46[/C][C]-0.078942[/C][C]-0.6698[/C][C]0.25255[/C][/ROW]
[ROW][C]47[/C][C]0.130166[/C][C]1.1045[/C][C]0.136529[/C][/ROW]
[ROW][C]48[/C][C]-0.027623[/C][C]-0.2344[/C][C]0.407674[/C][/ROW]
[/TABLE]
Source: https://freestatistics.org/blog/index.php?pk=&T=2

Globally Unique Identifier (entire table): ba.freestatistics.org/blog/index.php?pk=&T=2

As an alternative you can also use a QR Code:  

The GUIDs for individual cells are displayed in the table below:

Partial Autocorrelation Function
Time lag kPACF(k)T-STATP-value
10.4183743.550.000342
2-0.162007-1.37470.086748
30.1867861.58490.058682
4-0.174093-1.47720.071988
50.540264.58439e-06
60.4665383.95878.7e-05
7-0.167555-1.42180.079708
8-0.285304-2.42090.009003
90.1319711.11980.133259
100.0052260.04430.482377
110.1543821.310.097184
120.2014541.70940.045843
13-0.073006-0.61950.268779
140.068770.58350.28068
15-0.206417-1.75150.042058
16-0.225472-1.91320.02985
17-0.027011-0.22920.409684
18-0.046763-0.39680.346346
19-0.085988-0.72960.23399
200.0401350.34060.367215
210.1070910.90870.18327
22-0.013227-0.11220.455476
23-0.056929-0.48310.31526
240.0723190.61360.270691
25-0.097507-0.82740.205379
26-0.001485-0.01260.49499
27-0.091899-0.77980.219036
280.048920.41510.339651
29-0.035247-0.29910.38287
30-0.20787-1.76380.041001
310.0712410.60450.273707
32-0.071814-0.60940.2721
330.053750.45610.32485
34-0.028366-0.24070.405238
35-0.077294-0.65590.257002
360.0161510.1370.44569
370.0544570.46210.322708
38-0.173335-1.47080.072852
390.1151450.9770.165911
400.0958070.8130.209463
41-0.045849-0.3890.349196
42-0.113105-0.95970.170203
43-0.042539-0.3610.359595
440.0441810.37490.354423
45-0.035945-0.3050.380623
46-0.078942-0.66980.25255
470.1301661.10450.136529
48-0.027623-0.23440.407674


Parameters (Session):
par1 = 48 ; par2 = 1 ; par3 = 0 ; par4 = 0 ; par5 = 12 ; par6 = White Noise ; par7 = 0.95 ;
Parameters (R input):
par1 = 48 ; par2 = 1 ; par3 = 0 ; par4 = 0 ; par5 = 12 ; par6 = White Noise ; par7 = 0.95 ; par8 = ;
R code (references can be found in the software module):
if (par1 == 'Default') {
par1 = 10*log10(length(x))
} else {
par1 <- as.numeric(par1)
}
par2 <- as.numeric(par2)
par3 <- as.numeric(par3)
par4 <- as.numeric(par4)
par5 <- as.numeric(par5)
if (par6 == 'White Noise') par6 <- 'white' else par6 <- 'ma'
par7 <- as.numeric(par7)
if (par8 != '') par8 <- as.numeric(par8)
x <- na.omit(x)
ox <- x
if (par8 == '') {
if (par2 == 0) {
x <- log(x)
} else {
x <- (x ^ par2 - 1) / par2
}
} else {
x <- log(x,base=par8)
}
if (par3 > 0) x <- diff(x,lag=1,difference=par3)
if (par4 > 0) x <- diff(x,lag=par5,difference=par4)
bitmap(file='picts.png')
op <- par(mfrow=c(2,1))
plot(ox,type='l',main='Original Time Series',xlab='time',ylab='value')
if (par8=='') {
mytitle <- paste('Working Time Series (lambda=',par2,', d=',par3,', D=',par4,')',sep='')
mysub <- paste('(lambda=',par2,', d=',par3,', D=',par4,', CI=', par7, ', CI type=',par6,')',sep='')
} else {
mytitle <- paste('Working Time Series (base=',par8,', d=',par3,', D=',par4,')',sep='')
mysub <- paste('(base=',par8,', d=',par3,', D=',par4,', CI=', par7, ', CI type=',par6,')',sep='')
}
plot(x,type='l', main=mytitle,xlab='time',ylab='value')
par(op)
dev.off()
bitmap(file='pic1.png')
racf <- acf(x, par1, main='Autocorrelation', xlab='time lag', ylab='ACF', ci.type=par6, ci=par7, sub=mysub)
dev.off()
bitmap(file='pic2.png')
rpacf <- pacf(x,par1,main='Partial Autocorrelation',xlab='lags',ylab='PACF',sub=mysub)
dev.off()
(myacf <- c(racf$acf))
(mypacf <- c(rpacf$acf))
lengthx <- length(x)
sqrtn <- sqrt(lengthx)
load(file='createtable')
a<-table.start()
a<-table.row.start(a)
a<-table.element(a,'Autocorrelation Function',4,TRUE)
a<-table.row.end(a)
a<-table.row.start(a)
a<-table.element(a,'Time lag k',header=TRUE)
a<-table.element(a,hyperlink('basics.htm','ACF(k)','click here for more information about the Autocorrelation Function'),header=TRUE)
a<-table.element(a,'T-STAT',header=TRUE)
a<-table.element(a,'P-value',header=TRUE)
a<-table.row.end(a)
for (i in 2:(par1+1)) {
a<-table.row.start(a)
a<-table.element(a,i-1,header=TRUE)
a<-table.element(a,round(myacf[i],6))
mytstat <- myacf[i]*sqrtn
a<-table.element(a,round(mytstat,4))
a<-table.element(a,round(1-pt(abs(mytstat),lengthx),6))
a<-table.row.end(a)
}
a<-table.end(a)
table.save(a,file='mytable.tab')
a<-table.start()
a<-table.row.start(a)
a<-table.element(a,'Partial Autocorrelation Function',4,TRUE)
a<-table.row.end(a)
a<-table.row.start(a)
a<-table.element(a,'Time lag k',header=TRUE)
a<-table.element(a,hyperlink('basics.htm','PACF(k)','click here for more information about the Partial Autocorrelation Function'),header=TRUE)
a<-table.element(a,'T-STAT',header=TRUE)
a<-table.element(a,'P-value',header=TRUE)
a<-table.row.end(a)
for (i in 1:par1) {
a<-table.row.start(a)
a<-table.element(a,i,header=TRUE)
a<-table.element(a,round(mypacf[i],6))
mytstat <- mypacf[i]*sqrtn
a<-table.element(a,round(mytstat,4))
a<-table.element(a,round(1-pt(abs(mytstat),lengthx),6))
a<-table.row.end(a)
}
a<-table.end(a)
table.save(a,file='mytable1.tab')