Free Statistics

of Irreproducible Research!

Author's title

Author*Unverified author*
R Software Modulerwasp_autocorrelation.wasp
Title produced by software(Partial) Autocorrelation Function
Date of computationTue, 18 Oct 2016 19:24:44 +0100
Cite this page as followsStatistical Computations at FreeStatistics.org, Office for Research Development and Education, URL https://freestatistics.org/blog/index.php?v=date/2016/Oct/18/t1476815105sdsb36dsva57k4y.htm/, Retrieved Sun, 28 Apr 2024 03:19:38 +0200
Statistical Computations at FreeStatistics.org, Office for Research Development and Education, URL https://freestatistics.org/blog/index.php?pk=, Retrieved Sun, 28 Apr 2024 03:19:38 +0200
QR Codes:

Original text written by user:
IsPrivate?No (this computation is public)
User-defined keywords
Estimated Impact0
Dataseries X:
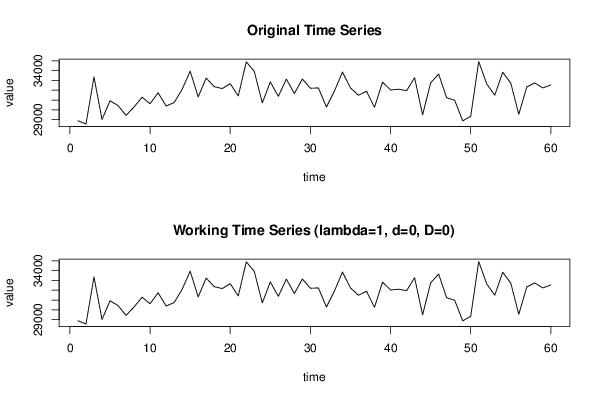
28886
28549
33348
29017
30924
30435
29431
30290
31286
30622
31742
30391
30740
32086
33947
31312
33239
32362
32170
32665
31412
34891
33919
30706
32846
31368
33130
31665
33139
32201
32230
30287
31918
33853
32232
31484
31902
30260
32823
32018
32100
31952
33274
29491
32751
33643
31226
30976
28880
29325
34923
32642
31487
33832
32724
29545
32338
32743
32231
32536


Summary of computational transaction
Raw Inputview raw input (R code)
Raw Outputview raw output of R engine
Computing time1 seconds
R Server'Sir Ronald Aylmer Fisher' @ fisher.wessa.net

\begin{tabular}{lllllllll}
\hline
Summary of computational transaction \tabularnewline
Raw Input & view raw input (R code)  \tabularnewline
Raw Output & view raw output of R engine  \tabularnewline
Computing time & 1 seconds \tabularnewline
R Server & 'Sir Ronald Aylmer Fisher' @ fisher.wessa.net \tabularnewline
\hline
\end{tabular}
%Source: https://freestatistics.org/blog/index.php?pk=&T=0

[TABLE]
[ROW][C]Summary of computational transaction[/C][/ROW]
[ROW][C]Raw Input[/C][C]view raw input (R code) [/C][/ROW]
[ROW][C]Raw Output[/C][C]view raw output of R engine [/C][/ROW]
[ROW][C]Computing time[/C][C]1 seconds[/C][/ROW]
[ROW][C]R Server[/C][C]'Sir Ronald Aylmer Fisher' @ fisher.wessa.net[/C][/ROW]
[/TABLE]
Source: https://freestatistics.org/blog/index.php?pk=&T=0

Globally Unique Identifier (entire table): ba.freestatistics.org/blog/index.php?pk=&T=0

As an alternative you can also use a QR Code:  

The GUIDs for individual cells are displayed in the table below:

Summary of computational transaction
Raw Inputview raw input (R code)
Raw Outputview raw output of R engine
Computing time1 seconds
R Server'Sir Ronald Aylmer Fisher' @ fisher.wessa.net


Autocorrelation Function
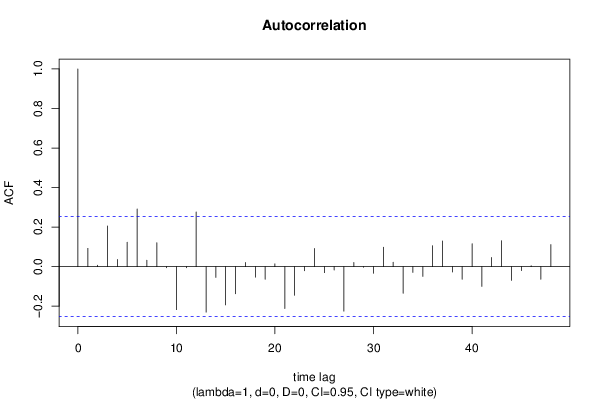
Time lag kACF(k)T-STATP-value
10.0924870.71640.238262
20.0071870.05570.477894
30.2055961.59250.058259
40.0357650.2770.391354
50.1235040.95670.17129
60.291452.25760.013812
70.0324320.25120.401251
80.1210570.93770.176079
9-0.005625-0.04360.482695
10-0.217661-1.6860.048495
11-0.005637-0.04370.482657
120.2760772.13850.018279
13-0.230137-1.78260.039853
14-0.054419-0.42150.337438
15-0.19358-1.49950.069498
16-0.136964-1.06090.14649
170.020750.16070.436423
18-0.053125-0.41150.341084
19-0.063679-0.49330.311817
200.0138520.10730.457455
21-0.211811-1.64070.053048
22-0.145173-1.12450.132639
23-0.02099-0.16260.435694
240.0914630.70850.240698
25-0.030404-0.23550.407309
26-0.017515-0.13570.446268
27-0.225072-1.74340.043193
280.0208370.16140.436159
29-0.002949-0.02280.490925
30-0.033302-0.2580.39866
310.098410.76230.22444
320.0225880.1750.430848
33-0.134602-1.04260.150652
34-0.029298-0.22690.410621
35-0.049204-0.38110.352226
360.1059980.82110.207432
370.1301281.0080.15876
38-0.026926-0.20860.417746
39-0.063495-0.49180.312318
400.1158530.89740.186549
41-0.099929-0.7740.220971
420.0463350.35890.36046
430.1310431.01510.157077
44-0.069411-0.53770.296401
45-0.020062-0.15540.438514
460.0046210.03580.485783
47-0.063775-0.4940.311556
480.1115480.8640.195502

\begin{tabular}{lllllllll}
\hline
Autocorrelation Function \tabularnewline
Time lag k & ACF(k) & T-STAT & P-value \tabularnewline
1 & 0.092487 & 0.7164 & 0.238262 \tabularnewline
2 & 0.007187 & 0.0557 & 0.477894 \tabularnewline
3 & 0.205596 & 1.5925 & 0.058259 \tabularnewline
4 & 0.035765 & 0.277 & 0.391354 \tabularnewline
5 & 0.123504 & 0.9567 & 0.17129 \tabularnewline
6 & 0.29145 & 2.2576 & 0.013812 \tabularnewline
7 & 0.032432 & 0.2512 & 0.401251 \tabularnewline
8 & 0.121057 & 0.9377 & 0.176079 \tabularnewline
9 & -0.005625 & -0.0436 & 0.482695 \tabularnewline
10 & -0.217661 & -1.686 & 0.048495 \tabularnewline
11 & -0.005637 & -0.0437 & 0.482657 \tabularnewline
12 & 0.276077 & 2.1385 & 0.018279 \tabularnewline
13 & -0.230137 & -1.7826 & 0.039853 \tabularnewline
14 & -0.054419 & -0.4215 & 0.337438 \tabularnewline
15 & -0.19358 & -1.4995 & 0.069498 \tabularnewline
16 & -0.136964 & -1.0609 & 0.14649 \tabularnewline
17 & 0.02075 & 0.1607 & 0.436423 \tabularnewline
18 & -0.053125 & -0.4115 & 0.341084 \tabularnewline
19 & -0.063679 & -0.4933 & 0.311817 \tabularnewline
20 & 0.013852 & 0.1073 & 0.457455 \tabularnewline
21 & -0.211811 & -1.6407 & 0.053048 \tabularnewline
22 & -0.145173 & -1.1245 & 0.132639 \tabularnewline
23 & -0.02099 & -0.1626 & 0.435694 \tabularnewline
24 & 0.091463 & 0.7085 & 0.240698 \tabularnewline
25 & -0.030404 & -0.2355 & 0.407309 \tabularnewline
26 & -0.017515 & -0.1357 & 0.446268 \tabularnewline
27 & -0.225072 & -1.7434 & 0.043193 \tabularnewline
28 & 0.020837 & 0.1614 & 0.436159 \tabularnewline
29 & -0.002949 & -0.0228 & 0.490925 \tabularnewline
30 & -0.033302 & -0.258 & 0.39866 \tabularnewline
31 & 0.09841 & 0.7623 & 0.22444 \tabularnewline
32 & 0.022588 & 0.175 & 0.430848 \tabularnewline
33 & -0.134602 & -1.0426 & 0.150652 \tabularnewline
34 & -0.029298 & -0.2269 & 0.410621 \tabularnewline
35 & -0.049204 & -0.3811 & 0.352226 \tabularnewline
36 & 0.105998 & 0.8211 & 0.207432 \tabularnewline
37 & 0.130128 & 1.008 & 0.15876 \tabularnewline
38 & -0.026926 & -0.2086 & 0.417746 \tabularnewline
39 & -0.063495 & -0.4918 & 0.312318 \tabularnewline
40 & 0.115853 & 0.8974 & 0.186549 \tabularnewline
41 & -0.099929 & -0.774 & 0.220971 \tabularnewline
42 & 0.046335 & 0.3589 & 0.36046 \tabularnewline
43 & 0.131043 & 1.0151 & 0.157077 \tabularnewline
44 & -0.069411 & -0.5377 & 0.296401 \tabularnewline
45 & -0.020062 & -0.1554 & 0.438514 \tabularnewline
46 & 0.004621 & 0.0358 & 0.485783 \tabularnewline
47 & -0.063775 & -0.494 & 0.311556 \tabularnewline
48 & 0.111548 & 0.864 & 0.195502 \tabularnewline
\hline
\end{tabular}
%Source: https://freestatistics.org/blog/index.php?pk=&T=1

[TABLE]
[ROW][C]Autocorrelation Function[/C][/ROW]
[ROW][C]Time lag k[/C][C]ACF(k)[/C][C]T-STAT[/C][C]P-value[/C][/ROW]
[ROW][C]1[/C][C]0.092487[/C][C]0.7164[/C][C]0.238262[/C][/ROW]
[ROW][C]2[/C][C]0.007187[/C][C]0.0557[/C][C]0.477894[/C][/ROW]
[ROW][C]3[/C][C]0.205596[/C][C]1.5925[/C][C]0.058259[/C][/ROW]
[ROW][C]4[/C][C]0.035765[/C][C]0.277[/C][C]0.391354[/C][/ROW]
[ROW][C]5[/C][C]0.123504[/C][C]0.9567[/C][C]0.17129[/C][/ROW]
[ROW][C]6[/C][C]0.29145[/C][C]2.2576[/C][C]0.013812[/C][/ROW]
[ROW][C]7[/C][C]0.032432[/C][C]0.2512[/C][C]0.401251[/C][/ROW]
[ROW][C]8[/C][C]0.121057[/C][C]0.9377[/C][C]0.176079[/C][/ROW]
[ROW][C]9[/C][C]-0.005625[/C][C]-0.0436[/C][C]0.482695[/C][/ROW]
[ROW][C]10[/C][C]-0.217661[/C][C]-1.686[/C][C]0.048495[/C][/ROW]
[ROW][C]11[/C][C]-0.005637[/C][C]-0.0437[/C][C]0.482657[/C][/ROW]
[ROW][C]12[/C][C]0.276077[/C][C]2.1385[/C][C]0.018279[/C][/ROW]
[ROW][C]13[/C][C]-0.230137[/C][C]-1.7826[/C][C]0.039853[/C][/ROW]
[ROW][C]14[/C][C]-0.054419[/C][C]-0.4215[/C][C]0.337438[/C][/ROW]
[ROW][C]15[/C][C]-0.19358[/C][C]-1.4995[/C][C]0.069498[/C][/ROW]
[ROW][C]16[/C][C]-0.136964[/C][C]-1.0609[/C][C]0.14649[/C][/ROW]
[ROW][C]17[/C][C]0.02075[/C][C]0.1607[/C][C]0.436423[/C][/ROW]
[ROW][C]18[/C][C]-0.053125[/C][C]-0.4115[/C][C]0.341084[/C][/ROW]
[ROW][C]19[/C][C]-0.063679[/C][C]-0.4933[/C][C]0.311817[/C][/ROW]
[ROW][C]20[/C][C]0.013852[/C][C]0.1073[/C][C]0.457455[/C][/ROW]
[ROW][C]21[/C][C]-0.211811[/C][C]-1.6407[/C][C]0.053048[/C][/ROW]
[ROW][C]22[/C][C]-0.145173[/C][C]-1.1245[/C][C]0.132639[/C][/ROW]
[ROW][C]23[/C][C]-0.02099[/C][C]-0.1626[/C][C]0.435694[/C][/ROW]
[ROW][C]24[/C][C]0.091463[/C][C]0.7085[/C][C]0.240698[/C][/ROW]
[ROW][C]25[/C][C]-0.030404[/C][C]-0.2355[/C][C]0.407309[/C][/ROW]
[ROW][C]26[/C][C]-0.017515[/C][C]-0.1357[/C][C]0.446268[/C][/ROW]
[ROW][C]27[/C][C]-0.225072[/C][C]-1.7434[/C][C]0.043193[/C][/ROW]
[ROW][C]28[/C][C]0.020837[/C][C]0.1614[/C][C]0.436159[/C][/ROW]
[ROW][C]29[/C][C]-0.002949[/C][C]-0.0228[/C][C]0.490925[/C][/ROW]
[ROW][C]30[/C][C]-0.033302[/C][C]-0.258[/C][C]0.39866[/C][/ROW]
[ROW][C]31[/C][C]0.09841[/C][C]0.7623[/C][C]0.22444[/C][/ROW]
[ROW][C]32[/C][C]0.022588[/C][C]0.175[/C][C]0.430848[/C][/ROW]
[ROW][C]33[/C][C]-0.134602[/C][C]-1.0426[/C][C]0.150652[/C][/ROW]
[ROW][C]34[/C][C]-0.029298[/C][C]-0.2269[/C][C]0.410621[/C][/ROW]
[ROW][C]35[/C][C]-0.049204[/C][C]-0.3811[/C][C]0.352226[/C][/ROW]
[ROW][C]36[/C][C]0.105998[/C][C]0.8211[/C][C]0.207432[/C][/ROW]
[ROW][C]37[/C][C]0.130128[/C][C]1.008[/C][C]0.15876[/C][/ROW]
[ROW][C]38[/C][C]-0.026926[/C][C]-0.2086[/C][C]0.417746[/C][/ROW]
[ROW][C]39[/C][C]-0.063495[/C][C]-0.4918[/C][C]0.312318[/C][/ROW]
[ROW][C]40[/C][C]0.115853[/C][C]0.8974[/C][C]0.186549[/C][/ROW]
[ROW][C]41[/C][C]-0.099929[/C][C]-0.774[/C][C]0.220971[/C][/ROW]
[ROW][C]42[/C][C]0.046335[/C][C]0.3589[/C][C]0.36046[/C][/ROW]
[ROW][C]43[/C][C]0.131043[/C][C]1.0151[/C][C]0.157077[/C][/ROW]
[ROW][C]44[/C][C]-0.069411[/C][C]-0.5377[/C][C]0.296401[/C][/ROW]
[ROW][C]45[/C][C]-0.020062[/C][C]-0.1554[/C][C]0.438514[/C][/ROW]
[ROW][C]46[/C][C]0.004621[/C][C]0.0358[/C][C]0.485783[/C][/ROW]
[ROW][C]47[/C][C]-0.063775[/C][C]-0.494[/C][C]0.311556[/C][/ROW]
[ROW][C]48[/C][C]0.111548[/C][C]0.864[/C][C]0.195502[/C][/ROW]
[/TABLE]
Source: https://freestatistics.org/blog/index.php?pk=&T=1

Globally Unique Identifier (entire table): ba.freestatistics.org/blog/index.php?pk=&T=1

As an alternative you can also use a QR Code:  

The GUIDs for individual cells are displayed in the table below:

Autocorrelation Function
Time lag kACF(k)T-STATP-value
10.0924870.71640.238262
20.0071870.05570.477894
30.2055961.59250.058259
40.0357650.2770.391354
50.1235040.95670.17129
60.291452.25760.013812
70.0324320.25120.401251
80.1210570.93770.176079
9-0.005625-0.04360.482695
10-0.217661-1.6860.048495
11-0.005637-0.04370.482657
120.2760772.13850.018279
13-0.230137-1.78260.039853
14-0.054419-0.42150.337438
15-0.19358-1.49950.069498
16-0.136964-1.06090.14649
170.020750.16070.436423
18-0.053125-0.41150.341084
19-0.063679-0.49330.311817
200.0138520.10730.457455
21-0.211811-1.64070.053048
22-0.145173-1.12450.132639
23-0.02099-0.16260.435694
240.0914630.70850.240698
25-0.030404-0.23550.407309
26-0.017515-0.13570.446268
27-0.225072-1.74340.043193
280.0208370.16140.436159
29-0.002949-0.02280.490925
30-0.033302-0.2580.39866
310.098410.76230.22444
320.0225880.1750.430848
33-0.134602-1.04260.150652
34-0.029298-0.22690.410621
35-0.049204-0.38110.352226
360.1059980.82110.207432
370.1301281.0080.15876
38-0.026926-0.20860.417746
39-0.063495-0.49180.312318
400.1158530.89740.186549
41-0.099929-0.7740.220971
420.0463350.35890.36046
430.1310431.01510.157077
44-0.069411-0.53770.296401
45-0.020062-0.15540.438514
460.0046210.03580.485783
47-0.063775-0.4940.311556
480.1115480.8640.195502


Partial Autocorrelation Function
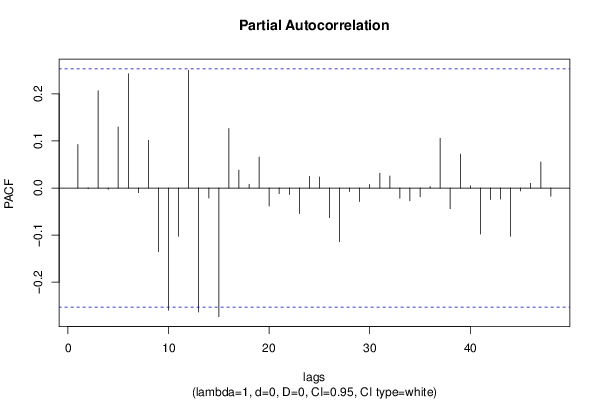
Time lag kPACF(k)T-STATP-value
10.0924870.71640.238262
2-0.001378-0.01070.495759
30.2068281.60210.057195
4-0.002441-0.01890.492489
50.1297461.0050.159464
60.2428151.88080.032425
7-0.009747-0.07550.470035
80.1015360.78650.217337
9-0.135545-1.04990.148981
10-0.259788-2.01230.024341
11-0.102489-0.79390.215199
120.2502951.93880.028618
13-0.263391-2.04020.022869
14-0.021356-0.16540.434584
15-0.273275-2.11680.019217
160.1264920.97980.165559
170.0380650.29480.384564
180.0079070.06130.475681
190.0660340.51150.305441
20-0.038185-0.29580.384211
21-0.011977-0.09280.463196
22-0.013711-0.10620.457886
23-0.053957-0.41790.338738
240.0248560.19250.423987
250.023370.1810.42848
26-0.062851-0.48680.314072
27-0.113984-0.88290.190402
28-0.007574-0.05870.476704
29-0.028467-0.22050.413115
300.0076890.05960.476353
310.0314810.24380.40409
320.0255420.19780.421917
33-0.021714-0.16820.433497
34-0.027212-0.21080.416885
35-0.018556-0.14370.443096
360.0031450.02440.490324
370.1057410.81910.207996
38-0.043745-0.33880.367954
390.072050.55810.289426
400.0046850.03630.485586
41-0.097758-0.75720.225939
42-0.024233-0.18770.425871
43-0.023321-0.18060.428627
44-0.102528-0.79420.215111
45-0.006027-0.04670.481461
460.010170.07880.468736
470.0552850.42820.335006
48-0.017366-0.13450.446722

\begin{tabular}{lllllllll}
\hline
Partial Autocorrelation Function \tabularnewline
Time lag k & PACF(k) & T-STAT & P-value \tabularnewline
1 & 0.092487 & 0.7164 & 0.238262 \tabularnewline
2 & -0.001378 & -0.0107 & 0.495759 \tabularnewline
3 & 0.206828 & 1.6021 & 0.057195 \tabularnewline
4 & -0.002441 & -0.0189 & 0.492489 \tabularnewline
5 & 0.129746 & 1.005 & 0.159464 \tabularnewline
6 & 0.242815 & 1.8808 & 0.032425 \tabularnewline
7 & -0.009747 & -0.0755 & 0.470035 \tabularnewline
8 & 0.101536 & 0.7865 & 0.217337 \tabularnewline
9 & -0.135545 & -1.0499 & 0.148981 \tabularnewline
10 & -0.259788 & -2.0123 & 0.024341 \tabularnewline
11 & -0.102489 & -0.7939 & 0.215199 \tabularnewline
12 & 0.250295 & 1.9388 & 0.028618 \tabularnewline
13 & -0.263391 & -2.0402 & 0.022869 \tabularnewline
14 & -0.021356 & -0.1654 & 0.434584 \tabularnewline
15 & -0.273275 & -2.1168 & 0.019217 \tabularnewline
16 & 0.126492 & 0.9798 & 0.165559 \tabularnewline
17 & 0.038065 & 0.2948 & 0.384564 \tabularnewline
18 & 0.007907 & 0.0613 & 0.475681 \tabularnewline
19 & 0.066034 & 0.5115 & 0.305441 \tabularnewline
20 & -0.038185 & -0.2958 & 0.384211 \tabularnewline
21 & -0.011977 & -0.0928 & 0.463196 \tabularnewline
22 & -0.013711 & -0.1062 & 0.457886 \tabularnewline
23 & -0.053957 & -0.4179 & 0.338738 \tabularnewline
24 & 0.024856 & 0.1925 & 0.423987 \tabularnewline
25 & 0.02337 & 0.181 & 0.42848 \tabularnewline
26 & -0.062851 & -0.4868 & 0.314072 \tabularnewline
27 & -0.113984 & -0.8829 & 0.190402 \tabularnewline
28 & -0.007574 & -0.0587 & 0.476704 \tabularnewline
29 & -0.028467 & -0.2205 & 0.413115 \tabularnewline
30 & 0.007689 & 0.0596 & 0.476353 \tabularnewline
31 & 0.031481 & 0.2438 & 0.40409 \tabularnewline
32 & 0.025542 & 0.1978 & 0.421917 \tabularnewline
33 & -0.021714 & -0.1682 & 0.433497 \tabularnewline
34 & -0.027212 & -0.2108 & 0.416885 \tabularnewline
35 & -0.018556 & -0.1437 & 0.443096 \tabularnewline
36 & 0.003145 & 0.0244 & 0.490324 \tabularnewline
37 & 0.105741 & 0.8191 & 0.207996 \tabularnewline
38 & -0.043745 & -0.3388 & 0.367954 \tabularnewline
39 & 0.07205 & 0.5581 & 0.289426 \tabularnewline
40 & 0.004685 & 0.0363 & 0.485586 \tabularnewline
41 & -0.097758 & -0.7572 & 0.225939 \tabularnewline
42 & -0.024233 & -0.1877 & 0.425871 \tabularnewline
43 & -0.023321 & -0.1806 & 0.428627 \tabularnewline
44 & -0.102528 & -0.7942 & 0.215111 \tabularnewline
45 & -0.006027 & -0.0467 & 0.481461 \tabularnewline
46 & 0.01017 & 0.0788 & 0.468736 \tabularnewline
47 & 0.055285 & 0.4282 & 0.335006 \tabularnewline
48 & -0.017366 & -0.1345 & 0.446722 \tabularnewline
\hline
\end{tabular}
%Source: https://freestatistics.org/blog/index.php?pk=&T=2

[TABLE]
[ROW][C]Partial Autocorrelation Function[/C][/ROW]
[ROW][C]Time lag k[/C][C]PACF(k)[/C][C]T-STAT[/C][C]P-value[/C][/ROW]
[ROW][C]1[/C][C]0.092487[/C][C]0.7164[/C][C]0.238262[/C][/ROW]
[ROW][C]2[/C][C]-0.001378[/C][C]-0.0107[/C][C]0.495759[/C][/ROW]
[ROW][C]3[/C][C]0.206828[/C][C]1.6021[/C][C]0.057195[/C][/ROW]
[ROW][C]4[/C][C]-0.002441[/C][C]-0.0189[/C][C]0.492489[/C][/ROW]
[ROW][C]5[/C][C]0.129746[/C][C]1.005[/C][C]0.159464[/C][/ROW]
[ROW][C]6[/C][C]0.242815[/C][C]1.8808[/C][C]0.032425[/C][/ROW]
[ROW][C]7[/C][C]-0.009747[/C][C]-0.0755[/C][C]0.470035[/C][/ROW]
[ROW][C]8[/C][C]0.101536[/C][C]0.7865[/C][C]0.217337[/C][/ROW]
[ROW][C]9[/C][C]-0.135545[/C][C]-1.0499[/C][C]0.148981[/C][/ROW]
[ROW][C]10[/C][C]-0.259788[/C][C]-2.0123[/C][C]0.024341[/C][/ROW]
[ROW][C]11[/C][C]-0.102489[/C][C]-0.7939[/C][C]0.215199[/C][/ROW]
[ROW][C]12[/C][C]0.250295[/C][C]1.9388[/C][C]0.028618[/C][/ROW]
[ROW][C]13[/C][C]-0.263391[/C][C]-2.0402[/C][C]0.022869[/C][/ROW]
[ROW][C]14[/C][C]-0.021356[/C][C]-0.1654[/C][C]0.434584[/C][/ROW]
[ROW][C]15[/C][C]-0.273275[/C][C]-2.1168[/C][C]0.019217[/C][/ROW]
[ROW][C]16[/C][C]0.126492[/C][C]0.9798[/C][C]0.165559[/C][/ROW]
[ROW][C]17[/C][C]0.038065[/C][C]0.2948[/C][C]0.384564[/C][/ROW]
[ROW][C]18[/C][C]0.007907[/C][C]0.0613[/C][C]0.475681[/C][/ROW]
[ROW][C]19[/C][C]0.066034[/C][C]0.5115[/C][C]0.305441[/C][/ROW]
[ROW][C]20[/C][C]-0.038185[/C][C]-0.2958[/C][C]0.384211[/C][/ROW]
[ROW][C]21[/C][C]-0.011977[/C][C]-0.0928[/C][C]0.463196[/C][/ROW]
[ROW][C]22[/C][C]-0.013711[/C][C]-0.1062[/C][C]0.457886[/C][/ROW]
[ROW][C]23[/C][C]-0.053957[/C][C]-0.4179[/C][C]0.338738[/C][/ROW]
[ROW][C]24[/C][C]0.024856[/C][C]0.1925[/C][C]0.423987[/C][/ROW]
[ROW][C]25[/C][C]0.02337[/C][C]0.181[/C][C]0.42848[/C][/ROW]
[ROW][C]26[/C][C]-0.062851[/C][C]-0.4868[/C][C]0.314072[/C][/ROW]
[ROW][C]27[/C][C]-0.113984[/C][C]-0.8829[/C][C]0.190402[/C][/ROW]
[ROW][C]28[/C][C]-0.007574[/C][C]-0.0587[/C][C]0.476704[/C][/ROW]
[ROW][C]29[/C][C]-0.028467[/C][C]-0.2205[/C][C]0.413115[/C][/ROW]
[ROW][C]30[/C][C]0.007689[/C][C]0.0596[/C][C]0.476353[/C][/ROW]
[ROW][C]31[/C][C]0.031481[/C][C]0.2438[/C][C]0.40409[/C][/ROW]
[ROW][C]32[/C][C]0.025542[/C][C]0.1978[/C][C]0.421917[/C][/ROW]
[ROW][C]33[/C][C]-0.021714[/C][C]-0.1682[/C][C]0.433497[/C][/ROW]
[ROW][C]34[/C][C]-0.027212[/C][C]-0.2108[/C][C]0.416885[/C][/ROW]
[ROW][C]35[/C][C]-0.018556[/C][C]-0.1437[/C][C]0.443096[/C][/ROW]
[ROW][C]36[/C][C]0.003145[/C][C]0.0244[/C][C]0.490324[/C][/ROW]
[ROW][C]37[/C][C]0.105741[/C][C]0.8191[/C][C]0.207996[/C][/ROW]
[ROW][C]38[/C][C]-0.043745[/C][C]-0.3388[/C][C]0.367954[/C][/ROW]
[ROW][C]39[/C][C]0.07205[/C][C]0.5581[/C][C]0.289426[/C][/ROW]
[ROW][C]40[/C][C]0.004685[/C][C]0.0363[/C][C]0.485586[/C][/ROW]
[ROW][C]41[/C][C]-0.097758[/C][C]-0.7572[/C][C]0.225939[/C][/ROW]
[ROW][C]42[/C][C]-0.024233[/C][C]-0.1877[/C][C]0.425871[/C][/ROW]
[ROW][C]43[/C][C]-0.023321[/C][C]-0.1806[/C][C]0.428627[/C][/ROW]
[ROW][C]44[/C][C]-0.102528[/C][C]-0.7942[/C][C]0.215111[/C][/ROW]
[ROW][C]45[/C][C]-0.006027[/C][C]-0.0467[/C][C]0.481461[/C][/ROW]
[ROW][C]46[/C][C]0.01017[/C][C]0.0788[/C][C]0.468736[/C][/ROW]
[ROW][C]47[/C][C]0.055285[/C][C]0.4282[/C][C]0.335006[/C][/ROW]
[ROW][C]48[/C][C]-0.017366[/C][C]-0.1345[/C][C]0.446722[/C][/ROW]
[/TABLE]
Source: https://freestatistics.org/blog/index.php?pk=&T=2

Globally Unique Identifier (entire table): ba.freestatistics.org/blog/index.php?pk=&T=2

As an alternative you can also use a QR Code:  

The GUIDs for individual cells are displayed in the table below:

Partial Autocorrelation Function
Time lag kPACF(k)T-STATP-value
10.0924870.71640.238262
2-0.001378-0.01070.495759
30.2068281.60210.057195
4-0.002441-0.01890.492489
50.1297461.0050.159464
60.2428151.88080.032425
7-0.009747-0.07550.470035
80.1015360.78650.217337
9-0.135545-1.04990.148981
10-0.259788-2.01230.024341
11-0.102489-0.79390.215199
120.2502951.93880.028618
13-0.263391-2.04020.022869
14-0.021356-0.16540.434584
15-0.273275-2.11680.019217
160.1264920.97980.165559
170.0380650.29480.384564
180.0079070.06130.475681
190.0660340.51150.305441
20-0.038185-0.29580.384211
21-0.011977-0.09280.463196
22-0.013711-0.10620.457886
23-0.053957-0.41790.338738
240.0248560.19250.423987
250.023370.1810.42848
26-0.062851-0.48680.314072
27-0.113984-0.88290.190402
28-0.007574-0.05870.476704
29-0.028467-0.22050.413115
300.0076890.05960.476353
310.0314810.24380.40409
320.0255420.19780.421917
33-0.021714-0.16820.433497
34-0.027212-0.21080.416885
35-0.018556-0.14370.443096
360.0031450.02440.490324
370.1057410.81910.207996
38-0.043745-0.33880.367954
390.072050.55810.289426
400.0046850.03630.485586
41-0.097758-0.75720.225939
42-0.024233-0.18770.425871
43-0.023321-0.18060.428627
44-0.102528-0.79420.215111
45-0.006027-0.04670.481461
460.010170.07880.468736
470.0552850.42820.335006
48-0.017366-0.13450.446722


Parameters (Session):
par1 = 48 ; par2 = 1 ; par3 = 0 ; par4 = 0 ; par5 = 12 ; par6 = White Noise ; par7 = 0.95 ;
Parameters (R input):
par1 = 48 ; par2 = 1 ; par3 = 0 ; par4 = 0 ; par5 = 12 ; par6 = White Noise ; par7 = 0.95 ; par8 = ;
R code (references can be found in the software module):
if (par1 == 'Default') {
par1 = 10*log10(length(x))
} else {
par1 <- as.numeric(par1)
}
par2 <- as.numeric(par2)
par3 <- as.numeric(par3)
par4 <- as.numeric(par4)
par5 <- as.numeric(par5)
if (par6 == 'White Noise') par6 <- 'white' else par6 <- 'ma'
par7 <- as.numeric(par7)
if (par8 != '') par8 <- as.numeric(par8)
x <- na.omit(x)
ox <- x
if (par8 == '') {
if (par2 == 0) {
x <- log(x)
} else {
x <- (x ^ par2 - 1) / par2
}
} else {
x <- log(x,base=par8)
}
if (par3 > 0) x <- diff(x,lag=1,difference=par3)
if (par4 > 0) x <- diff(x,lag=par5,difference=par4)
bitmap(file='picts.png')
op <- par(mfrow=c(2,1))
plot(ox,type='l',main='Original Time Series',xlab='time',ylab='value')
if (par8=='') {
mytitle <- paste('Working Time Series (lambda=',par2,', d=',par3,', D=',par4,')',sep='')
mysub <- paste('(lambda=',par2,', d=',par3,', D=',par4,', CI=', par7, ', CI type=',par6,')',sep='')
} else {
mytitle <- paste('Working Time Series (base=',par8,', d=',par3,', D=',par4,')',sep='')
mysub <- paste('(base=',par8,', d=',par3,', D=',par4,', CI=', par7, ', CI type=',par6,')',sep='')
}
plot(x,type='l', main=mytitle,xlab='time',ylab='value')
par(op)
dev.off()
bitmap(file='pic1.png')
racf <- acf(x, par1, main='Autocorrelation', xlab='time lag', ylab='ACF', ci.type=par6, ci=par7, sub=mysub)
dev.off()
bitmap(file='pic2.png')
rpacf <- pacf(x,par1,main='Partial Autocorrelation',xlab='lags',ylab='PACF',sub=mysub)
dev.off()
(myacf <- c(racf$acf))
(mypacf <- c(rpacf$acf))
lengthx <- length(x)
sqrtn <- sqrt(lengthx)
load(file='createtable')
a<-table.start()
a<-table.row.start(a)
a<-table.element(a,'Autocorrelation Function',4,TRUE)
a<-table.row.end(a)
a<-table.row.start(a)
a<-table.element(a,'Time lag k',header=TRUE)
a<-table.element(a,hyperlink('basics.htm','ACF(k)','click here for more information about the Autocorrelation Function'),header=TRUE)
a<-table.element(a,'T-STAT',header=TRUE)
a<-table.element(a,'P-value',header=TRUE)
a<-table.row.end(a)
for (i in 2:(par1+1)) {
a<-table.row.start(a)
a<-table.element(a,i-1,header=TRUE)
a<-table.element(a,round(myacf[i],6))
mytstat <- myacf[i]*sqrtn
a<-table.element(a,round(mytstat,4))
a<-table.element(a,round(1-pt(abs(mytstat),lengthx),6))
a<-table.row.end(a)
}
a<-table.end(a)
table.save(a,file='mytable.tab')
a<-table.start()
a<-table.row.start(a)
a<-table.element(a,'Partial Autocorrelation Function',4,TRUE)
a<-table.row.end(a)
a<-table.row.start(a)
a<-table.element(a,'Time lag k',header=TRUE)
a<-table.element(a,hyperlink('basics.htm','PACF(k)','click here for more information about the Partial Autocorrelation Function'),header=TRUE)
a<-table.element(a,'T-STAT',header=TRUE)
a<-table.element(a,'P-value',header=TRUE)
a<-table.row.end(a)
for (i in 1:par1) {
a<-table.row.start(a)
a<-table.element(a,i,header=TRUE)
a<-table.element(a,round(mypacf[i],6))
mytstat <- mypacf[i]*sqrtn
a<-table.element(a,round(mytstat,4))
a<-table.element(a,round(1-pt(abs(mytstat),lengthx),6))
a<-table.row.end(a)
}
a<-table.end(a)
table.save(a,file='mytable1.tab')