Free Statistics

of Irreproducible Research!

Author's title

Author*Unverified author*
R Software Modulerwasp_autocorrelation.wasp
Title produced by software(Partial) Autocorrelation Function
Date of computationTue, 18 Oct 2016 19:33:01 +0100
Cite this page as followsStatistical Computations at FreeStatistics.org, Office for Research Development and Education, URL https://freestatistics.org/blog/index.php?v=date/2016/Oct/18/t1476815601m750uph0sls2p09.htm/, Retrieved Sun, 28 Apr 2024 05:47:44 +0200
Statistical Computations at FreeStatistics.org, Office for Research Development and Education, URL https://freestatistics.org/blog/index.php?pk=, Retrieved Sun, 28 Apr 2024 05:47:44 +0200
QR Codes:

Original text written by user:
IsPrivate?No (this computation is public)
User-defined keywords
Estimated Impact0
Dataseries X:
28886
28549
33348
29017
30924
30435
29431
30290
31286
30622
31742
30391
30740
32086
33947
31312
33239
32362
32170
32665
31412
34891
33919
30706
32846
31368
33130
31665
33139
32201
32230
30287
31918
33853
32232
31484
31902
30260
32823
32018
32100
31952
33274
29491
32751
33643
31226
30976
28880
29325
34923
32642
31487
33832
32724
29545
32338
32743
32231
32536


Summary of computational transaction
Raw Inputview raw input (R code)
Raw Outputview raw output of R engine
Computing time1 seconds
R Server'Sir Maurice George Kendall' @ kendall.wessa.net

\begin{tabular}{lllllllll}
\hline
Summary of computational transaction \tabularnewline
Raw Input & view raw input (R code)  \tabularnewline
Raw Output & view raw output of R engine  \tabularnewline
Computing time & 1 seconds \tabularnewline
R Server & 'Sir Maurice George Kendall' @ kendall.wessa.net \tabularnewline
\hline
\end{tabular}
%Source: https://freestatistics.org/blog/index.php?pk=&T=0

[TABLE]
[ROW][C]Summary of computational transaction[/C][/ROW]
[ROW][C]Raw Input[/C][C]view raw input (R code) [/C][/ROW]
[ROW][C]Raw Output[/C][C]view raw output of R engine [/C][/ROW]
[ROW][C]Computing time[/C][C]1 seconds[/C][/ROW]
[ROW][C]R Server[/C][C]'Sir Maurice George Kendall' @ kendall.wessa.net[/C][/ROW]
[/TABLE]
Source: https://freestatistics.org/blog/index.php?pk=&T=0

Globally Unique Identifier (entire table): ba.freestatistics.org/blog/index.php?pk=&T=0

As an alternative you can also use a QR Code:  

The GUIDs for individual cells are displayed in the table below:

Summary of computational transaction
Raw Inputview raw input (R code)
Raw Outputview raw output of R engine
Computing time1 seconds
R Server'Sir Maurice George Kendall' @ kendall.wessa.net


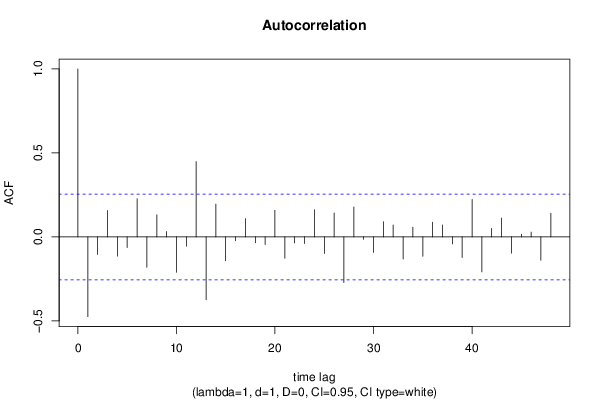
Autocorrelation Function
Time lag kACF(k)T-STATP-value
1-0.474905-3.64780.000281
2-0.104634-0.80370.212396
30.1576671.21110.11535
4-0.114448-0.87910.191458
5-0.063057-0.48430.314967
60.2271451.74470.043119
7-0.181174-1.39160.084631
80.1313171.00870.158627
90.0319070.24510.403621
10-0.210147-1.61420.055913
11-0.054931-0.42190.337304
120.4483133.44360.000531
13-0.374585-2.87720.002788
140.1952361.49960.069521
15-0.142383-1.09370.139273
16-0.022656-0.1740.431221
170.1088510.83610.203236
18-0.034541-0.26530.395847
19-0.044956-0.34530.365544
200.1578731.21260.115049
21-0.12676-0.97370.167101
22-0.035972-0.27630.391639
23-0.039083-0.30020.382539
240.1619541.2440.109211
25-0.098515-0.75670.226118
260.1420811.09130.139779
27-0.27192-2.08870.020531
280.1782691.36930.088046
29-0.014679-0.11280.455304
30-0.092818-0.7130.239344
310.090460.69480.244944
320.0711190.54630.293467
33-0.1315-1.01010.158293
340.0570770.43840.331342
35-0.115275-0.88540.189756
360.086940.66780.253434
370.071340.5480.292888
38-0.041638-0.31980.375114
39-0.122671-0.94230.174953
400.2223331.70780.046468
41-0.208224-1.59940.057537
420.0505160.3880.349699
430.1119160.85960.196733
44-0.096743-0.74310.230185
450.0157150.12070.452167
460.0285070.2190.413716
47-0.138933-1.06720.145123
480.1408511.08190.14185

\begin{tabular}{lllllllll}
\hline
Autocorrelation Function \tabularnewline
Time lag k & ACF(k) & T-STAT & P-value \tabularnewline
1 & -0.474905 & -3.6478 & 0.000281 \tabularnewline
2 & -0.104634 & -0.8037 & 0.212396 \tabularnewline
3 & 0.157667 & 1.2111 & 0.11535 \tabularnewline
4 & -0.114448 & -0.8791 & 0.191458 \tabularnewline
5 & -0.063057 & -0.4843 & 0.314967 \tabularnewline
6 & 0.227145 & 1.7447 & 0.043119 \tabularnewline
7 & -0.181174 & -1.3916 & 0.084631 \tabularnewline
8 & 0.131317 & 1.0087 & 0.158627 \tabularnewline
9 & 0.031907 & 0.2451 & 0.403621 \tabularnewline
10 & -0.210147 & -1.6142 & 0.055913 \tabularnewline
11 & -0.054931 & -0.4219 & 0.337304 \tabularnewline
12 & 0.448313 & 3.4436 & 0.000531 \tabularnewline
13 & -0.374585 & -2.8772 & 0.002788 \tabularnewline
14 & 0.195236 & 1.4996 & 0.069521 \tabularnewline
15 & -0.142383 & -1.0937 & 0.139273 \tabularnewline
16 & -0.022656 & -0.174 & 0.431221 \tabularnewline
17 & 0.108851 & 0.8361 & 0.203236 \tabularnewline
18 & -0.034541 & -0.2653 & 0.395847 \tabularnewline
19 & -0.044956 & -0.3453 & 0.365544 \tabularnewline
20 & 0.157873 & 1.2126 & 0.115049 \tabularnewline
21 & -0.12676 & -0.9737 & 0.167101 \tabularnewline
22 & -0.035972 & -0.2763 & 0.391639 \tabularnewline
23 & -0.039083 & -0.3002 & 0.382539 \tabularnewline
24 & 0.161954 & 1.244 & 0.109211 \tabularnewline
25 & -0.098515 & -0.7567 & 0.226118 \tabularnewline
26 & 0.142081 & 1.0913 & 0.139779 \tabularnewline
27 & -0.27192 & -2.0887 & 0.020531 \tabularnewline
28 & 0.178269 & 1.3693 & 0.088046 \tabularnewline
29 & -0.014679 & -0.1128 & 0.455304 \tabularnewline
30 & -0.092818 & -0.713 & 0.239344 \tabularnewline
31 & 0.09046 & 0.6948 & 0.244944 \tabularnewline
32 & 0.071119 & 0.5463 & 0.293467 \tabularnewline
33 & -0.1315 & -1.0101 & 0.158293 \tabularnewline
34 & 0.057077 & 0.4384 & 0.331342 \tabularnewline
35 & -0.115275 & -0.8854 & 0.189756 \tabularnewline
36 & 0.08694 & 0.6678 & 0.253434 \tabularnewline
37 & 0.07134 & 0.548 & 0.292888 \tabularnewline
38 & -0.041638 & -0.3198 & 0.375114 \tabularnewline
39 & -0.122671 & -0.9423 & 0.174953 \tabularnewline
40 & 0.222333 & 1.7078 & 0.046468 \tabularnewline
41 & -0.208224 & -1.5994 & 0.057537 \tabularnewline
42 & 0.050516 & 0.388 & 0.349699 \tabularnewline
43 & 0.111916 & 0.8596 & 0.196733 \tabularnewline
44 & -0.096743 & -0.7431 & 0.230185 \tabularnewline
45 & 0.015715 & 0.1207 & 0.452167 \tabularnewline
46 & 0.028507 & 0.219 & 0.413716 \tabularnewline
47 & -0.138933 & -1.0672 & 0.145123 \tabularnewline
48 & 0.140851 & 1.0819 & 0.14185 \tabularnewline
\hline
\end{tabular}
%Source: https://freestatistics.org/blog/index.php?pk=&T=1

[TABLE]
[ROW][C]Autocorrelation Function[/C][/ROW]
[ROW][C]Time lag k[/C][C]ACF(k)[/C][C]T-STAT[/C][C]P-value[/C][/ROW]
[ROW][C]1[/C][C]-0.474905[/C][C]-3.6478[/C][C]0.000281[/C][/ROW]
[ROW][C]2[/C][C]-0.104634[/C][C]-0.8037[/C][C]0.212396[/C][/ROW]
[ROW][C]3[/C][C]0.157667[/C][C]1.2111[/C][C]0.11535[/C][/ROW]
[ROW][C]4[/C][C]-0.114448[/C][C]-0.8791[/C][C]0.191458[/C][/ROW]
[ROW][C]5[/C][C]-0.063057[/C][C]-0.4843[/C][C]0.314967[/C][/ROW]
[ROW][C]6[/C][C]0.227145[/C][C]1.7447[/C][C]0.043119[/C][/ROW]
[ROW][C]7[/C][C]-0.181174[/C][C]-1.3916[/C][C]0.084631[/C][/ROW]
[ROW][C]8[/C][C]0.131317[/C][C]1.0087[/C][C]0.158627[/C][/ROW]
[ROW][C]9[/C][C]0.031907[/C][C]0.2451[/C][C]0.403621[/C][/ROW]
[ROW][C]10[/C][C]-0.210147[/C][C]-1.6142[/C][C]0.055913[/C][/ROW]
[ROW][C]11[/C][C]-0.054931[/C][C]-0.4219[/C][C]0.337304[/C][/ROW]
[ROW][C]12[/C][C]0.448313[/C][C]3.4436[/C][C]0.000531[/C][/ROW]
[ROW][C]13[/C][C]-0.374585[/C][C]-2.8772[/C][C]0.002788[/C][/ROW]
[ROW][C]14[/C][C]0.195236[/C][C]1.4996[/C][C]0.069521[/C][/ROW]
[ROW][C]15[/C][C]-0.142383[/C][C]-1.0937[/C][C]0.139273[/C][/ROW]
[ROW][C]16[/C][C]-0.022656[/C][C]-0.174[/C][C]0.431221[/C][/ROW]
[ROW][C]17[/C][C]0.108851[/C][C]0.8361[/C][C]0.203236[/C][/ROW]
[ROW][C]18[/C][C]-0.034541[/C][C]-0.2653[/C][C]0.395847[/C][/ROW]
[ROW][C]19[/C][C]-0.044956[/C][C]-0.3453[/C][C]0.365544[/C][/ROW]
[ROW][C]20[/C][C]0.157873[/C][C]1.2126[/C][C]0.115049[/C][/ROW]
[ROW][C]21[/C][C]-0.12676[/C][C]-0.9737[/C][C]0.167101[/C][/ROW]
[ROW][C]22[/C][C]-0.035972[/C][C]-0.2763[/C][C]0.391639[/C][/ROW]
[ROW][C]23[/C][C]-0.039083[/C][C]-0.3002[/C][C]0.382539[/C][/ROW]
[ROW][C]24[/C][C]0.161954[/C][C]1.244[/C][C]0.109211[/C][/ROW]
[ROW][C]25[/C][C]-0.098515[/C][C]-0.7567[/C][C]0.226118[/C][/ROW]
[ROW][C]26[/C][C]0.142081[/C][C]1.0913[/C][C]0.139779[/C][/ROW]
[ROW][C]27[/C][C]-0.27192[/C][C]-2.0887[/C][C]0.020531[/C][/ROW]
[ROW][C]28[/C][C]0.178269[/C][C]1.3693[/C][C]0.088046[/C][/ROW]
[ROW][C]29[/C][C]-0.014679[/C][C]-0.1128[/C][C]0.455304[/C][/ROW]
[ROW][C]30[/C][C]-0.092818[/C][C]-0.713[/C][C]0.239344[/C][/ROW]
[ROW][C]31[/C][C]0.09046[/C][C]0.6948[/C][C]0.244944[/C][/ROW]
[ROW][C]32[/C][C]0.071119[/C][C]0.5463[/C][C]0.293467[/C][/ROW]
[ROW][C]33[/C][C]-0.1315[/C][C]-1.0101[/C][C]0.158293[/C][/ROW]
[ROW][C]34[/C][C]0.057077[/C][C]0.4384[/C][C]0.331342[/C][/ROW]
[ROW][C]35[/C][C]-0.115275[/C][C]-0.8854[/C][C]0.189756[/C][/ROW]
[ROW][C]36[/C][C]0.08694[/C][C]0.6678[/C][C]0.253434[/C][/ROW]
[ROW][C]37[/C][C]0.07134[/C][C]0.548[/C][C]0.292888[/C][/ROW]
[ROW][C]38[/C][C]-0.041638[/C][C]-0.3198[/C][C]0.375114[/C][/ROW]
[ROW][C]39[/C][C]-0.122671[/C][C]-0.9423[/C][C]0.174953[/C][/ROW]
[ROW][C]40[/C][C]0.222333[/C][C]1.7078[/C][C]0.046468[/C][/ROW]
[ROW][C]41[/C][C]-0.208224[/C][C]-1.5994[/C][C]0.057537[/C][/ROW]
[ROW][C]42[/C][C]0.050516[/C][C]0.388[/C][C]0.349699[/C][/ROW]
[ROW][C]43[/C][C]0.111916[/C][C]0.8596[/C][C]0.196733[/C][/ROW]
[ROW][C]44[/C][C]-0.096743[/C][C]-0.7431[/C][C]0.230185[/C][/ROW]
[ROW][C]45[/C][C]0.015715[/C][C]0.1207[/C][C]0.452167[/C][/ROW]
[ROW][C]46[/C][C]0.028507[/C][C]0.219[/C][C]0.413716[/C][/ROW]
[ROW][C]47[/C][C]-0.138933[/C][C]-1.0672[/C][C]0.145123[/C][/ROW]
[ROW][C]48[/C][C]0.140851[/C][C]1.0819[/C][C]0.14185[/C][/ROW]
[/TABLE]
Source: https://freestatistics.org/blog/index.php?pk=&T=1

Globally Unique Identifier (entire table): ba.freestatistics.org/blog/index.php?pk=&T=1

As an alternative you can also use a QR Code:  

The GUIDs for individual cells are displayed in the table below:

Autocorrelation Function
Time lag kACF(k)T-STATP-value
1-0.474905-3.64780.000281
2-0.104634-0.80370.212396
30.1576671.21110.11535
4-0.114448-0.87910.191458
5-0.063057-0.48430.314967
60.2271451.74470.043119
7-0.181174-1.39160.084631
80.1313171.00870.158627
90.0319070.24510.403621
10-0.210147-1.61420.055913
11-0.054931-0.42190.337304
120.4483133.44360.000531
13-0.374585-2.87720.002788
140.1952361.49960.069521
15-0.142383-1.09370.139273
16-0.022656-0.1740.431221
170.1088510.83610.203236
18-0.034541-0.26530.395847
19-0.044956-0.34530.365544
200.1578731.21260.115049
21-0.12676-0.97370.167101
22-0.035972-0.27630.391639
23-0.039083-0.30020.382539
240.1619541.2440.109211
25-0.098515-0.75670.226118
260.1420811.09130.139779
27-0.27192-2.08870.020531
280.1782691.36930.088046
29-0.014679-0.11280.455304
30-0.092818-0.7130.239344
310.090460.69480.244944
320.0711190.54630.293467
33-0.1315-1.01010.158293
340.0570770.43840.331342
35-0.115275-0.88540.189756
360.086940.66780.253434
370.071340.5480.292888
38-0.041638-0.31980.375114
39-0.122671-0.94230.174953
400.2223331.70780.046468
41-0.208224-1.59940.057537
420.0505160.3880.349699
430.1119160.85960.196733
44-0.096743-0.74310.230185
450.0157150.12070.452167
460.0285070.2190.413716
47-0.138933-1.06720.145123
480.1408511.08190.14185


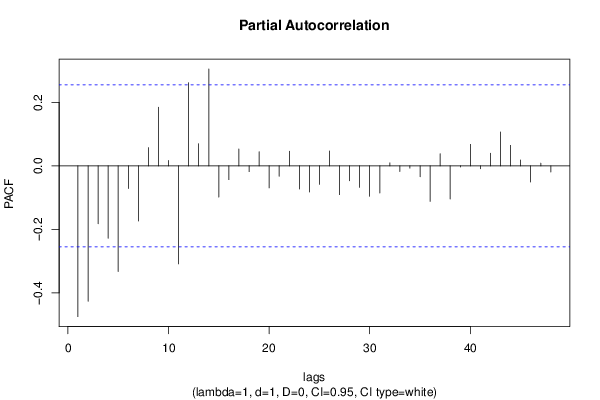
Partial Autocorrelation Function
Time lag kPACF(k)T-STATP-value
1-0.474905-3.64780.000281
2-0.426318-3.27460.000887
3-0.182528-1.4020.083074
4-0.227897-1.75050.042614
5-0.332504-2.5540.006626
6-0.071269-0.54740.293075
7-0.173877-1.33560.093409
80.0575180.44180.330123
90.1844511.41680.080901
100.0171780.13190.447738
11-0.308733-2.37140.010502
120.2620152.01260.024365
130.0695420.53420.297618
140.3052672.34480.011211
15-0.098364-0.75560.226462
16-0.043468-0.33390.369826
170.0532840.40930.341908
18-0.018206-0.13980.444631
190.0442380.33980.367607
20-0.069352-0.53270.298119
21-0.032929-0.25290.400599
220.0460120.35340.362516
23-0.073069-0.56130.288375
24-0.082375-0.63270.264676
25-0.058403-0.44860.327682
260.0470290.36120.359606
27-0.090724-0.69690.244313
28-0.046717-0.35880.360499
29-0.067855-0.52120.302089
30-0.095875-0.73640.232194
31-0.085353-0.65560.257313
320.009550.07340.470885
33-0.017916-0.13760.445508
34-0.007093-0.05450.478368
35-0.034274-0.26330.396632
36-0.111878-0.85930.196813
370.0381640.29310.38522
38-0.104201-0.80040.21335
39-0.003609-0.02770.48899
400.0677330.52030.302413
41-0.009305-0.07150.471631
420.0397750.30550.380524
430.1069770.82170.207276
440.0645480.49580.310937
450.0186590.14330.44326
46-0.050741-0.38980.349062
470.0085770.06590.473848
48-0.019457-0.14950.440853

\begin{tabular}{lllllllll}
\hline
Partial Autocorrelation Function \tabularnewline
Time lag k & PACF(k) & T-STAT & P-value \tabularnewline
1 & -0.474905 & -3.6478 & 0.000281 \tabularnewline
2 & -0.426318 & -3.2746 & 0.000887 \tabularnewline
3 & -0.182528 & -1.402 & 0.083074 \tabularnewline
4 & -0.227897 & -1.7505 & 0.042614 \tabularnewline
5 & -0.332504 & -2.554 & 0.006626 \tabularnewline
6 & -0.071269 & -0.5474 & 0.293075 \tabularnewline
7 & -0.173877 & -1.3356 & 0.093409 \tabularnewline
8 & 0.057518 & 0.4418 & 0.330123 \tabularnewline
9 & 0.184451 & 1.4168 & 0.080901 \tabularnewline
10 & 0.017178 & 0.1319 & 0.447738 \tabularnewline
11 & -0.308733 & -2.3714 & 0.010502 \tabularnewline
12 & 0.262015 & 2.0126 & 0.024365 \tabularnewline
13 & 0.069542 & 0.5342 & 0.297618 \tabularnewline
14 & 0.305267 & 2.3448 & 0.011211 \tabularnewline
15 & -0.098364 & -0.7556 & 0.226462 \tabularnewline
16 & -0.043468 & -0.3339 & 0.369826 \tabularnewline
17 & 0.053284 & 0.4093 & 0.341908 \tabularnewline
18 & -0.018206 & -0.1398 & 0.444631 \tabularnewline
19 & 0.044238 & 0.3398 & 0.367607 \tabularnewline
20 & -0.069352 & -0.5327 & 0.298119 \tabularnewline
21 & -0.032929 & -0.2529 & 0.400599 \tabularnewline
22 & 0.046012 & 0.3534 & 0.362516 \tabularnewline
23 & -0.073069 & -0.5613 & 0.288375 \tabularnewline
24 & -0.082375 & -0.6327 & 0.264676 \tabularnewline
25 & -0.058403 & -0.4486 & 0.327682 \tabularnewline
26 & 0.047029 & 0.3612 & 0.359606 \tabularnewline
27 & -0.090724 & -0.6969 & 0.244313 \tabularnewline
28 & -0.046717 & -0.3588 & 0.360499 \tabularnewline
29 & -0.067855 & -0.5212 & 0.302089 \tabularnewline
30 & -0.095875 & -0.7364 & 0.232194 \tabularnewline
31 & -0.085353 & -0.6556 & 0.257313 \tabularnewline
32 & 0.00955 & 0.0734 & 0.470885 \tabularnewline
33 & -0.017916 & -0.1376 & 0.445508 \tabularnewline
34 & -0.007093 & -0.0545 & 0.478368 \tabularnewline
35 & -0.034274 & -0.2633 & 0.396632 \tabularnewline
36 & -0.111878 & -0.8593 & 0.196813 \tabularnewline
37 & 0.038164 & 0.2931 & 0.38522 \tabularnewline
38 & -0.104201 & -0.8004 & 0.21335 \tabularnewline
39 & -0.003609 & -0.0277 & 0.48899 \tabularnewline
40 & 0.067733 & 0.5203 & 0.302413 \tabularnewline
41 & -0.009305 & -0.0715 & 0.471631 \tabularnewline
42 & 0.039775 & 0.3055 & 0.380524 \tabularnewline
43 & 0.106977 & 0.8217 & 0.207276 \tabularnewline
44 & 0.064548 & 0.4958 & 0.310937 \tabularnewline
45 & 0.018659 & 0.1433 & 0.44326 \tabularnewline
46 & -0.050741 & -0.3898 & 0.349062 \tabularnewline
47 & 0.008577 & 0.0659 & 0.473848 \tabularnewline
48 & -0.019457 & -0.1495 & 0.440853 \tabularnewline
\hline
\end{tabular}
%Source: https://freestatistics.org/blog/index.php?pk=&T=2

[TABLE]
[ROW][C]Partial Autocorrelation Function[/C][/ROW]
[ROW][C]Time lag k[/C][C]PACF(k)[/C][C]T-STAT[/C][C]P-value[/C][/ROW]
[ROW][C]1[/C][C]-0.474905[/C][C]-3.6478[/C][C]0.000281[/C][/ROW]
[ROW][C]2[/C][C]-0.426318[/C][C]-3.2746[/C][C]0.000887[/C][/ROW]
[ROW][C]3[/C][C]-0.182528[/C][C]-1.402[/C][C]0.083074[/C][/ROW]
[ROW][C]4[/C][C]-0.227897[/C][C]-1.7505[/C][C]0.042614[/C][/ROW]
[ROW][C]5[/C][C]-0.332504[/C][C]-2.554[/C][C]0.006626[/C][/ROW]
[ROW][C]6[/C][C]-0.071269[/C][C]-0.5474[/C][C]0.293075[/C][/ROW]
[ROW][C]7[/C][C]-0.173877[/C][C]-1.3356[/C][C]0.093409[/C][/ROW]
[ROW][C]8[/C][C]0.057518[/C][C]0.4418[/C][C]0.330123[/C][/ROW]
[ROW][C]9[/C][C]0.184451[/C][C]1.4168[/C][C]0.080901[/C][/ROW]
[ROW][C]10[/C][C]0.017178[/C][C]0.1319[/C][C]0.447738[/C][/ROW]
[ROW][C]11[/C][C]-0.308733[/C][C]-2.3714[/C][C]0.010502[/C][/ROW]
[ROW][C]12[/C][C]0.262015[/C][C]2.0126[/C][C]0.024365[/C][/ROW]
[ROW][C]13[/C][C]0.069542[/C][C]0.5342[/C][C]0.297618[/C][/ROW]
[ROW][C]14[/C][C]0.305267[/C][C]2.3448[/C][C]0.011211[/C][/ROW]
[ROW][C]15[/C][C]-0.098364[/C][C]-0.7556[/C][C]0.226462[/C][/ROW]
[ROW][C]16[/C][C]-0.043468[/C][C]-0.3339[/C][C]0.369826[/C][/ROW]
[ROW][C]17[/C][C]0.053284[/C][C]0.4093[/C][C]0.341908[/C][/ROW]
[ROW][C]18[/C][C]-0.018206[/C][C]-0.1398[/C][C]0.444631[/C][/ROW]
[ROW][C]19[/C][C]0.044238[/C][C]0.3398[/C][C]0.367607[/C][/ROW]
[ROW][C]20[/C][C]-0.069352[/C][C]-0.5327[/C][C]0.298119[/C][/ROW]
[ROW][C]21[/C][C]-0.032929[/C][C]-0.2529[/C][C]0.400599[/C][/ROW]
[ROW][C]22[/C][C]0.046012[/C][C]0.3534[/C][C]0.362516[/C][/ROW]
[ROW][C]23[/C][C]-0.073069[/C][C]-0.5613[/C][C]0.288375[/C][/ROW]
[ROW][C]24[/C][C]-0.082375[/C][C]-0.6327[/C][C]0.264676[/C][/ROW]
[ROW][C]25[/C][C]-0.058403[/C][C]-0.4486[/C][C]0.327682[/C][/ROW]
[ROW][C]26[/C][C]0.047029[/C][C]0.3612[/C][C]0.359606[/C][/ROW]
[ROW][C]27[/C][C]-0.090724[/C][C]-0.6969[/C][C]0.244313[/C][/ROW]
[ROW][C]28[/C][C]-0.046717[/C][C]-0.3588[/C][C]0.360499[/C][/ROW]
[ROW][C]29[/C][C]-0.067855[/C][C]-0.5212[/C][C]0.302089[/C][/ROW]
[ROW][C]30[/C][C]-0.095875[/C][C]-0.7364[/C][C]0.232194[/C][/ROW]
[ROW][C]31[/C][C]-0.085353[/C][C]-0.6556[/C][C]0.257313[/C][/ROW]
[ROW][C]32[/C][C]0.00955[/C][C]0.0734[/C][C]0.470885[/C][/ROW]
[ROW][C]33[/C][C]-0.017916[/C][C]-0.1376[/C][C]0.445508[/C][/ROW]
[ROW][C]34[/C][C]-0.007093[/C][C]-0.0545[/C][C]0.478368[/C][/ROW]
[ROW][C]35[/C][C]-0.034274[/C][C]-0.2633[/C][C]0.396632[/C][/ROW]
[ROW][C]36[/C][C]-0.111878[/C][C]-0.8593[/C][C]0.196813[/C][/ROW]
[ROW][C]37[/C][C]0.038164[/C][C]0.2931[/C][C]0.38522[/C][/ROW]
[ROW][C]38[/C][C]-0.104201[/C][C]-0.8004[/C][C]0.21335[/C][/ROW]
[ROW][C]39[/C][C]-0.003609[/C][C]-0.0277[/C][C]0.48899[/C][/ROW]
[ROW][C]40[/C][C]0.067733[/C][C]0.5203[/C][C]0.302413[/C][/ROW]
[ROW][C]41[/C][C]-0.009305[/C][C]-0.0715[/C][C]0.471631[/C][/ROW]
[ROW][C]42[/C][C]0.039775[/C][C]0.3055[/C][C]0.380524[/C][/ROW]
[ROW][C]43[/C][C]0.106977[/C][C]0.8217[/C][C]0.207276[/C][/ROW]
[ROW][C]44[/C][C]0.064548[/C][C]0.4958[/C][C]0.310937[/C][/ROW]
[ROW][C]45[/C][C]0.018659[/C][C]0.1433[/C][C]0.44326[/C][/ROW]
[ROW][C]46[/C][C]-0.050741[/C][C]-0.3898[/C][C]0.349062[/C][/ROW]
[ROW][C]47[/C][C]0.008577[/C][C]0.0659[/C][C]0.473848[/C][/ROW]
[ROW][C]48[/C][C]-0.019457[/C][C]-0.1495[/C][C]0.440853[/C][/ROW]
[/TABLE]
Source: https://freestatistics.org/blog/index.php?pk=&T=2

Globally Unique Identifier (entire table): ba.freestatistics.org/blog/index.php?pk=&T=2

As an alternative you can also use a QR Code:  

The GUIDs for individual cells are displayed in the table below:

Partial Autocorrelation Function
Time lag kPACF(k)T-STATP-value
1-0.474905-3.64780.000281
2-0.426318-3.27460.000887
3-0.182528-1.4020.083074
4-0.227897-1.75050.042614
5-0.332504-2.5540.006626
6-0.071269-0.54740.293075
7-0.173877-1.33560.093409
80.0575180.44180.330123
90.1844511.41680.080901
100.0171780.13190.447738
11-0.308733-2.37140.010502
120.2620152.01260.024365
130.0695420.53420.297618
140.3052672.34480.011211
15-0.098364-0.75560.226462
16-0.043468-0.33390.369826
170.0532840.40930.341908
18-0.018206-0.13980.444631
190.0442380.33980.367607
20-0.069352-0.53270.298119
21-0.032929-0.25290.400599
220.0460120.35340.362516
23-0.073069-0.56130.288375
24-0.082375-0.63270.264676
25-0.058403-0.44860.327682
260.0470290.36120.359606
27-0.090724-0.69690.244313
28-0.046717-0.35880.360499
29-0.067855-0.52120.302089
30-0.095875-0.73640.232194
31-0.085353-0.65560.257313
320.009550.07340.470885
33-0.017916-0.13760.445508
34-0.007093-0.05450.478368
35-0.034274-0.26330.396632
36-0.111878-0.85930.196813
370.0381640.29310.38522
38-0.104201-0.80040.21335
39-0.003609-0.02770.48899
400.0677330.52030.302413
41-0.009305-0.07150.471631
420.0397750.30550.380524
430.1069770.82170.207276
440.0645480.49580.310937
450.0186590.14330.44326
46-0.050741-0.38980.349062
470.0085770.06590.473848
48-0.019457-0.14950.440853


Parameters (Session):
par1 = 48 ; par2 = 1 ; par3 = 0 ; par4 = 0 ; par5 = 12 ; par6 = White Noise ; par7 = 0.95 ;
Parameters (R input):
par1 = 48 ; par2 = 1 ; par3 = 1 ; par4 = 0 ; par5 = 12 ; par6 = White Noise ; par7 = 0.95 ; par8 = ;
R code (references can be found in the software module):
if (par1 == 'Default') {
par1 = 10*log10(length(x))
} else {
par1 <- as.numeric(par1)
}
par2 <- as.numeric(par2)
par3 <- as.numeric(par3)
par4 <- as.numeric(par4)
par5 <- as.numeric(par5)
if (par6 == 'White Noise') par6 <- 'white' else par6 <- 'ma'
par7 <- as.numeric(par7)
if (par8 != '') par8 <- as.numeric(par8)
x <- na.omit(x)
ox <- x
if (par8 == '') {
if (par2 == 0) {
x <- log(x)
} else {
x <- (x ^ par2 - 1) / par2
}
} else {
x <- log(x,base=par8)
}
if (par3 > 0) x <- diff(x,lag=1,difference=par3)
if (par4 > 0) x <- diff(x,lag=par5,difference=par4)
bitmap(file='picts.png')
op <- par(mfrow=c(2,1))
plot(ox,type='l',main='Original Time Series',xlab='time',ylab='value')
if (par8=='') {
mytitle <- paste('Working Time Series (lambda=',par2,', d=',par3,', D=',par4,')',sep='')
mysub <- paste('(lambda=',par2,', d=',par3,', D=',par4,', CI=', par7, ', CI type=',par6,')',sep='')
} else {
mytitle <- paste('Working Time Series (base=',par8,', d=',par3,', D=',par4,')',sep='')
mysub <- paste('(base=',par8,', d=',par3,', D=',par4,', CI=', par7, ', CI type=',par6,')',sep='')
}
plot(x,type='l', main=mytitle,xlab='time',ylab='value')
par(op)
dev.off()
bitmap(file='pic1.png')
racf <- acf(x, par1, main='Autocorrelation', xlab='time lag', ylab='ACF', ci.type=par6, ci=par7, sub=mysub)
dev.off()
bitmap(file='pic2.png')
rpacf <- pacf(x,par1,main='Partial Autocorrelation',xlab='lags',ylab='PACF',sub=mysub)
dev.off()
(myacf <- c(racf$acf))
(mypacf <- c(rpacf$acf))
lengthx <- length(x)
sqrtn <- sqrt(lengthx)
load(file='createtable')
a<-table.start()
a<-table.row.start(a)
a<-table.element(a,'Autocorrelation Function',4,TRUE)
a<-table.row.end(a)
a<-table.row.start(a)
a<-table.element(a,'Time lag k',header=TRUE)
a<-table.element(a,hyperlink('basics.htm','ACF(k)','click here for more information about the Autocorrelation Function'),header=TRUE)
a<-table.element(a,'T-STAT',header=TRUE)
a<-table.element(a,'P-value',header=TRUE)
a<-table.row.end(a)
for (i in 2:(par1+1)) {
a<-table.row.start(a)
a<-table.element(a,i-1,header=TRUE)
a<-table.element(a,round(myacf[i],6))
mytstat <- myacf[i]*sqrtn
a<-table.element(a,round(mytstat,4))
a<-table.element(a,round(1-pt(abs(mytstat),lengthx),6))
a<-table.row.end(a)
}
a<-table.end(a)
table.save(a,file='mytable.tab')
a<-table.start()
a<-table.row.start(a)
a<-table.element(a,'Partial Autocorrelation Function',4,TRUE)
a<-table.row.end(a)
a<-table.row.start(a)
a<-table.element(a,'Time lag k',header=TRUE)
a<-table.element(a,hyperlink('basics.htm','PACF(k)','click here for more information about the Partial Autocorrelation Function'),header=TRUE)
a<-table.element(a,'T-STAT',header=TRUE)
a<-table.element(a,'P-value',header=TRUE)
a<-table.row.end(a)
for (i in 1:par1) {
a<-table.row.start(a)
a<-table.element(a,i,header=TRUE)
a<-table.element(a,round(mypacf[i],6))
mytstat <- mypacf[i]*sqrtn
a<-table.element(a,round(mytstat,4))
a<-table.element(a,round(1-pt(abs(mytstat),lengthx),6))
a<-table.row.end(a)
}
a<-table.end(a)
table.save(a,file='mytable1.tab')