Free Statistics

of Irreproducible Research!

Author's title

Author*Unverified author*
R Software Modulerwasp_autocorrelation.wasp
Title produced by software(Partial) Autocorrelation Function
Date of computationTue, 18 Oct 2016 19:58:59 +0100
Cite this page as followsStatistical Computations at FreeStatistics.org, Office for Research Development and Education, URL https://freestatistics.org/blog/index.php?v=date/2016/Oct/18/t1476817272rksbc1qdavb89ik.htm/, Retrieved Sun, 28 Apr 2024 18:30:22 +0200
Statistical Computations at FreeStatistics.org, Office for Research Development and Education, URL https://freestatistics.org/blog/index.php?pk=, Retrieved Sun, 28 Apr 2024 18:30:22 +0200
QR Codes:

Original text written by user:
IsPrivate?No (this computation is public)
User-defined keywords
Estimated Impact0
Dataseries X:
11000
13000
15000
29000
31000
22000
36000
39000
30000
20000
18000
13000
11000
16000
20000
29000
31000
24000
40000
41000
25000
19000
19000
18000
10000
17000
25000
30000
32000
24000
38000
36000
26000
25000
26000
16000
12000
15000
21000
33000
32000
24000
41000
38000
28000
24000
30000
18000


Summary of computational transaction
Raw Inputview raw input (R code)
Raw Outputview raw output of R engine
Computing time1 seconds
R Server'Sir Ronald Aylmer Fisher' @ fisher.wessa.net

\begin{tabular}{lllllllll}
\hline
Summary of computational transaction \tabularnewline
Raw Input & view raw input (R code)  \tabularnewline
Raw Output & view raw output of R engine  \tabularnewline
Computing time & 1 seconds \tabularnewline
R Server & 'Sir Ronald Aylmer Fisher' @ fisher.wessa.net \tabularnewline
\hline
\end{tabular}
%Source: https://freestatistics.org/blog/index.php?pk=&T=0

[TABLE]
[ROW][C]Summary of computational transaction[/C][/ROW]
[ROW][C]Raw Input[/C][C]view raw input (R code) [/C][/ROW]
[ROW][C]Raw Output[/C][C]view raw output of R engine [/C][/ROW]
[ROW][C]Computing time[/C][C]1 seconds[/C][/ROW]
[ROW][C]R Server[/C][C]'Sir Ronald Aylmer Fisher' @ fisher.wessa.net[/C][/ROW]
[/TABLE]
Source: https://freestatistics.org/blog/index.php?pk=&T=0

Globally Unique Identifier (entire table): ba.freestatistics.org/blog/index.php?pk=&T=0

As an alternative you can also use a QR Code:  

The GUIDs for individual cells are displayed in the table below:

Summary of computational transaction
Raw Inputview raw input (R code)
Raw Outputview raw output of R engine
Computing time1 seconds
R Server'Sir Ronald Aylmer Fisher' @ fisher.wessa.net


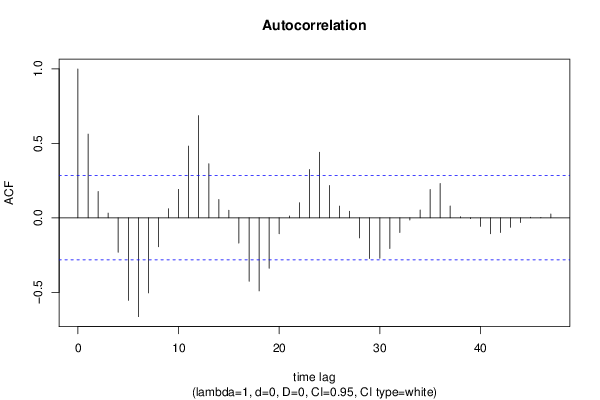
Autocorrelation Function
Time lag kACF(k)T-STATP-value
10.5621523.89470.000152
20.1768471.22520.113233
30.0315510.21860.413946
4-0.230745-1.59860.058231
5-0.554562-3.84210.000179
6-0.663669-4.5981.6e-05
7-0.503865-3.49090.000522
8-0.194679-1.34880.091869
90.0611110.42340.336951
100.1912971.32530.095665
110.4819453.3390.000816
120.6864214.75579e-06
130.3636622.51950.007567
140.1228920.85140.199382
150.0513060.35550.361902
16-0.169645-1.17530.122828
17-0.426172-2.95260.002433
18-0.490707-3.39970.000683
19-0.338756-2.3470.01155
20-0.106694-0.73920.231693
210.011850.08210.467454
220.1011870.7010.243331
230.3244922.24810.014598
240.4405953.05250.001847
250.2169291.50290.069704
260.0786160.54470.294253
270.0447720.31020.378879
28-0.134664-0.9330.17775
29-0.272961-1.89110.032325
30-0.271775-1.88290.03289
31-0.205484-1.42360.080511
32-0.098479-0.68230.24917
33-0.014076-0.09750.46136
340.0522670.36210.359426
350.190051.31670.097095
360.2308211.59920.058172
370.0791410.54830.293011
380.0078970.05470.478297
39-0.005581-0.03870.484659
40-0.057331-0.39720.34649
41-0.107032-0.74150.230989
42-0.099087-0.68650.247852
43-0.063437-0.43950.331135
44-0.031098-0.21550.415164
450.0045870.03180.487391
460.0024090.01670.493376
470.0257010.17810.429713
48NANANA

\begin{tabular}{lllllllll}
\hline
Autocorrelation Function \tabularnewline
Time lag k & ACF(k) & T-STAT & P-value \tabularnewline
1 & 0.562152 & 3.8947 & 0.000152 \tabularnewline
2 & 0.176847 & 1.2252 & 0.113233 \tabularnewline
3 & 0.031551 & 0.2186 & 0.413946 \tabularnewline
4 & -0.230745 & -1.5986 & 0.058231 \tabularnewline
5 & -0.554562 & -3.8421 & 0.000179 \tabularnewline
6 & -0.663669 & -4.598 & 1.6e-05 \tabularnewline
7 & -0.503865 & -3.4909 & 0.000522 \tabularnewline
8 & -0.194679 & -1.3488 & 0.091869 \tabularnewline
9 & 0.061111 & 0.4234 & 0.336951 \tabularnewline
10 & 0.191297 & 1.3253 & 0.095665 \tabularnewline
11 & 0.481945 & 3.339 & 0.000816 \tabularnewline
12 & 0.686421 & 4.7557 & 9e-06 \tabularnewline
13 & 0.363662 & 2.5195 & 0.007567 \tabularnewline
14 & 0.122892 & 0.8514 & 0.199382 \tabularnewline
15 & 0.051306 & 0.3555 & 0.361902 \tabularnewline
16 & -0.169645 & -1.1753 & 0.122828 \tabularnewline
17 & -0.426172 & -2.9526 & 0.002433 \tabularnewline
18 & -0.490707 & -3.3997 & 0.000683 \tabularnewline
19 & -0.338756 & -2.347 & 0.01155 \tabularnewline
20 & -0.106694 & -0.7392 & 0.231693 \tabularnewline
21 & 0.01185 & 0.0821 & 0.467454 \tabularnewline
22 & 0.101187 & 0.701 & 0.243331 \tabularnewline
23 & 0.324492 & 2.2481 & 0.014598 \tabularnewline
24 & 0.440595 & 3.0525 & 0.001847 \tabularnewline
25 & 0.216929 & 1.5029 & 0.069704 \tabularnewline
26 & 0.078616 & 0.5447 & 0.294253 \tabularnewline
27 & 0.044772 & 0.3102 & 0.378879 \tabularnewline
28 & -0.134664 & -0.933 & 0.17775 \tabularnewline
29 & -0.272961 & -1.8911 & 0.032325 \tabularnewline
30 & -0.271775 & -1.8829 & 0.03289 \tabularnewline
31 & -0.205484 & -1.4236 & 0.080511 \tabularnewline
32 & -0.098479 & -0.6823 & 0.24917 \tabularnewline
33 & -0.014076 & -0.0975 & 0.46136 \tabularnewline
34 & 0.052267 & 0.3621 & 0.359426 \tabularnewline
35 & 0.19005 & 1.3167 & 0.097095 \tabularnewline
36 & 0.230821 & 1.5992 & 0.058172 \tabularnewline
37 & 0.079141 & 0.5483 & 0.293011 \tabularnewline
38 & 0.007897 & 0.0547 & 0.478297 \tabularnewline
39 & -0.005581 & -0.0387 & 0.484659 \tabularnewline
40 & -0.057331 & -0.3972 & 0.34649 \tabularnewline
41 & -0.107032 & -0.7415 & 0.230989 \tabularnewline
42 & -0.099087 & -0.6865 & 0.247852 \tabularnewline
43 & -0.063437 & -0.4395 & 0.331135 \tabularnewline
44 & -0.031098 & -0.2155 & 0.415164 \tabularnewline
45 & 0.004587 & 0.0318 & 0.487391 \tabularnewline
46 & 0.002409 & 0.0167 & 0.493376 \tabularnewline
47 & 0.025701 & 0.1781 & 0.429713 \tabularnewline
48 & NA & NA & NA \tabularnewline
\hline
\end{tabular}
%Source: https://freestatistics.org/blog/index.php?pk=&T=1

[TABLE]
[ROW][C]Autocorrelation Function[/C][/ROW]
[ROW][C]Time lag k[/C][C]ACF(k)[/C][C]T-STAT[/C][C]P-value[/C][/ROW]
[ROW][C]1[/C][C]0.562152[/C][C]3.8947[/C][C]0.000152[/C][/ROW]
[ROW][C]2[/C][C]0.176847[/C][C]1.2252[/C][C]0.113233[/C][/ROW]
[ROW][C]3[/C][C]0.031551[/C][C]0.2186[/C][C]0.413946[/C][/ROW]
[ROW][C]4[/C][C]-0.230745[/C][C]-1.5986[/C][C]0.058231[/C][/ROW]
[ROW][C]5[/C][C]-0.554562[/C][C]-3.8421[/C][C]0.000179[/C][/ROW]
[ROW][C]6[/C][C]-0.663669[/C][C]-4.598[/C][C]1.6e-05[/C][/ROW]
[ROW][C]7[/C][C]-0.503865[/C][C]-3.4909[/C][C]0.000522[/C][/ROW]
[ROW][C]8[/C][C]-0.194679[/C][C]-1.3488[/C][C]0.091869[/C][/ROW]
[ROW][C]9[/C][C]0.061111[/C][C]0.4234[/C][C]0.336951[/C][/ROW]
[ROW][C]10[/C][C]0.191297[/C][C]1.3253[/C][C]0.095665[/C][/ROW]
[ROW][C]11[/C][C]0.481945[/C][C]3.339[/C][C]0.000816[/C][/ROW]
[ROW][C]12[/C][C]0.686421[/C][C]4.7557[/C][C]9e-06[/C][/ROW]
[ROW][C]13[/C][C]0.363662[/C][C]2.5195[/C][C]0.007567[/C][/ROW]
[ROW][C]14[/C][C]0.122892[/C][C]0.8514[/C][C]0.199382[/C][/ROW]
[ROW][C]15[/C][C]0.051306[/C][C]0.3555[/C][C]0.361902[/C][/ROW]
[ROW][C]16[/C][C]-0.169645[/C][C]-1.1753[/C][C]0.122828[/C][/ROW]
[ROW][C]17[/C][C]-0.426172[/C][C]-2.9526[/C][C]0.002433[/C][/ROW]
[ROW][C]18[/C][C]-0.490707[/C][C]-3.3997[/C][C]0.000683[/C][/ROW]
[ROW][C]19[/C][C]-0.338756[/C][C]-2.347[/C][C]0.01155[/C][/ROW]
[ROW][C]20[/C][C]-0.106694[/C][C]-0.7392[/C][C]0.231693[/C][/ROW]
[ROW][C]21[/C][C]0.01185[/C][C]0.0821[/C][C]0.467454[/C][/ROW]
[ROW][C]22[/C][C]0.101187[/C][C]0.701[/C][C]0.243331[/C][/ROW]
[ROW][C]23[/C][C]0.324492[/C][C]2.2481[/C][C]0.014598[/C][/ROW]
[ROW][C]24[/C][C]0.440595[/C][C]3.0525[/C][C]0.001847[/C][/ROW]
[ROW][C]25[/C][C]0.216929[/C][C]1.5029[/C][C]0.069704[/C][/ROW]
[ROW][C]26[/C][C]0.078616[/C][C]0.5447[/C][C]0.294253[/C][/ROW]
[ROW][C]27[/C][C]0.044772[/C][C]0.3102[/C][C]0.378879[/C][/ROW]
[ROW][C]28[/C][C]-0.134664[/C][C]-0.933[/C][C]0.17775[/C][/ROW]
[ROW][C]29[/C][C]-0.272961[/C][C]-1.8911[/C][C]0.032325[/C][/ROW]
[ROW][C]30[/C][C]-0.271775[/C][C]-1.8829[/C][C]0.03289[/C][/ROW]
[ROW][C]31[/C][C]-0.205484[/C][C]-1.4236[/C][C]0.080511[/C][/ROW]
[ROW][C]32[/C][C]-0.098479[/C][C]-0.6823[/C][C]0.24917[/C][/ROW]
[ROW][C]33[/C][C]-0.014076[/C][C]-0.0975[/C][C]0.46136[/C][/ROW]
[ROW][C]34[/C][C]0.052267[/C][C]0.3621[/C][C]0.359426[/C][/ROW]
[ROW][C]35[/C][C]0.19005[/C][C]1.3167[/C][C]0.097095[/C][/ROW]
[ROW][C]36[/C][C]0.230821[/C][C]1.5992[/C][C]0.058172[/C][/ROW]
[ROW][C]37[/C][C]0.079141[/C][C]0.5483[/C][C]0.293011[/C][/ROW]
[ROW][C]38[/C][C]0.007897[/C][C]0.0547[/C][C]0.478297[/C][/ROW]
[ROW][C]39[/C][C]-0.005581[/C][C]-0.0387[/C][C]0.484659[/C][/ROW]
[ROW][C]40[/C][C]-0.057331[/C][C]-0.3972[/C][C]0.34649[/C][/ROW]
[ROW][C]41[/C][C]-0.107032[/C][C]-0.7415[/C][C]0.230989[/C][/ROW]
[ROW][C]42[/C][C]-0.099087[/C][C]-0.6865[/C][C]0.247852[/C][/ROW]
[ROW][C]43[/C][C]-0.063437[/C][C]-0.4395[/C][C]0.331135[/C][/ROW]
[ROW][C]44[/C][C]-0.031098[/C][C]-0.2155[/C][C]0.415164[/C][/ROW]
[ROW][C]45[/C][C]0.004587[/C][C]0.0318[/C][C]0.487391[/C][/ROW]
[ROW][C]46[/C][C]0.002409[/C][C]0.0167[/C][C]0.493376[/C][/ROW]
[ROW][C]47[/C][C]0.025701[/C][C]0.1781[/C][C]0.429713[/C][/ROW]
[ROW][C]48[/C][C]NA[/C][C]NA[/C][C]NA[/C][/ROW]
[/TABLE]
Source: https://freestatistics.org/blog/index.php?pk=&T=1

Globally Unique Identifier (entire table): ba.freestatistics.org/blog/index.php?pk=&T=1

As an alternative you can also use a QR Code:  

The GUIDs for individual cells are displayed in the table below:

Autocorrelation Function
Time lag kACF(k)T-STATP-value
10.5621523.89470.000152
20.1768471.22520.113233
30.0315510.21860.413946
4-0.230745-1.59860.058231
5-0.554562-3.84210.000179
6-0.663669-4.5981.6e-05
7-0.503865-3.49090.000522
8-0.194679-1.34880.091869
90.0611110.42340.336951
100.1912971.32530.095665
110.4819453.3390.000816
120.6864214.75579e-06
130.3636622.51950.007567
140.1228920.85140.199382
150.0513060.35550.361902
16-0.169645-1.17530.122828
17-0.426172-2.95260.002433
18-0.490707-3.39970.000683
19-0.338756-2.3470.01155
20-0.106694-0.73920.231693
210.011850.08210.467454
220.1011870.7010.243331
230.3244922.24810.014598
240.4405953.05250.001847
250.2169291.50290.069704
260.0786160.54470.294253
270.0447720.31020.378879
28-0.134664-0.9330.17775
29-0.272961-1.89110.032325
30-0.271775-1.88290.03289
31-0.205484-1.42360.080511
32-0.098479-0.68230.24917
33-0.014076-0.09750.46136
340.0522670.36210.359426
350.190051.31670.097095
360.2308211.59920.058172
370.0791410.54830.293011
380.0078970.05470.478297
39-0.005581-0.03870.484659
40-0.057331-0.39720.34649
41-0.107032-0.74150.230989
42-0.099087-0.68650.247852
43-0.063437-0.43950.331135
44-0.031098-0.21550.415164
450.0045870.03180.487391
460.0024090.01670.493376
470.0257010.17810.429713
48NANANA


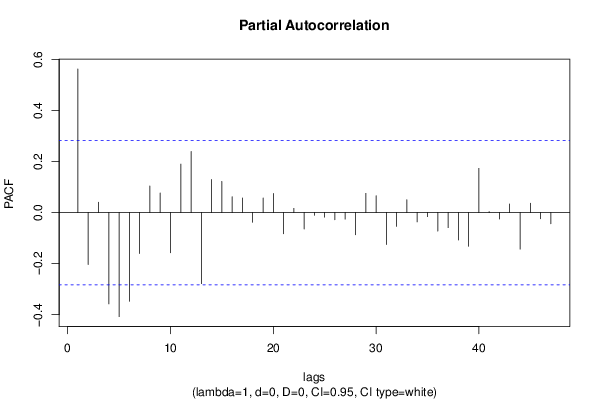
Partial Autocorrelation Function
Time lag kPACF(k)T-STATP-value
10.5621523.89470.000152
2-0.203467-1.40970.082544
30.0400930.27780.391189
4-0.357625-2.47770.008397
5-0.407681-2.82450.003439
6-0.347129-2.4050.010039
7-0.160437-1.11150.135936
80.1041340.72150.237062
90.0764050.52930.299501
10-0.157531-1.09140.140271
110.1896861.31420.097516
120.2388711.65490.05223
13-0.278496-1.92950.029797
140.1294410.89680.187152
150.1218580.84430.201358
160.0619780.42940.334777
170.0569810.39480.347378
18-0.037856-0.26230.397115
190.0567520.39320.347961
200.0747910.51820.303362
21-0.083241-0.57670.283415
220.0163230.11310.455215
23-0.064631-0.44780.328165
24-0.010677-0.0740.470671
25-0.017955-0.12440.450762
26-0.028072-0.19450.423306
27-0.02589-0.17940.429201
28-0.086891-0.6020.275005
290.0750640.52010.302708
300.0658030.45590.325261
31-0.125324-0.86830.194783
32-0.054105-0.37480.354712
330.0498710.34550.365608
34-0.036673-0.25410.40026
35-0.016216-0.11230.455508
36-0.072709-0.50370.308373
37-0.059211-0.41020.341732
38-0.107605-0.74550.2298
39-0.13181-0.91320.18285
400.1728111.19730.11854
410.0035470.02460.490249
42-0.025386-0.17590.430564
430.0337440.23380.408072
44-0.143462-0.99390.162619
450.0362980.25150.401259
46-0.024274-0.16820.433576
47-0.04387-0.30390.381244
48NANANA

\begin{tabular}{lllllllll}
\hline
Partial Autocorrelation Function \tabularnewline
Time lag k & PACF(k) & T-STAT & P-value \tabularnewline
1 & 0.562152 & 3.8947 & 0.000152 \tabularnewline
2 & -0.203467 & -1.4097 & 0.082544 \tabularnewline
3 & 0.040093 & 0.2778 & 0.391189 \tabularnewline
4 & -0.357625 & -2.4777 & 0.008397 \tabularnewline
5 & -0.407681 & -2.8245 & 0.003439 \tabularnewline
6 & -0.347129 & -2.405 & 0.010039 \tabularnewline
7 & -0.160437 & -1.1115 & 0.135936 \tabularnewline
8 & 0.104134 & 0.7215 & 0.237062 \tabularnewline
9 & 0.076405 & 0.5293 & 0.299501 \tabularnewline
10 & -0.157531 & -1.0914 & 0.140271 \tabularnewline
11 & 0.189686 & 1.3142 & 0.097516 \tabularnewline
12 & 0.238871 & 1.6549 & 0.05223 \tabularnewline
13 & -0.278496 & -1.9295 & 0.029797 \tabularnewline
14 & 0.129441 & 0.8968 & 0.187152 \tabularnewline
15 & 0.121858 & 0.8443 & 0.201358 \tabularnewline
16 & 0.061978 & 0.4294 & 0.334777 \tabularnewline
17 & 0.056981 & 0.3948 & 0.347378 \tabularnewline
18 & -0.037856 & -0.2623 & 0.397115 \tabularnewline
19 & 0.056752 & 0.3932 & 0.347961 \tabularnewline
20 & 0.074791 & 0.5182 & 0.303362 \tabularnewline
21 & -0.083241 & -0.5767 & 0.283415 \tabularnewline
22 & 0.016323 & 0.1131 & 0.455215 \tabularnewline
23 & -0.064631 & -0.4478 & 0.328165 \tabularnewline
24 & -0.010677 & -0.074 & 0.470671 \tabularnewline
25 & -0.017955 & -0.1244 & 0.450762 \tabularnewline
26 & -0.028072 & -0.1945 & 0.423306 \tabularnewline
27 & -0.02589 & -0.1794 & 0.429201 \tabularnewline
28 & -0.086891 & -0.602 & 0.275005 \tabularnewline
29 & 0.075064 & 0.5201 & 0.302708 \tabularnewline
30 & 0.065803 & 0.4559 & 0.325261 \tabularnewline
31 & -0.125324 & -0.8683 & 0.194783 \tabularnewline
32 & -0.054105 & -0.3748 & 0.354712 \tabularnewline
33 & 0.049871 & 0.3455 & 0.365608 \tabularnewline
34 & -0.036673 & -0.2541 & 0.40026 \tabularnewline
35 & -0.016216 & -0.1123 & 0.455508 \tabularnewline
36 & -0.072709 & -0.5037 & 0.308373 \tabularnewline
37 & -0.059211 & -0.4102 & 0.341732 \tabularnewline
38 & -0.107605 & -0.7455 & 0.2298 \tabularnewline
39 & -0.13181 & -0.9132 & 0.18285 \tabularnewline
40 & 0.172811 & 1.1973 & 0.11854 \tabularnewline
41 & 0.003547 & 0.0246 & 0.490249 \tabularnewline
42 & -0.025386 & -0.1759 & 0.430564 \tabularnewline
43 & 0.033744 & 0.2338 & 0.408072 \tabularnewline
44 & -0.143462 & -0.9939 & 0.162619 \tabularnewline
45 & 0.036298 & 0.2515 & 0.401259 \tabularnewline
46 & -0.024274 & -0.1682 & 0.433576 \tabularnewline
47 & -0.04387 & -0.3039 & 0.381244 \tabularnewline
48 & NA & NA & NA \tabularnewline
\hline
\end{tabular}
%Source: https://freestatistics.org/blog/index.php?pk=&T=2

[TABLE]
[ROW][C]Partial Autocorrelation Function[/C][/ROW]
[ROW][C]Time lag k[/C][C]PACF(k)[/C][C]T-STAT[/C][C]P-value[/C][/ROW]
[ROW][C]1[/C][C]0.562152[/C][C]3.8947[/C][C]0.000152[/C][/ROW]
[ROW][C]2[/C][C]-0.203467[/C][C]-1.4097[/C][C]0.082544[/C][/ROW]
[ROW][C]3[/C][C]0.040093[/C][C]0.2778[/C][C]0.391189[/C][/ROW]
[ROW][C]4[/C][C]-0.357625[/C][C]-2.4777[/C][C]0.008397[/C][/ROW]
[ROW][C]5[/C][C]-0.407681[/C][C]-2.8245[/C][C]0.003439[/C][/ROW]
[ROW][C]6[/C][C]-0.347129[/C][C]-2.405[/C][C]0.010039[/C][/ROW]
[ROW][C]7[/C][C]-0.160437[/C][C]-1.1115[/C][C]0.135936[/C][/ROW]
[ROW][C]8[/C][C]0.104134[/C][C]0.7215[/C][C]0.237062[/C][/ROW]
[ROW][C]9[/C][C]0.076405[/C][C]0.5293[/C][C]0.299501[/C][/ROW]
[ROW][C]10[/C][C]-0.157531[/C][C]-1.0914[/C][C]0.140271[/C][/ROW]
[ROW][C]11[/C][C]0.189686[/C][C]1.3142[/C][C]0.097516[/C][/ROW]
[ROW][C]12[/C][C]0.238871[/C][C]1.6549[/C][C]0.05223[/C][/ROW]
[ROW][C]13[/C][C]-0.278496[/C][C]-1.9295[/C][C]0.029797[/C][/ROW]
[ROW][C]14[/C][C]0.129441[/C][C]0.8968[/C][C]0.187152[/C][/ROW]
[ROW][C]15[/C][C]0.121858[/C][C]0.8443[/C][C]0.201358[/C][/ROW]
[ROW][C]16[/C][C]0.061978[/C][C]0.4294[/C][C]0.334777[/C][/ROW]
[ROW][C]17[/C][C]0.056981[/C][C]0.3948[/C][C]0.347378[/C][/ROW]
[ROW][C]18[/C][C]-0.037856[/C][C]-0.2623[/C][C]0.397115[/C][/ROW]
[ROW][C]19[/C][C]0.056752[/C][C]0.3932[/C][C]0.347961[/C][/ROW]
[ROW][C]20[/C][C]0.074791[/C][C]0.5182[/C][C]0.303362[/C][/ROW]
[ROW][C]21[/C][C]-0.083241[/C][C]-0.5767[/C][C]0.283415[/C][/ROW]
[ROW][C]22[/C][C]0.016323[/C][C]0.1131[/C][C]0.455215[/C][/ROW]
[ROW][C]23[/C][C]-0.064631[/C][C]-0.4478[/C][C]0.328165[/C][/ROW]
[ROW][C]24[/C][C]-0.010677[/C][C]-0.074[/C][C]0.470671[/C][/ROW]
[ROW][C]25[/C][C]-0.017955[/C][C]-0.1244[/C][C]0.450762[/C][/ROW]
[ROW][C]26[/C][C]-0.028072[/C][C]-0.1945[/C][C]0.423306[/C][/ROW]
[ROW][C]27[/C][C]-0.02589[/C][C]-0.1794[/C][C]0.429201[/C][/ROW]
[ROW][C]28[/C][C]-0.086891[/C][C]-0.602[/C][C]0.275005[/C][/ROW]
[ROW][C]29[/C][C]0.075064[/C][C]0.5201[/C][C]0.302708[/C][/ROW]
[ROW][C]30[/C][C]0.065803[/C][C]0.4559[/C][C]0.325261[/C][/ROW]
[ROW][C]31[/C][C]-0.125324[/C][C]-0.8683[/C][C]0.194783[/C][/ROW]
[ROW][C]32[/C][C]-0.054105[/C][C]-0.3748[/C][C]0.354712[/C][/ROW]
[ROW][C]33[/C][C]0.049871[/C][C]0.3455[/C][C]0.365608[/C][/ROW]
[ROW][C]34[/C][C]-0.036673[/C][C]-0.2541[/C][C]0.40026[/C][/ROW]
[ROW][C]35[/C][C]-0.016216[/C][C]-0.1123[/C][C]0.455508[/C][/ROW]
[ROW][C]36[/C][C]-0.072709[/C][C]-0.5037[/C][C]0.308373[/C][/ROW]
[ROW][C]37[/C][C]-0.059211[/C][C]-0.4102[/C][C]0.341732[/C][/ROW]
[ROW][C]38[/C][C]-0.107605[/C][C]-0.7455[/C][C]0.2298[/C][/ROW]
[ROW][C]39[/C][C]-0.13181[/C][C]-0.9132[/C][C]0.18285[/C][/ROW]
[ROW][C]40[/C][C]0.172811[/C][C]1.1973[/C][C]0.11854[/C][/ROW]
[ROW][C]41[/C][C]0.003547[/C][C]0.0246[/C][C]0.490249[/C][/ROW]
[ROW][C]42[/C][C]-0.025386[/C][C]-0.1759[/C][C]0.430564[/C][/ROW]
[ROW][C]43[/C][C]0.033744[/C][C]0.2338[/C][C]0.408072[/C][/ROW]
[ROW][C]44[/C][C]-0.143462[/C][C]-0.9939[/C][C]0.162619[/C][/ROW]
[ROW][C]45[/C][C]0.036298[/C][C]0.2515[/C][C]0.401259[/C][/ROW]
[ROW][C]46[/C][C]-0.024274[/C][C]-0.1682[/C][C]0.433576[/C][/ROW]
[ROW][C]47[/C][C]-0.04387[/C][C]-0.3039[/C][C]0.381244[/C][/ROW]
[ROW][C]48[/C][C]NA[/C][C]NA[/C][C]NA[/C][/ROW]
[/TABLE]
Source: https://freestatistics.org/blog/index.php?pk=&T=2

Globally Unique Identifier (entire table): ba.freestatistics.org/blog/index.php?pk=&T=2

As an alternative you can also use a QR Code:  

The GUIDs for individual cells are displayed in the table below:

Partial Autocorrelation Function
Time lag kPACF(k)T-STATP-value
10.5621523.89470.000152
2-0.203467-1.40970.082544
30.0400930.27780.391189
4-0.357625-2.47770.008397
5-0.407681-2.82450.003439
6-0.347129-2.4050.010039
7-0.160437-1.11150.135936
80.1041340.72150.237062
90.0764050.52930.299501
10-0.157531-1.09140.140271
110.1896861.31420.097516
120.2388711.65490.05223
13-0.278496-1.92950.029797
140.1294410.89680.187152
150.1218580.84430.201358
160.0619780.42940.334777
170.0569810.39480.347378
18-0.037856-0.26230.397115
190.0567520.39320.347961
200.0747910.51820.303362
21-0.083241-0.57670.283415
220.0163230.11310.455215
23-0.064631-0.44780.328165
24-0.010677-0.0740.470671
25-0.017955-0.12440.450762
26-0.028072-0.19450.423306
27-0.02589-0.17940.429201
28-0.086891-0.6020.275005
290.0750640.52010.302708
300.0658030.45590.325261
31-0.125324-0.86830.194783
32-0.054105-0.37480.354712
330.0498710.34550.365608
34-0.036673-0.25410.40026
35-0.016216-0.11230.455508
36-0.072709-0.50370.308373
37-0.059211-0.41020.341732
38-0.107605-0.74550.2298
39-0.13181-0.91320.18285
400.1728111.19730.11854
410.0035470.02460.490249
42-0.025386-0.17590.430564
430.0337440.23380.408072
44-0.143462-0.99390.162619
450.0362980.25150.401259
46-0.024274-0.16820.433576
47-0.04387-0.30390.381244
48NANANA


Parameters (Session):
par1 = 48 ; par2 = 1 ; par3 = 0 ; par4 = 0 ; par5 = 12 ; par6 = White Noise ; par7 = 0.95 ;
Parameters (R input):
par1 = 48 ; par2 = 1 ; par3 = 0 ; par4 = 0 ; par5 = 12 ; par6 = White Noise ; par7 = 0.95 ; par8 = ;
R code (references can be found in the software module):
if (par1 == 'Default') {
par1 = 10*log10(length(x))
} else {
par1 <- as.numeric(par1)
}
par2 <- as.numeric(par2)
par3 <- as.numeric(par3)
par4 <- as.numeric(par4)
par5 <- as.numeric(par5)
if (par6 == 'White Noise') par6 <- 'white' else par6 <- 'ma'
par7 <- as.numeric(par7)
if (par8 != '') par8 <- as.numeric(par8)
x <- na.omit(x)
ox <- x
if (par8 == '') {
if (par2 == 0) {
x <- log(x)
} else {
x <- (x ^ par2 - 1) / par2
}
} else {
x <- log(x,base=par8)
}
if (par3 > 0) x <- diff(x,lag=1,difference=par3)
if (par4 > 0) x <- diff(x,lag=par5,difference=par4)
bitmap(file='picts.png')
op <- par(mfrow=c(2,1))
plot(ox,type='l',main='Original Time Series',xlab='time',ylab='value')
if (par8=='') {
mytitle <- paste('Working Time Series (lambda=',par2,', d=',par3,', D=',par4,')',sep='')
mysub <- paste('(lambda=',par2,', d=',par3,', D=',par4,', CI=', par7, ', CI type=',par6,')',sep='')
} else {
mytitle <- paste('Working Time Series (base=',par8,', d=',par3,', D=',par4,')',sep='')
mysub <- paste('(base=',par8,', d=',par3,', D=',par4,', CI=', par7, ', CI type=',par6,')',sep='')
}
plot(x,type='l', main=mytitle,xlab='time',ylab='value')
par(op)
dev.off()
bitmap(file='pic1.png')
racf <- acf(x, par1, main='Autocorrelation', xlab='time lag', ylab='ACF', ci.type=par6, ci=par7, sub=mysub)
dev.off()
bitmap(file='pic2.png')
rpacf <- pacf(x,par1,main='Partial Autocorrelation',xlab='lags',ylab='PACF',sub=mysub)
dev.off()
(myacf <- c(racf$acf))
(mypacf <- c(rpacf$acf))
lengthx <- length(x)
sqrtn <- sqrt(lengthx)
load(file='createtable')
a<-table.start()
a<-table.row.start(a)
a<-table.element(a,'Autocorrelation Function',4,TRUE)
a<-table.row.end(a)
a<-table.row.start(a)
a<-table.element(a,'Time lag k',header=TRUE)
a<-table.element(a,hyperlink('basics.htm','ACF(k)','click here for more information about the Autocorrelation Function'),header=TRUE)
a<-table.element(a,'T-STAT',header=TRUE)
a<-table.element(a,'P-value',header=TRUE)
a<-table.row.end(a)
for (i in 2:(par1+1)) {
a<-table.row.start(a)
a<-table.element(a,i-1,header=TRUE)
a<-table.element(a,round(myacf[i],6))
mytstat <- myacf[i]*sqrtn
a<-table.element(a,round(mytstat,4))
a<-table.element(a,round(1-pt(abs(mytstat),lengthx),6))
a<-table.row.end(a)
}
a<-table.end(a)
table.save(a,file='mytable.tab')
a<-table.start()
a<-table.row.start(a)
a<-table.element(a,'Partial Autocorrelation Function',4,TRUE)
a<-table.row.end(a)
a<-table.row.start(a)
a<-table.element(a,'Time lag k',header=TRUE)
a<-table.element(a,hyperlink('basics.htm','PACF(k)','click here for more information about the Partial Autocorrelation Function'),header=TRUE)
a<-table.element(a,'T-STAT',header=TRUE)
a<-table.element(a,'P-value',header=TRUE)
a<-table.row.end(a)
for (i in 1:par1) {
a<-table.row.start(a)
a<-table.element(a,i,header=TRUE)
a<-table.element(a,round(mypacf[i],6))
mytstat <- mypacf[i]*sqrtn
a<-table.element(a,round(mytstat,4))
a<-table.element(a,round(1-pt(abs(mytstat),lengthx),6))
a<-table.row.end(a)
}
a<-table.end(a)
table.save(a,file='mytable1.tab')