Free Statistics

of Irreproducible Research!

Author's title

Author*Unverified author*
R Software Modulerwasp_autocorrelation.wasp
Title produced by software(Partial) Autocorrelation Function
Date of computationTue, 18 Oct 2016 20:15:59 +0100
Cite this page as followsStatistical Computations at FreeStatistics.org, Office for Research Development and Education, URL https://freestatistics.org/blog/index.php?v=date/2016/Oct/18/t14768182296b4sc392iy96sy7.htm/, Retrieved Sun, 28 Apr 2024 17:09:27 +0200
Statistical Computations at FreeStatistics.org, Office for Research Development and Education, URL https://freestatistics.org/blog/index.php?pk=, Retrieved Sun, 28 Apr 2024 17:09:27 +0200
QR Codes:

Original text written by user:
IsPrivate?No (this computation is public)
User-defined keywords
Estimated Impact0
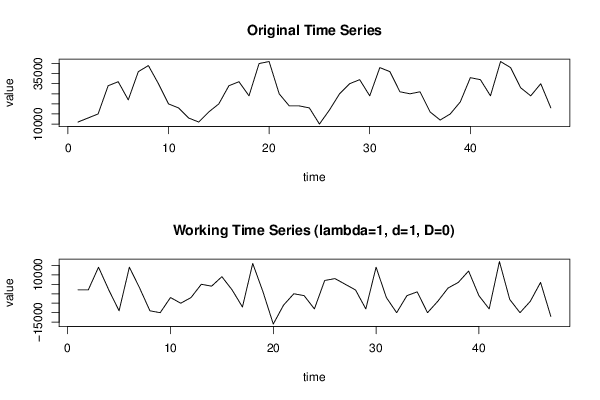
Dataseries X:
11000
13000
15000
29000
31000
22000
36000
39000
30000
20000
18000
13000
11000
16000
20000
29000
31000
24000
40000
41000
25000
19000
19000
18000
10000
17000
25000
30000
32000
24000
38000
36000
26000
25000
26000
16000
12000
15000
21000
33000
32000
24000
41000
38000
28000
24000
30000
18000


Summary of computational transaction
Raw Inputview raw input (R code)
Raw Outputview raw output of R engine
Computing time1 seconds
R Server'Sir Ronald Aylmer Fisher' @ fisher.wessa.net

\begin{tabular}{lllllllll}
\hline
Summary of computational transaction \tabularnewline
Raw Input & view raw input (R code)  \tabularnewline
Raw Output & view raw output of R engine  \tabularnewline
Computing time & 1 seconds \tabularnewline
R Server & 'Sir Ronald Aylmer Fisher' @ fisher.wessa.net \tabularnewline
\hline
\end{tabular}
%Source: https://freestatistics.org/blog/index.php?pk=&T=0

[TABLE]
[ROW][C]Summary of computational transaction[/C][/ROW]
[ROW][C]Raw Input[/C][C]view raw input (R code) [/C][/ROW]
[ROW][C]Raw Output[/C][C]view raw output of R engine [/C][/ROW]
[ROW][C]Computing time[/C][C]1 seconds[/C][/ROW]
[ROW][C]R Server[/C][C]'Sir Ronald Aylmer Fisher' @ fisher.wessa.net[/C][/ROW]
[/TABLE]
Source: https://freestatistics.org/blog/index.php?pk=&T=0

Globally Unique Identifier (entire table): ba.freestatistics.org/blog/index.php?pk=&T=0

As an alternative you can also use a QR Code:  

The GUIDs for individual cells are displayed in the table below:

Summary of computational transaction
Raw Inputview raw input (R code)
Raw Outputview raw output of R engine
Computing time1 seconds
R Server'Sir Ronald Aylmer Fisher' @ fisher.wessa.net


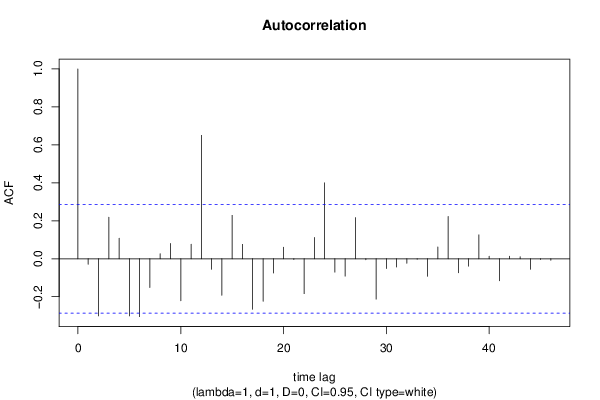
Autocorrelation Function
Time lag kACF(k)T-STATP-value
1-0.028826-0.19760.422097
2-0.30101-2.06360.0223
30.2186971.49930.070241
40.1077740.73890.231833
5-0.30086-2.06260.022351
6-0.30504-2.09120.020969
7-0.151657-1.03970.151897
80.026070.17870.429459
90.0807460.55360.291249
10-0.220952-1.51480.068264
110.0761150.52180.302125
120.6499384.45582.6e-05
13-0.055519-0.38060.352601
14-0.192744-1.32140.096385
150.2284781.56640.061986
160.0757760.51950.302927
17-0.265658-1.82130.037468
18-0.224065-1.53610.065608
19-0.0755-0.51760.303582
200.0605840.41530.33989
21-0.003827-0.02620.489589
22-0.183692-1.25930.107065
230.1117540.76610.22371
240.3996942.74020.004327
25-0.070706-0.48470.315058
26-0.091539-0.62760.266665
270.2166961.48560.072032
28-0.005378-0.03690.485373
29-0.212613-1.45760.0758
30-0.051409-0.35240.363041
31-0.043445-0.29780.383567
32-0.023638-0.16210.435979
33-0.003028-0.02080.491763
34-0.092409-0.63350.264732
350.0616480.42260.337244
360.2230671.52930.066451
37-0.074215-0.50880.306639
38-0.038981-0.26720.395227
390.1258720.86290.196278
400.0128270.08790.46515
41-0.116139-0.79620.214956
420.0134430.09220.463481
430.0108120.07410.470614
44-0.055636-0.38140.352305
45-0.003928-0.02690.489316
46-0.007577-0.05190.479396
47NANANA
48NANANA

\begin{tabular}{lllllllll}
\hline
Autocorrelation Function \tabularnewline
Time lag k & ACF(k) & T-STAT & P-value \tabularnewline
1 & -0.028826 & -0.1976 & 0.422097 \tabularnewline
2 & -0.30101 & -2.0636 & 0.0223 \tabularnewline
3 & 0.218697 & 1.4993 & 0.070241 \tabularnewline
4 & 0.107774 & 0.7389 & 0.231833 \tabularnewline
5 & -0.30086 & -2.0626 & 0.022351 \tabularnewline
6 & -0.30504 & -2.0912 & 0.020969 \tabularnewline
7 & -0.151657 & -1.0397 & 0.151897 \tabularnewline
8 & 0.02607 & 0.1787 & 0.429459 \tabularnewline
9 & 0.080746 & 0.5536 & 0.291249 \tabularnewline
10 & -0.220952 & -1.5148 & 0.068264 \tabularnewline
11 & 0.076115 & 0.5218 & 0.302125 \tabularnewline
12 & 0.649938 & 4.4558 & 2.6e-05 \tabularnewline
13 & -0.055519 & -0.3806 & 0.352601 \tabularnewline
14 & -0.192744 & -1.3214 & 0.096385 \tabularnewline
15 & 0.228478 & 1.5664 & 0.061986 \tabularnewline
16 & 0.075776 & 0.5195 & 0.302927 \tabularnewline
17 & -0.265658 & -1.8213 & 0.037468 \tabularnewline
18 & -0.224065 & -1.5361 & 0.065608 \tabularnewline
19 & -0.0755 & -0.5176 & 0.303582 \tabularnewline
20 & 0.060584 & 0.4153 & 0.33989 \tabularnewline
21 & -0.003827 & -0.0262 & 0.489589 \tabularnewline
22 & -0.183692 & -1.2593 & 0.107065 \tabularnewline
23 & 0.111754 & 0.7661 & 0.22371 \tabularnewline
24 & 0.399694 & 2.7402 & 0.004327 \tabularnewline
25 & -0.070706 & -0.4847 & 0.315058 \tabularnewline
26 & -0.091539 & -0.6276 & 0.266665 \tabularnewline
27 & 0.216696 & 1.4856 & 0.072032 \tabularnewline
28 & -0.005378 & -0.0369 & 0.485373 \tabularnewline
29 & -0.212613 & -1.4576 & 0.0758 \tabularnewline
30 & -0.051409 & -0.3524 & 0.363041 \tabularnewline
31 & -0.043445 & -0.2978 & 0.383567 \tabularnewline
32 & -0.023638 & -0.1621 & 0.435979 \tabularnewline
33 & -0.003028 & -0.0208 & 0.491763 \tabularnewline
34 & -0.092409 & -0.6335 & 0.264732 \tabularnewline
35 & 0.061648 & 0.4226 & 0.337244 \tabularnewline
36 & 0.223067 & 1.5293 & 0.066451 \tabularnewline
37 & -0.074215 & -0.5088 & 0.306639 \tabularnewline
38 & -0.038981 & -0.2672 & 0.395227 \tabularnewline
39 & 0.125872 & 0.8629 & 0.196278 \tabularnewline
40 & 0.012827 & 0.0879 & 0.46515 \tabularnewline
41 & -0.116139 & -0.7962 & 0.214956 \tabularnewline
42 & 0.013443 & 0.0922 & 0.463481 \tabularnewline
43 & 0.010812 & 0.0741 & 0.470614 \tabularnewline
44 & -0.055636 & -0.3814 & 0.352305 \tabularnewline
45 & -0.003928 & -0.0269 & 0.489316 \tabularnewline
46 & -0.007577 & -0.0519 & 0.479396 \tabularnewline
47 & NA & NA & NA \tabularnewline
48 & NA & NA & NA \tabularnewline
\hline
\end{tabular}
%Source: https://freestatistics.org/blog/index.php?pk=&T=1

[TABLE]
[ROW][C]Autocorrelation Function[/C][/ROW]
[ROW][C]Time lag k[/C][C]ACF(k)[/C][C]T-STAT[/C][C]P-value[/C][/ROW]
[ROW][C]1[/C][C]-0.028826[/C][C]-0.1976[/C][C]0.422097[/C][/ROW]
[ROW][C]2[/C][C]-0.30101[/C][C]-2.0636[/C][C]0.0223[/C][/ROW]
[ROW][C]3[/C][C]0.218697[/C][C]1.4993[/C][C]0.070241[/C][/ROW]
[ROW][C]4[/C][C]0.107774[/C][C]0.7389[/C][C]0.231833[/C][/ROW]
[ROW][C]5[/C][C]-0.30086[/C][C]-2.0626[/C][C]0.022351[/C][/ROW]
[ROW][C]6[/C][C]-0.30504[/C][C]-2.0912[/C][C]0.020969[/C][/ROW]
[ROW][C]7[/C][C]-0.151657[/C][C]-1.0397[/C][C]0.151897[/C][/ROW]
[ROW][C]8[/C][C]0.02607[/C][C]0.1787[/C][C]0.429459[/C][/ROW]
[ROW][C]9[/C][C]0.080746[/C][C]0.5536[/C][C]0.291249[/C][/ROW]
[ROW][C]10[/C][C]-0.220952[/C][C]-1.5148[/C][C]0.068264[/C][/ROW]
[ROW][C]11[/C][C]0.076115[/C][C]0.5218[/C][C]0.302125[/C][/ROW]
[ROW][C]12[/C][C]0.649938[/C][C]4.4558[/C][C]2.6e-05[/C][/ROW]
[ROW][C]13[/C][C]-0.055519[/C][C]-0.3806[/C][C]0.352601[/C][/ROW]
[ROW][C]14[/C][C]-0.192744[/C][C]-1.3214[/C][C]0.096385[/C][/ROW]
[ROW][C]15[/C][C]0.228478[/C][C]1.5664[/C][C]0.061986[/C][/ROW]
[ROW][C]16[/C][C]0.075776[/C][C]0.5195[/C][C]0.302927[/C][/ROW]
[ROW][C]17[/C][C]-0.265658[/C][C]-1.8213[/C][C]0.037468[/C][/ROW]
[ROW][C]18[/C][C]-0.224065[/C][C]-1.5361[/C][C]0.065608[/C][/ROW]
[ROW][C]19[/C][C]-0.0755[/C][C]-0.5176[/C][C]0.303582[/C][/ROW]
[ROW][C]20[/C][C]0.060584[/C][C]0.4153[/C][C]0.33989[/C][/ROW]
[ROW][C]21[/C][C]-0.003827[/C][C]-0.0262[/C][C]0.489589[/C][/ROW]
[ROW][C]22[/C][C]-0.183692[/C][C]-1.2593[/C][C]0.107065[/C][/ROW]
[ROW][C]23[/C][C]0.111754[/C][C]0.7661[/C][C]0.22371[/C][/ROW]
[ROW][C]24[/C][C]0.399694[/C][C]2.7402[/C][C]0.004327[/C][/ROW]
[ROW][C]25[/C][C]-0.070706[/C][C]-0.4847[/C][C]0.315058[/C][/ROW]
[ROW][C]26[/C][C]-0.091539[/C][C]-0.6276[/C][C]0.266665[/C][/ROW]
[ROW][C]27[/C][C]0.216696[/C][C]1.4856[/C][C]0.072032[/C][/ROW]
[ROW][C]28[/C][C]-0.005378[/C][C]-0.0369[/C][C]0.485373[/C][/ROW]
[ROW][C]29[/C][C]-0.212613[/C][C]-1.4576[/C][C]0.0758[/C][/ROW]
[ROW][C]30[/C][C]-0.051409[/C][C]-0.3524[/C][C]0.363041[/C][/ROW]
[ROW][C]31[/C][C]-0.043445[/C][C]-0.2978[/C][C]0.383567[/C][/ROW]
[ROW][C]32[/C][C]-0.023638[/C][C]-0.1621[/C][C]0.435979[/C][/ROW]
[ROW][C]33[/C][C]-0.003028[/C][C]-0.0208[/C][C]0.491763[/C][/ROW]
[ROW][C]34[/C][C]-0.092409[/C][C]-0.6335[/C][C]0.264732[/C][/ROW]
[ROW][C]35[/C][C]0.061648[/C][C]0.4226[/C][C]0.337244[/C][/ROW]
[ROW][C]36[/C][C]0.223067[/C][C]1.5293[/C][C]0.066451[/C][/ROW]
[ROW][C]37[/C][C]-0.074215[/C][C]-0.5088[/C][C]0.306639[/C][/ROW]
[ROW][C]38[/C][C]-0.038981[/C][C]-0.2672[/C][C]0.395227[/C][/ROW]
[ROW][C]39[/C][C]0.125872[/C][C]0.8629[/C][C]0.196278[/C][/ROW]
[ROW][C]40[/C][C]0.012827[/C][C]0.0879[/C][C]0.46515[/C][/ROW]
[ROW][C]41[/C][C]-0.116139[/C][C]-0.7962[/C][C]0.214956[/C][/ROW]
[ROW][C]42[/C][C]0.013443[/C][C]0.0922[/C][C]0.463481[/C][/ROW]
[ROW][C]43[/C][C]0.010812[/C][C]0.0741[/C][C]0.470614[/C][/ROW]
[ROW][C]44[/C][C]-0.055636[/C][C]-0.3814[/C][C]0.352305[/C][/ROW]
[ROW][C]45[/C][C]-0.003928[/C][C]-0.0269[/C][C]0.489316[/C][/ROW]
[ROW][C]46[/C][C]-0.007577[/C][C]-0.0519[/C][C]0.479396[/C][/ROW]
[ROW][C]47[/C][C]NA[/C][C]NA[/C][C]NA[/C][/ROW]
[ROW][C]48[/C][C]NA[/C][C]NA[/C][C]NA[/C][/ROW]
[/TABLE]
Source: https://freestatistics.org/blog/index.php?pk=&T=1

Globally Unique Identifier (entire table): ba.freestatistics.org/blog/index.php?pk=&T=1

As an alternative you can also use a QR Code:  

The GUIDs for individual cells are displayed in the table below:

Autocorrelation Function
Time lag kACF(k)T-STATP-value
1-0.028826-0.19760.422097
2-0.30101-2.06360.0223
30.2186971.49930.070241
40.1077740.73890.231833
5-0.30086-2.06260.022351
6-0.30504-2.09120.020969
7-0.151657-1.03970.151897
80.026070.17870.429459
90.0807460.55360.291249
10-0.220952-1.51480.068264
110.0761150.52180.302125
120.6499384.45582.6e-05
13-0.055519-0.38060.352601
14-0.192744-1.32140.096385
150.2284781.56640.061986
160.0757760.51950.302927
17-0.265658-1.82130.037468
18-0.224065-1.53610.065608
19-0.0755-0.51760.303582
200.0605840.41530.33989
21-0.003827-0.02620.489589
22-0.183692-1.25930.107065
230.1117540.76610.22371
240.3996942.74020.004327
25-0.070706-0.48470.315058
26-0.091539-0.62760.266665
270.2166961.48560.072032
28-0.005378-0.03690.485373
29-0.212613-1.45760.0758
30-0.051409-0.35240.363041
31-0.043445-0.29780.383567
32-0.023638-0.16210.435979
33-0.003028-0.02080.491763
34-0.092409-0.63350.264732
350.0616480.42260.337244
360.2230671.52930.066451
37-0.074215-0.50880.306639
38-0.038981-0.26720.395227
390.1258720.86290.196278
400.0128270.08790.46515
41-0.116139-0.79620.214956
420.0134430.09220.463481
430.0108120.07410.470614
44-0.055636-0.38140.352305
45-0.003928-0.02690.489316
46-0.007577-0.05190.479396
47NANANA
48NANANA


Partial Autocorrelation Function
Time lag kPACF(k)T-STATP-value
1-0.028826-0.19760.422097
2-0.302092-2.0710.021936
30.2188261.50020.070126
40.0224090.15360.439279
5-0.201672-1.38260.086662
6-0.365551-2.50610.007864
7-0.437191-2.99720.002171
8-0.193122-1.3240.095956
90.1046990.71780.238224
10-0.219763-1.50660.0693
11-0.160368-1.09940.13859
120.3931962.69560.004859
13-0.061372-0.42070.33793
140.0497910.34130.367181
15-0.091094-0.62450.267657
16-0.081457-0.55840.289596
170.0535990.36750.357463
18-0.011395-0.07810.469033
19-0.012097-0.08290.467129
200.1360490.93270.17787
21-0.002995-0.02050.491854
22-0.000739-0.00510.49799
23-0.063903-0.43810.331661
24-0.121199-0.83090.205116
250.0168760.11570.454192
260.0702570.48170.316142
270.0747510.51250.305362
28-0.061675-0.42280.337177
29-0.095885-0.65740.25708
300.1114350.7640.224354
310.041430.2840.388817
32-0.039359-0.26980.394236
330.0124330.08520.466218
34-0.005465-0.03750.485135
350.0069470.04760.481109
360.0131540.09020.464263
37-0.087511-0.59990.275712
380.0037230.02550.489872
39-0.117345-0.80450.212586
400.0673790.46190.323133
410.0511730.35080.363645
420.0198710.13620.44611
430.1191620.81690.209045
44-0.043275-0.29670.384009
45-0.057192-0.39210.348383
460.05860.40170.344848
47NANANA
48NANANA

\begin{tabular}{lllllllll}
\hline
Partial Autocorrelation Function \tabularnewline
Time lag k & PACF(k) & T-STAT & P-value \tabularnewline
1 & -0.028826 & -0.1976 & 0.422097 \tabularnewline
2 & -0.302092 & -2.071 & 0.021936 \tabularnewline
3 & 0.218826 & 1.5002 & 0.070126 \tabularnewline
4 & 0.022409 & 0.1536 & 0.439279 \tabularnewline
5 & -0.201672 & -1.3826 & 0.086662 \tabularnewline
6 & -0.365551 & -2.5061 & 0.007864 \tabularnewline
7 & -0.437191 & -2.9972 & 0.002171 \tabularnewline
8 & -0.193122 & -1.324 & 0.095956 \tabularnewline
9 & 0.104699 & 0.7178 & 0.238224 \tabularnewline
10 & -0.219763 & -1.5066 & 0.0693 \tabularnewline
11 & -0.160368 & -1.0994 & 0.13859 \tabularnewline
12 & 0.393196 & 2.6956 & 0.004859 \tabularnewline
13 & -0.061372 & -0.4207 & 0.33793 \tabularnewline
14 & 0.049791 & 0.3413 & 0.367181 \tabularnewline
15 & -0.091094 & -0.6245 & 0.267657 \tabularnewline
16 & -0.081457 & -0.5584 & 0.289596 \tabularnewline
17 & 0.053599 & 0.3675 & 0.357463 \tabularnewline
18 & -0.011395 & -0.0781 & 0.469033 \tabularnewline
19 & -0.012097 & -0.0829 & 0.467129 \tabularnewline
20 & 0.136049 & 0.9327 & 0.17787 \tabularnewline
21 & -0.002995 & -0.0205 & 0.491854 \tabularnewline
22 & -0.000739 & -0.0051 & 0.49799 \tabularnewline
23 & -0.063903 & -0.4381 & 0.331661 \tabularnewline
24 & -0.121199 & -0.8309 & 0.205116 \tabularnewline
25 & 0.016876 & 0.1157 & 0.454192 \tabularnewline
26 & 0.070257 & 0.4817 & 0.316142 \tabularnewline
27 & 0.074751 & 0.5125 & 0.305362 \tabularnewline
28 & -0.061675 & -0.4228 & 0.337177 \tabularnewline
29 & -0.095885 & -0.6574 & 0.25708 \tabularnewline
30 & 0.111435 & 0.764 & 0.224354 \tabularnewline
31 & 0.04143 & 0.284 & 0.388817 \tabularnewline
32 & -0.039359 & -0.2698 & 0.394236 \tabularnewline
33 & 0.012433 & 0.0852 & 0.466218 \tabularnewline
34 & -0.005465 & -0.0375 & 0.485135 \tabularnewline
35 & 0.006947 & 0.0476 & 0.481109 \tabularnewline
36 & 0.013154 & 0.0902 & 0.464263 \tabularnewline
37 & -0.087511 & -0.5999 & 0.275712 \tabularnewline
38 & 0.003723 & 0.0255 & 0.489872 \tabularnewline
39 & -0.117345 & -0.8045 & 0.212586 \tabularnewline
40 & 0.067379 & 0.4619 & 0.323133 \tabularnewline
41 & 0.051173 & 0.3508 & 0.363645 \tabularnewline
42 & 0.019871 & 0.1362 & 0.44611 \tabularnewline
43 & 0.119162 & 0.8169 & 0.209045 \tabularnewline
44 & -0.043275 & -0.2967 & 0.384009 \tabularnewline
45 & -0.057192 & -0.3921 & 0.348383 \tabularnewline
46 & 0.0586 & 0.4017 & 0.344848 \tabularnewline
47 & NA & NA & NA \tabularnewline
48 & NA & NA & NA \tabularnewline
\hline
\end{tabular}
%Source: https://freestatistics.org/blog/index.php?pk=&T=2

[TABLE]
[ROW][C]Partial Autocorrelation Function[/C][/ROW]
[ROW][C]Time lag k[/C][C]PACF(k)[/C][C]T-STAT[/C][C]P-value[/C][/ROW]
[ROW][C]1[/C][C]-0.028826[/C][C]-0.1976[/C][C]0.422097[/C][/ROW]
[ROW][C]2[/C][C]-0.302092[/C][C]-2.071[/C][C]0.021936[/C][/ROW]
[ROW][C]3[/C][C]0.218826[/C][C]1.5002[/C][C]0.070126[/C][/ROW]
[ROW][C]4[/C][C]0.022409[/C][C]0.1536[/C][C]0.439279[/C][/ROW]
[ROW][C]5[/C][C]-0.201672[/C][C]-1.3826[/C][C]0.086662[/C][/ROW]
[ROW][C]6[/C][C]-0.365551[/C][C]-2.5061[/C][C]0.007864[/C][/ROW]
[ROW][C]7[/C][C]-0.437191[/C][C]-2.9972[/C][C]0.002171[/C][/ROW]
[ROW][C]8[/C][C]-0.193122[/C][C]-1.324[/C][C]0.095956[/C][/ROW]
[ROW][C]9[/C][C]0.104699[/C][C]0.7178[/C][C]0.238224[/C][/ROW]
[ROW][C]10[/C][C]-0.219763[/C][C]-1.5066[/C][C]0.0693[/C][/ROW]
[ROW][C]11[/C][C]-0.160368[/C][C]-1.0994[/C][C]0.13859[/C][/ROW]
[ROW][C]12[/C][C]0.393196[/C][C]2.6956[/C][C]0.004859[/C][/ROW]
[ROW][C]13[/C][C]-0.061372[/C][C]-0.4207[/C][C]0.33793[/C][/ROW]
[ROW][C]14[/C][C]0.049791[/C][C]0.3413[/C][C]0.367181[/C][/ROW]
[ROW][C]15[/C][C]-0.091094[/C][C]-0.6245[/C][C]0.267657[/C][/ROW]
[ROW][C]16[/C][C]-0.081457[/C][C]-0.5584[/C][C]0.289596[/C][/ROW]
[ROW][C]17[/C][C]0.053599[/C][C]0.3675[/C][C]0.357463[/C][/ROW]
[ROW][C]18[/C][C]-0.011395[/C][C]-0.0781[/C][C]0.469033[/C][/ROW]
[ROW][C]19[/C][C]-0.012097[/C][C]-0.0829[/C][C]0.467129[/C][/ROW]
[ROW][C]20[/C][C]0.136049[/C][C]0.9327[/C][C]0.17787[/C][/ROW]
[ROW][C]21[/C][C]-0.002995[/C][C]-0.0205[/C][C]0.491854[/C][/ROW]
[ROW][C]22[/C][C]-0.000739[/C][C]-0.0051[/C][C]0.49799[/C][/ROW]
[ROW][C]23[/C][C]-0.063903[/C][C]-0.4381[/C][C]0.331661[/C][/ROW]
[ROW][C]24[/C][C]-0.121199[/C][C]-0.8309[/C][C]0.205116[/C][/ROW]
[ROW][C]25[/C][C]0.016876[/C][C]0.1157[/C][C]0.454192[/C][/ROW]
[ROW][C]26[/C][C]0.070257[/C][C]0.4817[/C][C]0.316142[/C][/ROW]
[ROW][C]27[/C][C]0.074751[/C][C]0.5125[/C][C]0.305362[/C][/ROW]
[ROW][C]28[/C][C]-0.061675[/C][C]-0.4228[/C][C]0.337177[/C][/ROW]
[ROW][C]29[/C][C]-0.095885[/C][C]-0.6574[/C][C]0.25708[/C][/ROW]
[ROW][C]30[/C][C]0.111435[/C][C]0.764[/C][C]0.224354[/C][/ROW]
[ROW][C]31[/C][C]0.04143[/C][C]0.284[/C][C]0.388817[/C][/ROW]
[ROW][C]32[/C][C]-0.039359[/C][C]-0.2698[/C][C]0.394236[/C][/ROW]
[ROW][C]33[/C][C]0.012433[/C][C]0.0852[/C][C]0.466218[/C][/ROW]
[ROW][C]34[/C][C]-0.005465[/C][C]-0.0375[/C][C]0.485135[/C][/ROW]
[ROW][C]35[/C][C]0.006947[/C][C]0.0476[/C][C]0.481109[/C][/ROW]
[ROW][C]36[/C][C]0.013154[/C][C]0.0902[/C][C]0.464263[/C][/ROW]
[ROW][C]37[/C][C]-0.087511[/C][C]-0.5999[/C][C]0.275712[/C][/ROW]
[ROW][C]38[/C][C]0.003723[/C][C]0.0255[/C][C]0.489872[/C][/ROW]
[ROW][C]39[/C][C]-0.117345[/C][C]-0.8045[/C][C]0.212586[/C][/ROW]
[ROW][C]40[/C][C]0.067379[/C][C]0.4619[/C][C]0.323133[/C][/ROW]
[ROW][C]41[/C][C]0.051173[/C][C]0.3508[/C][C]0.363645[/C][/ROW]
[ROW][C]42[/C][C]0.019871[/C][C]0.1362[/C][C]0.44611[/C][/ROW]
[ROW][C]43[/C][C]0.119162[/C][C]0.8169[/C][C]0.209045[/C][/ROW]
[ROW][C]44[/C][C]-0.043275[/C][C]-0.2967[/C][C]0.384009[/C][/ROW]
[ROW][C]45[/C][C]-0.057192[/C][C]-0.3921[/C][C]0.348383[/C][/ROW]
[ROW][C]46[/C][C]0.0586[/C][C]0.4017[/C][C]0.344848[/C][/ROW]
[ROW][C]47[/C][C]NA[/C][C]NA[/C][C]NA[/C][/ROW]
[ROW][C]48[/C][C]NA[/C][C]NA[/C][C]NA[/C][/ROW]
[/TABLE]
Source: https://freestatistics.org/blog/index.php?pk=&T=2

Globally Unique Identifier (entire table): ba.freestatistics.org/blog/index.php?pk=&T=2

As an alternative you can also use a QR Code:  

The GUIDs for individual cells are displayed in the table below:

Partial Autocorrelation Function
Time lag kPACF(k)T-STATP-value
1-0.028826-0.19760.422097
2-0.302092-2.0710.021936
30.2188261.50020.070126
40.0224090.15360.439279
5-0.201672-1.38260.086662
6-0.365551-2.50610.007864
7-0.437191-2.99720.002171
8-0.193122-1.3240.095956
90.1046990.71780.238224
10-0.219763-1.50660.0693
11-0.160368-1.09940.13859
120.3931962.69560.004859
13-0.061372-0.42070.33793
140.0497910.34130.367181
15-0.091094-0.62450.267657
16-0.081457-0.55840.289596
170.0535990.36750.357463
18-0.011395-0.07810.469033
19-0.012097-0.08290.467129
200.1360490.93270.17787
21-0.002995-0.02050.491854
22-0.000739-0.00510.49799
23-0.063903-0.43810.331661
24-0.121199-0.83090.205116
250.0168760.11570.454192
260.0702570.48170.316142
270.0747510.51250.305362
28-0.061675-0.42280.337177
29-0.095885-0.65740.25708
300.1114350.7640.224354
310.041430.2840.388817
32-0.039359-0.26980.394236
330.0124330.08520.466218
34-0.005465-0.03750.485135
350.0069470.04760.481109
360.0131540.09020.464263
37-0.087511-0.59990.275712
380.0037230.02550.489872
39-0.117345-0.80450.212586
400.0673790.46190.323133
410.0511730.35080.363645
420.0198710.13620.44611
430.1191620.81690.209045
44-0.043275-0.29670.384009
45-0.057192-0.39210.348383
460.05860.40170.344848
47NANANA
48NANANA


Parameters (Session):
par1 = 48 ; par2 = 1 ; par3 = 1 ; par4 = 0 ; par5 = 12 ; par6 = White Noise ; par7 = 0.95 ;
Parameters (R input):
par1 = 48 ; par2 = 1 ; par3 = 1 ; par4 = 0 ; par5 = 12 ; par6 = White Noise ; par7 = 0.95 ; par8 = ;
R code (references can be found in the software module):
par8 <- ''
par7 <- '0.95'
par6 <- 'White Noise'
par5 <- '12'
par4 <- '0'
par3 <- '1'
par2 <- '1'
par1 <- 'Default'
if (par1 == 'Default') {
par1 = 10*log10(length(x))
} else {
par1 <- as.numeric(par1)
}
par2 <- as.numeric(par2)
par3 <- as.numeric(par3)
par4 <- as.numeric(par4)
par5 <- as.numeric(par5)
if (par6 == 'White Noise') par6 <- 'white' else par6 <- 'ma'
par7 <- as.numeric(par7)
if (par8 != '') par8 <- as.numeric(par8)
x <- na.omit(x)
ox <- x
if (par8 == '') {
if (par2 == 0) {
x <- log(x)
} else {
x <- (x ^ par2 - 1) / par2
}
} else {
x <- log(x,base=par8)
}
if (par3 > 0) x <- diff(x,lag=1,difference=par3)
if (par4 > 0) x <- diff(x,lag=par5,difference=par4)
bitmap(file='picts.png')
op <- par(mfrow=c(2,1))
plot(ox,type='l',main='Original Time Series',xlab='time',ylab='value')
if (par8=='') {
mytitle <- paste('Working Time Series (lambda=',par2,', d=',par3,', D=',par4,')',sep='')
mysub <- paste('(lambda=',par2,', d=',par3,', D=',par4,', CI=', par7, ', CI type=',par6,')',sep='')
} else {
mytitle <- paste('Working Time Series (base=',par8,', d=',par3,', D=',par4,')',sep='')
mysub <- paste('(base=',par8,', d=',par3,', D=',par4,', CI=', par7, ', CI type=',par6,')',sep='')
}
plot(x,type='l', main=mytitle,xlab='time',ylab='value')
par(op)
dev.off()
bitmap(file='pic1.png')
racf <- acf(x, par1, main='Autocorrelation', xlab='time lag', ylab='ACF', ci.type=par6, ci=par7, sub=mysub)
dev.off()
bitmap(file='pic2.png')
rpacf <- pacf(x,par1,main='Partial Autocorrelation',xlab='lags',ylab='PACF',sub=mysub)
dev.off()
(myacf <- c(racf$acf))
(mypacf <- c(rpacf$acf))
lengthx <- length(x)
sqrtn <- sqrt(lengthx)
load(file='createtable')
a<-table.start()
a<-table.row.start(a)
a<-table.element(a,'Autocorrelation Function',4,TRUE)
a<-table.row.end(a)
a<-table.row.start(a)
a<-table.element(a,'Time lag k',header=TRUE)
a<-table.element(a,hyperlink('basics.htm','ACF(k)','click here for more information about the Autocorrelation Function'),header=TRUE)
a<-table.element(a,'T-STAT',header=TRUE)
a<-table.element(a,'P-value',header=TRUE)
a<-table.row.end(a)
for (i in 2:(par1+1)) {
a<-table.row.start(a)
a<-table.element(a,i-1,header=TRUE)
a<-table.element(a,round(myacf[i],6))
mytstat <- myacf[i]*sqrtn
a<-table.element(a,round(mytstat,4))
a<-table.element(a,round(1-pt(abs(mytstat),lengthx),6))
a<-table.row.end(a)
}
a<-table.end(a)
table.save(a,file='mytable.tab')
a<-table.start()
a<-table.row.start(a)
a<-table.element(a,'Partial Autocorrelation Function',4,TRUE)
a<-table.row.end(a)
a<-table.row.start(a)
a<-table.element(a,'Time lag k',header=TRUE)
a<-table.element(a,hyperlink('basics.htm','PACF(k)','click here for more information about the Partial Autocorrelation Function'),header=TRUE)
a<-table.element(a,'T-STAT',header=TRUE)
a<-table.element(a,'P-value',header=TRUE)
a<-table.row.end(a)
for (i in 1:par1) {
a<-table.row.start(a)
a<-table.element(a,i,header=TRUE)
a<-table.element(a,round(mypacf[i],6))
mytstat <- mypacf[i]*sqrtn
a<-table.element(a,round(mytstat,4))
a<-table.element(a,round(1-pt(abs(mytstat),lengthx),6))
a<-table.row.end(a)
}
a<-table.end(a)
table.save(a,file='mytable1.tab')