Free Statistics

of Irreproducible Research!

Author's title

Author*Unverified author*
R Software Modulerwasp_autocorrelation.wasp
Title produced by software(Partial) Autocorrelation Function
Date of computationTue, 18 Oct 2016 20:40:13 +0100
Cite this page as followsStatistical Computations at FreeStatistics.org, Office for Research Development and Education, URL https://freestatistics.org/blog/index.php?v=date/2016/Oct/18/t1476819681elopo57wa5dmpza.htm/, Retrieved Sun, 28 Apr 2024 01:19:13 +0200
Statistical Computations at FreeStatistics.org, Office for Research Development and Education, URL https://freestatistics.org/blog/index.php?pk=, Retrieved Sun, 28 Apr 2024 01:19:13 +0200
QR Codes:

Original text written by user:
IsPrivate?No (this computation is public)
User-defined keywords
Estimated Impact0
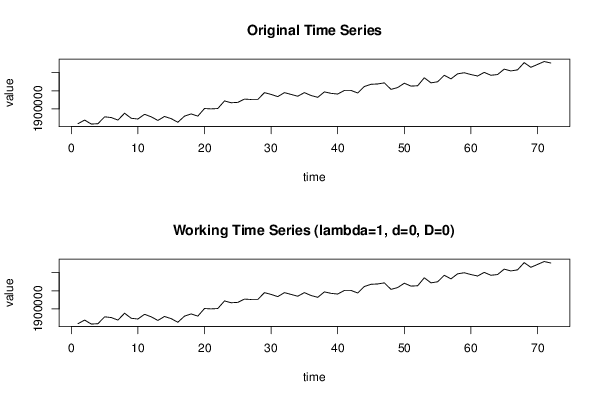
Dataseries X:
1859000
1869000
1858000
1859000
1878000
1876000
1869000
1888000
1874000
1872000
1885000
1878000
1868000
1879000
1873000
1863000
1880000
1886000
1880000
1901000
1900000
1901000
1922000
1917000
1918000
1927000
1926000
1926000
1945000
1940000
1934000
1945000
1940000
1935000
1945000
1937000
1932000
1947000
1943000
1941000
1951000
1951000
1944000
1962000
1968000
1969000
1972000
1954000
1959000
1971000
1963000
1964000
1986000
1972000
1975000
1993000
1983000
1997000
2000000
1995000
1991000
2001000
1993000
1995000
2010000
2005000
2008000
2028000
2015000
2023000
2031000
2027000


Summary of computational transaction
Raw Inputview raw input (R code)
Raw Outputview raw output of R engine
Computing time2 seconds
R Server'Gertrude Mary Cox' @ cox.wessa.net

\begin{tabular}{lllllllll}
\hline
Summary of computational transaction \tabularnewline
Raw Input & view raw input (R code)  \tabularnewline
Raw Output & view raw output of R engine  \tabularnewline
Computing time & 2 seconds \tabularnewline
R Server & 'Gertrude Mary Cox' @ cox.wessa.net \tabularnewline
\hline
\end{tabular}
%Source: https://freestatistics.org/blog/index.php?pk=&T=0

[TABLE]
[ROW][C]Summary of computational transaction[/C][/ROW]
[ROW][C]Raw Input[/C][C]view raw input (R code) [/C][/ROW]
[ROW][C]Raw Output[/C][C]view raw output of R engine [/C][/ROW]
[ROW][C]Computing time[/C][C]2 seconds[/C][/ROW]
[ROW][C]R Server[/C][C]'Gertrude Mary Cox' @ cox.wessa.net[/C][/ROW]
[/TABLE]
Source: https://freestatistics.org/blog/index.php?pk=&T=0

Globally Unique Identifier (entire table): ba.freestatistics.org/blog/index.php?pk=&T=0

As an alternative you can also use a QR Code:  

The GUIDs for individual cells are displayed in the table below:

Summary of computational transaction
Raw Inputview raw input (R code)
Raw Outputview raw output of R engine
Computing time2 seconds
R Server'Gertrude Mary Cox' @ cox.wessa.net


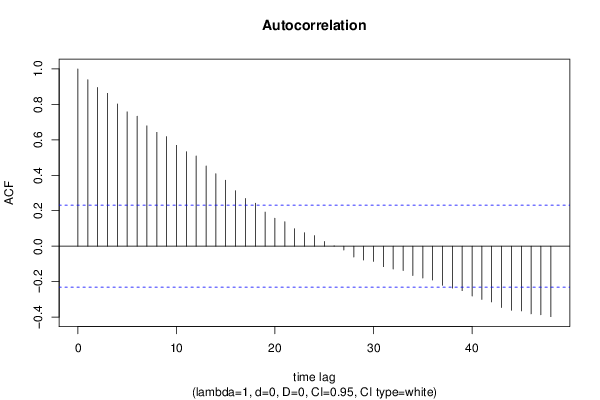
Autocorrelation Function
Time lag kACF(k)T-STATP-value
10.9391417.96890
20.8953857.59760
30.8624097.31780
40.8025886.81020
50.7577596.42980
60.7332516.22180
70.6788925.76060
80.6421095.44850
90.6181115.24481e-06
100.5687974.82644e-06
110.5330734.52331.2e-05
120.5092094.32082.4e-05
130.4520173.83550.000133
140.4082743.46430.00045
150.3720653.15710.001164
160.3130462.65630.004862
170.2692392.28460.012644
180.2424292.05710.021651
190.192161.63050.053678
200.1574271.33580.092909
210.1380091.1710.122721
220.0985290.8360.202947
230.0758470.64360.260945
240.059540.50520.307475
250.0264090.22410.411662
260.0009780.00830.4967
27-0.021393-0.18150.428232
28-0.061086-0.51830.302907
29-0.078198-0.66350.254556
30-0.086057-0.73020.233814
31-0.115694-0.98170.164769
32-0.128928-1.0940.138802
33-0.137638-1.16790.123351
34-0.165511-1.40440.082248
35-0.17984-1.5260.065696
36-0.190964-1.62040.054761
37-0.220558-1.87150.032669
38-0.236585-2.00750.024226
39-0.250794-2.12810.018378
40-0.281336-2.38720.009802
41-0.300234-2.54760.006492
42-0.314536-2.66890.004698
43-0.345793-2.93410.002242
44-0.3612-3.06490.001532
45-0.365246-3.09920.001384
46-0.38191-3.24060.000904
47-0.387089-3.28460.00079
48-0.397697-3.37460.000597

\begin{tabular}{lllllllll}
\hline
Autocorrelation Function \tabularnewline
Time lag k & ACF(k) & T-STAT & P-value \tabularnewline
1 & 0.939141 & 7.9689 & 0 \tabularnewline
2 & 0.895385 & 7.5976 & 0 \tabularnewline
3 & 0.862409 & 7.3178 & 0 \tabularnewline
4 & 0.802588 & 6.8102 & 0 \tabularnewline
5 & 0.757759 & 6.4298 & 0 \tabularnewline
6 & 0.733251 & 6.2218 & 0 \tabularnewline
7 & 0.678892 & 5.7606 & 0 \tabularnewline
8 & 0.642109 & 5.4485 & 0 \tabularnewline
9 & 0.618111 & 5.2448 & 1e-06 \tabularnewline
10 & 0.568797 & 4.8264 & 4e-06 \tabularnewline
11 & 0.533073 & 4.5233 & 1.2e-05 \tabularnewline
12 & 0.509209 & 4.3208 & 2.4e-05 \tabularnewline
13 & 0.452017 & 3.8355 & 0.000133 \tabularnewline
14 & 0.408274 & 3.4643 & 0.00045 \tabularnewline
15 & 0.372065 & 3.1571 & 0.001164 \tabularnewline
16 & 0.313046 & 2.6563 & 0.004862 \tabularnewline
17 & 0.269239 & 2.2846 & 0.012644 \tabularnewline
18 & 0.242429 & 2.0571 & 0.021651 \tabularnewline
19 & 0.19216 & 1.6305 & 0.053678 \tabularnewline
20 & 0.157427 & 1.3358 & 0.092909 \tabularnewline
21 & 0.138009 & 1.171 & 0.122721 \tabularnewline
22 & 0.098529 & 0.836 & 0.202947 \tabularnewline
23 & 0.075847 & 0.6436 & 0.260945 \tabularnewline
24 & 0.05954 & 0.5052 & 0.307475 \tabularnewline
25 & 0.026409 & 0.2241 & 0.411662 \tabularnewline
26 & 0.000978 & 0.0083 & 0.4967 \tabularnewline
27 & -0.021393 & -0.1815 & 0.428232 \tabularnewline
28 & -0.061086 & -0.5183 & 0.302907 \tabularnewline
29 & -0.078198 & -0.6635 & 0.254556 \tabularnewline
30 & -0.086057 & -0.7302 & 0.233814 \tabularnewline
31 & -0.115694 & -0.9817 & 0.164769 \tabularnewline
32 & -0.128928 & -1.094 & 0.138802 \tabularnewline
33 & -0.137638 & -1.1679 & 0.123351 \tabularnewline
34 & -0.165511 & -1.4044 & 0.082248 \tabularnewline
35 & -0.17984 & -1.526 & 0.065696 \tabularnewline
36 & -0.190964 & -1.6204 & 0.054761 \tabularnewline
37 & -0.220558 & -1.8715 & 0.032669 \tabularnewline
38 & -0.236585 & -2.0075 & 0.024226 \tabularnewline
39 & -0.250794 & -2.1281 & 0.018378 \tabularnewline
40 & -0.281336 & -2.3872 & 0.009802 \tabularnewline
41 & -0.300234 & -2.5476 & 0.006492 \tabularnewline
42 & -0.314536 & -2.6689 & 0.004698 \tabularnewline
43 & -0.345793 & -2.9341 & 0.002242 \tabularnewline
44 & -0.3612 & -3.0649 & 0.001532 \tabularnewline
45 & -0.365246 & -3.0992 & 0.001384 \tabularnewline
46 & -0.38191 & -3.2406 & 0.000904 \tabularnewline
47 & -0.387089 & -3.2846 & 0.00079 \tabularnewline
48 & -0.397697 & -3.3746 & 0.000597 \tabularnewline
\hline
\end{tabular}
%Source: https://freestatistics.org/blog/index.php?pk=&T=1

[TABLE]
[ROW][C]Autocorrelation Function[/C][/ROW]
[ROW][C]Time lag k[/C][C]ACF(k)[/C][C]T-STAT[/C][C]P-value[/C][/ROW]
[ROW][C]1[/C][C]0.939141[/C][C]7.9689[/C][C]0[/C][/ROW]
[ROW][C]2[/C][C]0.895385[/C][C]7.5976[/C][C]0[/C][/ROW]
[ROW][C]3[/C][C]0.862409[/C][C]7.3178[/C][C]0[/C][/ROW]
[ROW][C]4[/C][C]0.802588[/C][C]6.8102[/C][C]0[/C][/ROW]
[ROW][C]5[/C][C]0.757759[/C][C]6.4298[/C][C]0[/C][/ROW]
[ROW][C]6[/C][C]0.733251[/C][C]6.2218[/C][C]0[/C][/ROW]
[ROW][C]7[/C][C]0.678892[/C][C]5.7606[/C][C]0[/C][/ROW]
[ROW][C]8[/C][C]0.642109[/C][C]5.4485[/C][C]0[/C][/ROW]
[ROW][C]9[/C][C]0.618111[/C][C]5.2448[/C][C]1e-06[/C][/ROW]
[ROW][C]10[/C][C]0.568797[/C][C]4.8264[/C][C]4e-06[/C][/ROW]
[ROW][C]11[/C][C]0.533073[/C][C]4.5233[/C][C]1.2e-05[/C][/ROW]
[ROW][C]12[/C][C]0.509209[/C][C]4.3208[/C][C]2.4e-05[/C][/ROW]
[ROW][C]13[/C][C]0.452017[/C][C]3.8355[/C][C]0.000133[/C][/ROW]
[ROW][C]14[/C][C]0.408274[/C][C]3.4643[/C][C]0.00045[/C][/ROW]
[ROW][C]15[/C][C]0.372065[/C][C]3.1571[/C][C]0.001164[/C][/ROW]
[ROW][C]16[/C][C]0.313046[/C][C]2.6563[/C][C]0.004862[/C][/ROW]
[ROW][C]17[/C][C]0.269239[/C][C]2.2846[/C][C]0.012644[/C][/ROW]
[ROW][C]18[/C][C]0.242429[/C][C]2.0571[/C][C]0.021651[/C][/ROW]
[ROW][C]19[/C][C]0.19216[/C][C]1.6305[/C][C]0.053678[/C][/ROW]
[ROW][C]20[/C][C]0.157427[/C][C]1.3358[/C][C]0.092909[/C][/ROW]
[ROW][C]21[/C][C]0.138009[/C][C]1.171[/C][C]0.122721[/C][/ROW]
[ROW][C]22[/C][C]0.098529[/C][C]0.836[/C][C]0.202947[/C][/ROW]
[ROW][C]23[/C][C]0.075847[/C][C]0.6436[/C][C]0.260945[/C][/ROW]
[ROW][C]24[/C][C]0.05954[/C][C]0.5052[/C][C]0.307475[/C][/ROW]
[ROW][C]25[/C][C]0.026409[/C][C]0.2241[/C][C]0.411662[/C][/ROW]
[ROW][C]26[/C][C]0.000978[/C][C]0.0083[/C][C]0.4967[/C][/ROW]
[ROW][C]27[/C][C]-0.021393[/C][C]-0.1815[/C][C]0.428232[/C][/ROW]
[ROW][C]28[/C][C]-0.061086[/C][C]-0.5183[/C][C]0.302907[/C][/ROW]
[ROW][C]29[/C][C]-0.078198[/C][C]-0.6635[/C][C]0.254556[/C][/ROW]
[ROW][C]30[/C][C]-0.086057[/C][C]-0.7302[/C][C]0.233814[/C][/ROW]
[ROW][C]31[/C][C]-0.115694[/C][C]-0.9817[/C][C]0.164769[/C][/ROW]
[ROW][C]32[/C][C]-0.128928[/C][C]-1.094[/C][C]0.138802[/C][/ROW]
[ROW][C]33[/C][C]-0.137638[/C][C]-1.1679[/C][C]0.123351[/C][/ROW]
[ROW][C]34[/C][C]-0.165511[/C][C]-1.4044[/C][C]0.082248[/C][/ROW]
[ROW][C]35[/C][C]-0.17984[/C][C]-1.526[/C][C]0.065696[/C][/ROW]
[ROW][C]36[/C][C]-0.190964[/C][C]-1.6204[/C][C]0.054761[/C][/ROW]
[ROW][C]37[/C][C]-0.220558[/C][C]-1.8715[/C][C]0.032669[/C][/ROW]
[ROW][C]38[/C][C]-0.236585[/C][C]-2.0075[/C][C]0.024226[/C][/ROW]
[ROW][C]39[/C][C]-0.250794[/C][C]-2.1281[/C][C]0.018378[/C][/ROW]
[ROW][C]40[/C][C]-0.281336[/C][C]-2.3872[/C][C]0.009802[/C][/ROW]
[ROW][C]41[/C][C]-0.300234[/C][C]-2.5476[/C][C]0.006492[/C][/ROW]
[ROW][C]42[/C][C]-0.314536[/C][C]-2.6689[/C][C]0.004698[/C][/ROW]
[ROW][C]43[/C][C]-0.345793[/C][C]-2.9341[/C][C]0.002242[/C][/ROW]
[ROW][C]44[/C][C]-0.3612[/C][C]-3.0649[/C][C]0.001532[/C][/ROW]
[ROW][C]45[/C][C]-0.365246[/C][C]-3.0992[/C][C]0.001384[/C][/ROW]
[ROW][C]46[/C][C]-0.38191[/C][C]-3.2406[/C][C]0.000904[/C][/ROW]
[ROW][C]47[/C][C]-0.387089[/C][C]-3.2846[/C][C]0.00079[/C][/ROW]
[ROW][C]48[/C][C]-0.397697[/C][C]-3.3746[/C][C]0.000597[/C][/ROW]
[/TABLE]
Source: https://freestatistics.org/blog/index.php?pk=&T=1

Globally Unique Identifier (entire table): ba.freestatistics.org/blog/index.php?pk=&T=1

As an alternative you can also use a QR Code:  

The GUIDs for individual cells are displayed in the table below:

Autocorrelation Function
Time lag kACF(k)T-STATP-value
10.9391417.96890
20.8953857.59760
30.8624097.31780
40.8025886.81020
50.7577596.42980
60.7332516.22180
70.6788925.76060
80.6421095.44850
90.6181115.24481e-06
100.5687974.82644e-06
110.5330734.52331.2e-05
120.5092094.32082.4e-05
130.4520173.83550.000133
140.4082743.46430.00045
150.3720653.15710.001164
160.3130462.65630.004862
170.2692392.28460.012644
180.2424292.05710.021651
190.192161.63050.053678
200.1574271.33580.092909
210.1380091.1710.122721
220.0985290.8360.202947
230.0758470.64360.260945
240.059540.50520.307475
250.0264090.22410.411662
260.0009780.00830.4967
27-0.021393-0.18150.428232
28-0.061086-0.51830.302907
29-0.078198-0.66350.254556
30-0.086057-0.73020.233814
31-0.115694-0.98170.164769
32-0.128928-1.0940.138802
33-0.137638-1.16790.123351
34-0.165511-1.40440.082248
35-0.17984-1.5260.065696
36-0.190964-1.62040.054761
37-0.220558-1.87150.032669
38-0.236585-2.00750.024226
39-0.250794-2.12810.018378
40-0.281336-2.38720.009802
41-0.300234-2.54760.006492
42-0.314536-2.66890.004698
43-0.345793-2.93410.002242
44-0.3612-3.06490.001532
45-0.365246-3.09920.001384
46-0.38191-3.24060.000904
47-0.387089-3.28460.00079
48-0.397697-3.37460.000597


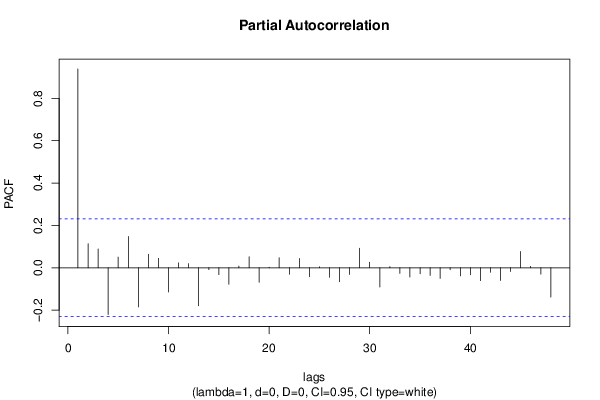
Partial Autocorrelation Function
Time lag kPACF(k)T-STATP-value
10.9391417.96890
20.1135350.96340.169292
30.0889480.75470.226431
4-0.221168-1.87670.032308
50.050280.42660.335457
60.1476761.25310.107116
7-0.18492-1.56910.060505
80.0639950.5430.294397
90.0443890.37670.35377
10-0.114425-0.97090.167418
110.0230350.19550.422793
120.0195780.16610.434261
13-0.179374-1.5220.066189
14-0.009029-0.07660.469572
15-0.032381-0.27480.392143
16-0.077732-0.65960.255814
170.0077010.06530.474041
180.0524220.44480.328894
19-0.068394-0.58030.281749
200.0021650.01840.492698
210.0472190.40070.344926
22-0.030539-0.25910.398138
230.0436590.37050.356064
24-0.042756-0.36280.358911
250.0046780.03970.484224
26-0.045032-0.38210.351752
27-0.06637-0.56320.287535
28-0.032155-0.27280.392876
290.0924250.78430.217732
300.0264350.22430.411577
31-0.091135-0.77330.220936
320.0054610.04630.481586
33-0.026515-0.2250.411313
34-0.04356-0.36960.356375
35-0.028717-0.24370.404089
36-0.036056-0.30590.380265
37-0.050114-0.42520.335968
38-0.009774-0.08290.467066
39-0.03842-0.3260.372683
40-0.033379-0.28320.388906
41-0.060732-0.51530.303952
42-0.021507-0.18250.427856
43-0.059885-0.50810.306454
44-0.017709-0.15030.440488
450.0769910.65330.257826
460.0066080.05610.477719
47-0.030287-0.2570.398958
48-0.138643-1.17640.121651

\begin{tabular}{lllllllll}
\hline
Partial Autocorrelation Function \tabularnewline
Time lag k & PACF(k) & T-STAT & P-value \tabularnewline
1 & 0.939141 & 7.9689 & 0 \tabularnewline
2 & 0.113535 & 0.9634 & 0.169292 \tabularnewline
3 & 0.088948 & 0.7547 & 0.226431 \tabularnewline
4 & -0.221168 & -1.8767 & 0.032308 \tabularnewline
5 & 0.05028 & 0.4266 & 0.335457 \tabularnewline
6 & 0.147676 & 1.2531 & 0.107116 \tabularnewline
7 & -0.18492 & -1.5691 & 0.060505 \tabularnewline
8 & 0.063995 & 0.543 & 0.294397 \tabularnewline
9 & 0.044389 & 0.3767 & 0.35377 \tabularnewline
10 & -0.114425 & -0.9709 & 0.167418 \tabularnewline
11 & 0.023035 & 0.1955 & 0.422793 \tabularnewline
12 & 0.019578 & 0.1661 & 0.434261 \tabularnewline
13 & -0.179374 & -1.522 & 0.066189 \tabularnewline
14 & -0.009029 & -0.0766 & 0.469572 \tabularnewline
15 & -0.032381 & -0.2748 & 0.392143 \tabularnewline
16 & -0.077732 & -0.6596 & 0.255814 \tabularnewline
17 & 0.007701 & 0.0653 & 0.474041 \tabularnewline
18 & 0.052422 & 0.4448 & 0.328894 \tabularnewline
19 & -0.068394 & -0.5803 & 0.281749 \tabularnewline
20 & 0.002165 & 0.0184 & 0.492698 \tabularnewline
21 & 0.047219 & 0.4007 & 0.344926 \tabularnewline
22 & -0.030539 & -0.2591 & 0.398138 \tabularnewline
23 & 0.043659 & 0.3705 & 0.356064 \tabularnewline
24 & -0.042756 & -0.3628 & 0.358911 \tabularnewline
25 & 0.004678 & 0.0397 & 0.484224 \tabularnewline
26 & -0.045032 & -0.3821 & 0.351752 \tabularnewline
27 & -0.06637 & -0.5632 & 0.287535 \tabularnewline
28 & -0.032155 & -0.2728 & 0.392876 \tabularnewline
29 & 0.092425 & 0.7843 & 0.217732 \tabularnewline
30 & 0.026435 & 0.2243 & 0.411577 \tabularnewline
31 & -0.091135 & -0.7733 & 0.220936 \tabularnewline
32 & 0.005461 & 0.0463 & 0.481586 \tabularnewline
33 & -0.026515 & -0.225 & 0.411313 \tabularnewline
34 & -0.04356 & -0.3696 & 0.356375 \tabularnewline
35 & -0.028717 & -0.2437 & 0.404089 \tabularnewline
36 & -0.036056 & -0.3059 & 0.380265 \tabularnewline
37 & -0.050114 & -0.4252 & 0.335968 \tabularnewline
38 & -0.009774 & -0.0829 & 0.467066 \tabularnewline
39 & -0.03842 & -0.326 & 0.372683 \tabularnewline
40 & -0.033379 & -0.2832 & 0.388906 \tabularnewline
41 & -0.060732 & -0.5153 & 0.303952 \tabularnewline
42 & -0.021507 & -0.1825 & 0.427856 \tabularnewline
43 & -0.059885 & -0.5081 & 0.306454 \tabularnewline
44 & -0.017709 & -0.1503 & 0.440488 \tabularnewline
45 & 0.076991 & 0.6533 & 0.257826 \tabularnewline
46 & 0.006608 & 0.0561 & 0.477719 \tabularnewline
47 & -0.030287 & -0.257 & 0.398958 \tabularnewline
48 & -0.138643 & -1.1764 & 0.121651 \tabularnewline
\hline
\end{tabular}
%Source: https://freestatistics.org/blog/index.php?pk=&T=2

[TABLE]
[ROW][C]Partial Autocorrelation Function[/C][/ROW]
[ROW][C]Time lag k[/C][C]PACF(k)[/C][C]T-STAT[/C][C]P-value[/C][/ROW]
[ROW][C]1[/C][C]0.939141[/C][C]7.9689[/C][C]0[/C][/ROW]
[ROW][C]2[/C][C]0.113535[/C][C]0.9634[/C][C]0.169292[/C][/ROW]
[ROW][C]3[/C][C]0.088948[/C][C]0.7547[/C][C]0.226431[/C][/ROW]
[ROW][C]4[/C][C]-0.221168[/C][C]-1.8767[/C][C]0.032308[/C][/ROW]
[ROW][C]5[/C][C]0.05028[/C][C]0.4266[/C][C]0.335457[/C][/ROW]
[ROW][C]6[/C][C]0.147676[/C][C]1.2531[/C][C]0.107116[/C][/ROW]
[ROW][C]7[/C][C]-0.18492[/C][C]-1.5691[/C][C]0.060505[/C][/ROW]
[ROW][C]8[/C][C]0.063995[/C][C]0.543[/C][C]0.294397[/C][/ROW]
[ROW][C]9[/C][C]0.044389[/C][C]0.3767[/C][C]0.35377[/C][/ROW]
[ROW][C]10[/C][C]-0.114425[/C][C]-0.9709[/C][C]0.167418[/C][/ROW]
[ROW][C]11[/C][C]0.023035[/C][C]0.1955[/C][C]0.422793[/C][/ROW]
[ROW][C]12[/C][C]0.019578[/C][C]0.1661[/C][C]0.434261[/C][/ROW]
[ROW][C]13[/C][C]-0.179374[/C][C]-1.522[/C][C]0.066189[/C][/ROW]
[ROW][C]14[/C][C]-0.009029[/C][C]-0.0766[/C][C]0.469572[/C][/ROW]
[ROW][C]15[/C][C]-0.032381[/C][C]-0.2748[/C][C]0.392143[/C][/ROW]
[ROW][C]16[/C][C]-0.077732[/C][C]-0.6596[/C][C]0.255814[/C][/ROW]
[ROW][C]17[/C][C]0.007701[/C][C]0.0653[/C][C]0.474041[/C][/ROW]
[ROW][C]18[/C][C]0.052422[/C][C]0.4448[/C][C]0.328894[/C][/ROW]
[ROW][C]19[/C][C]-0.068394[/C][C]-0.5803[/C][C]0.281749[/C][/ROW]
[ROW][C]20[/C][C]0.002165[/C][C]0.0184[/C][C]0.492698[/C][/ROW]
[ROW][C]21[/C][C]0.047219[/C][C]0.4007[/C][C]0.344926[/C][/ROW]
[ROW][C]22[/C][C]-0.030539[/C][C]-0.2591[/C][C]0.398138[/C][/ROW]
[ROW][C]23[/C][C]0.043659[/C][C]0.3705[/C][C]0.356064[/C][/ROW]
[ROW][C]24[/C][C]-0.042756[/C][C]-0.3628[/C][C]0.358911[/C][/ROW]
[ROW][C]25[/C][C]0.004678[/C][C]0.0397[/C][C]0.484224[/C][/ROW]
[ROW][C]26[/C][C]-0.045032[/C][C]-0.3821[/C][C]0.351752[/C][/ROW]
[ROW][C]27[/C][C]-0.06637[/C][C]-0.5632[/C][C]0.287535[/C][/ROW]
[ROW][C]28[/C][C]-0.032155[/C][C]-0.2728[/C][C]0.392876[/C][/ROW]
[ROW][C]29[/C][C]0.092425[/C][C]0.7843[/C][C]0.217732[/C][/ROW]
[ROW][C]30[/C][C]0.026435[/C][C]0.2243[/C][C]0.411577[/C][/ROW]
[ROW][C]31[/C][C]-0.091135[/C][C]-0.7733[/C][C]0.220936[/C][/ROW]
[ROW][C]32[/C][C]0.005461[/C][C]0.0463[/C][C]0.481586[/C][/ROW]
[ROW][C]33[/C][C]-0.026515[/C][C]-0.225[/C][C]0.411313[/C][/ROW]
[ROW][C]34[/C][C]-0.04356[/C][C]-0.3696[/C][C]0.356375[/C][/ROW]
[ROW][C]35[/C][C]-0.028717[/C][C]-0.2437[/C][C]0.404089[/C][/ROW]
[ROW][C]36[/C][C]-0.036056[/C][C]-0.3059[/C][C]0.380265[/C][/ROW]
[ROW][C]37[/C][C]-0.050114[/C][C]-0.4252[/C][C]0.335968[/C][/ROW]
[ROW][C]38[/C][C]-0.009774[/C][C]-0.0829[/C][C]0.467066[/C][/ROW]
[ROW][C]39[/C][C]-0.03842[/C][C]-0.326[/C][C]0.372683[/C][/ROW]
[ROW][C]40[/C][C]-0.033379[/C][C]-0.2832[/C][C]0.388906[/C][/ROW]
[ROW][C]41[/C][C]-0.060732[/C][C]-0.5153[/C][C]0.303952[/C][/ROW]
[ROW][C]42[/C][C]-0.021507[/C][C]-0.1825[/C][C]0.427856[/C][/ROW]
[ROW][C]43[/C][C]-0.059885[/C][C]-0.5081[/C][C]0.306454[/C][/ROW]
[ROW][C]44[/C][C]-0.017709[/C][C]-0.1503[/C][C]0.440488[/C][/ROW]
[ROW][C]45[/C][C]0.076991[/C][C]0.6533[/C][C]0.257826[/C][/ROW]
[ROW][C]46[/C][C]0.006608[/C][C]0.0561[/C][C]0.477719[/C][/ROW]
[ROW][C]47[/C][C]-0.030287[/C][C]-0.257[/C][C]0.398958[/C][/ROW]
[ROW][C]48[/C][C]-0.138643[/C][C]-1.1764[/C][C]0.121651[/C][/ROW]
[/TABLE]
Source: https://freestatistics.org/blog/index.php?pk=&T=2

Globally Unique Identifier (entire table): ba.freestatistics.org/blog/index.php?pk=&T=2

As an alternative you can also use a QR Code:  

The GUIDs for individual cells are displayed in the table below:

Partial Autocorrelation Function
Time lag kPACF(k)T-STATP-value
10.9391417.96890
20.1135350.96340.169292
30.0889480.75470.226431
4-0.221168-1.87670.032308
50.050280.42660.335457
60.1476761.25310.107116
7-0.18492-1.56910.060505
80.0639950.5430.294397
90.0443890.37670.35377
10-0.114425-0.97090.167418
110.0230350.19550.422793
120.0195780.16610.434261
13-0.179374-1.5220.066189
14-0.009029-0.07660.469572
15-0.032381-0.27480.392143
16-0.077732-0.65960.255814
170.0077010.06530.474041
180.0524220.44480.328894
19-0.068394-0.58030.281749
200.0021650.01840.492698
210.0472190.40070.344926
22-0.030539-0.25910.398138
230.0436590.37050.356064
24-0.042756-0.36280.358911
250.0046780.03970.484224
26-0.045032-0.38210.351752
27-0.06637-0.56320.287535
28-0.032155-0.27280.392876
290.0924250.78430.217732
300.0264350.22430.411577
31-0.091135-0.77330.220936
320.0054610.04630.481586
33-0.026515-0.2250.411313
34-0.04356-0.36960.356375
35-0.028717-0.24370.404089
36-0.036056-0.30590.380265
37-0.050114-0.42520.335968
38-0.009774-0.08290.467066
39-0.03842-0.3260.372683
40-0.033379-0.28320.388906
41-0.060732-0.51530.303952
42-0.021507-0.18250.427856
43-0.059885-0.50810.306454
44-0.017709-0.15030.440488
450.0769910.65330.257826
460.0066080.05610.477719
47-0.030287-0.2570.398958
48-0.138643-1.17640.121651


Parameters (Session):
par1 = 48 ; par2 = 1 ; par3 = 0 ; par4 = 0 ; par5 = 12 ; par6 = White Noise ; par7 = 0.95 ;
Parameters (R input):
par1 = 48 ; par2 = 1 ; par3 = 0 ; par4 = 0 ; par5 = 12 ; par6 = White Noise ; par7 = 0.95 ; par8 = ;
R code (references can be found in the software module):
if (par1 == 'Default') {
par1 = 10*log10(length(x))
} else {
par1 <- as.numeric(par1)
}
par2 <- as.numeric(par2)
par3 <- as.numeric(par3)
par4 <- as.numeric(par4)
par5 <- as.numeric(par5)
if (par6 == 'White Noise') par6 <- 'white' else par6 <- 'ma'
par7 <- as.numeric(par7)
if (par8 != '') par8 <- as.numeric(par8)
x <- na.omit(x)
ox <- x
if (par8 == '') {
if (par2 == 0) {
x <- log(x)
} else {
x <- (x ^ par2 - 1) / par2
}
} else {
x <- log(x,base=par8)
}
if (par3 > 0) x <- diff(x,lag=1,difference=par3)
if (par4 > 0) x <- diff(x,lag=par5,difference=par4)
bitmap(file='picts.png')
op <- par(mfrow=c(2,1))
plot(ox,type='l',main='Original Time Series',xlab='time',ylab='value')
if (par8=='') {
mytitle <- paste('Working Time Series (lambda=',par2,', d=',par3,', D=',par4,')',sep='')
mysub <- paste('(lambda=',par2,', d=',par3,', D=',par4,', CI=', par7, ', CI type=',par6,')',sep='')
} else {
mytitle <- paste('Working Time Series (base=',par8,', d=',par3,', D=',par4,')',sep='')
mysub <- paste('(base=',par8,', d=',par3,', D=',par4,', CI=', par7, ', CI type=',par6,')',sep='')
}
plot(x,type='l', main=mytitle,xlab='time',ylab='value')
par(op)
dev.off()
bitmap(file='pic1.png')
racf <- acf(x, par1, main='Autocorrelation', xlab='time lag', ylab='ACF', ci.type=par6, ci=par7, sub=mysub)
dev.off()
bitmap(file='pic2.png')
rpacf <- pacf(x,par1,main='Partial Autocorrelation',xlab='lags',ylab='PACF',sub=mysub)
dev.off()
(myacf <- c(racf$acf))
(mypacf <- c(rpacf$acf))
lengthx <- length(x)
sqrtn <- sqrt(lengthx)
load(file='createtable')
a<-table.start()
a<-table.row.start(a)
a<-table.element(a,'Autocorrelation Function',4,TRUE)
a<-table.row.end(a)
a<-table.row.start(a)
a<-table.element(a,'Time lag k',header=TRUE)
a<-table.element(a,hyperlink('basics.htm','ACF(k)','click here for more information about the Autocorrelation Function'),header=TRUE)
a<-table.element(a,'T-STAT',header=TRUE)
a<-table.element(a,'P-value',header=TRUE)
a<-table.row.end(a)
for (i in 2:(par1+1)) {
a<-table.row.start(a)
a<-table.element(a,i-1,header=TRUE)
a<-table.element(a,round(myacf[i],6))
mytstat <- myacf[i]*sqrtn
a<-table.element(a,round(mytstat,4))
a<-table.element(a,round(1-pt(abs(mytstat),lengthx),6))
a<-table.row.end(a)
}
a<-table.end(a)
table.save(a,file='mytable.tab')
a<-table.start()
a<-table.row.start(a)
a<-table.element(a,'Partial Autocorrelation Function',4,TRUE)
a<-table.row.end(a)
a<-table.row.start(a)
a<-table.element(a,'Time lag k',header=TRUE)
a<-table.element(a,hyperlink('basics.htm','PACF(k)','click here for more information about the Partial Autocorrelation Function'),header=TRUE)
a<-table.element(a,'T-STAT',header=TRUE)
a<-table.element(a,'P-value',header=TRUE)
a<-table.row.end(a)
for (i in 1:par1) {
a<-table.row.start(a)
a<-table.element(a,i,header=TRUE)
a<-table.element(a,round(mypacf[i],6))
mytstat <- mypacf[i]*sqrtn
a<-table.element(a,round(mytstat,4))
a<-table.element(a,round(1-pt(abs(mytstat),lengthx),6))
a<-table.row.end(a)
}
a<-table.end(a)
table.save(a,file='mytable1.tab')