Free Statistics

of Irreproducible Research!

Author's title

Author*Unverified author*
R Software Modulerwasp_autocorrelation.wasp
Title produced by software(Partial) Autocorrelation Function
Date of computationTue, 18 Oct 2016 20:48:55 +0100
Cite this page as followsStatistical Computations at FreeStatistics.org, Office for Research Development and Education, URL https://freestatistics.org/blog/index.php?v=date/2016/Oct/18/t1476820166wm1v8jvwk68dica.htm/, Retrieved Sun, 28 Apr 2024 13:52:41 +0200
Statistical Computations at FreeStatistics.org, Office for Research Development and Education, URL https://freestatistics.org/blog/index.php?pk=, Retrieved Sun, 28 Apr 2024 13:52:41 +0200
QR Codes:

Original text written by user:
IsPrivate?No (this computation is public)
User-defined keywords
Estimated Impact0
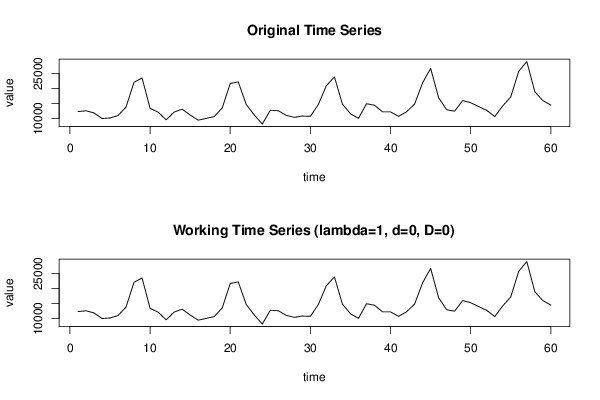
Dataseries X:
12347
12624
11918
10028
10228
11026
13878
22165
23533
13445
12164
9606
12177
13142
11210
9485
10082
10680
13579
21709
22205
14687
11222
8196
12794
12627
11080
10425
10865
10771
14771
20993
23882
14825
11648
10091
14976
14472
12254
12257
10767
12275
14845
21939
26740
16974
12956
12494
16024
15306
13989
12792
10697
14257
17251
25795
29016
18968
16009
14511


Summary of computational transaction
Raw Inputview raw input (R code)
Raw Outputview raw output of R engine
Computing time1 seconds
R Server'Sir Ronald Aylmer Fisher' @ fisher.wessa.net

\begin{tabular}{lllllllll}
\hline
Summary of computational transaction \tabularnewline
Raw Input & view raw input (R code)  \tabularnewline
Raw Output & view raw output of R engine  \tabularnewline
Computing time & 1 seconds \tabularnewline
R Server & 'Sir Ronald Aylmer Fisher' @ fisher.wessa.net \tabularnewline
\hline
\end{tabular}
%Source: https://freestatistics.org/blog/index.php?pk=&T=0

[TABLE]
[ROW][C]Summary of computational transaction[/C][/ROW]
[ROW][C]Raw Input[/C][C]view raw input (R code) [/C][/ROW]
[ROW][C]Raw Output[/C][C]view raw output of R engine [/C][/ROW]
[ROW][C]Computing time[/C][C]1 seconds[/C][/ROW]
[ROW][C]R Server[/C][C]'Sir Ronald Aylmer Fisher' @ fisher.wessa.net[/C][/ROW]
[/TABLE]
Source: https://freestatistics.org/blog/index.php?pk=&T=0

Globally Unique Identifier (entire table): ba.freestatistics.org/blog/index.php?pk=&T=0

As an alternative you can also use a QR Code:  

The GUIDs for individual cells are displayed in the table below:

Summary of computational transaction
Raw Inputview raw input (R code)
Raw Outputview raw output of R engine
Computing time1 seconds
R Server'Sir Ronald Aylmer Fisher' @ fisher.wessa.net


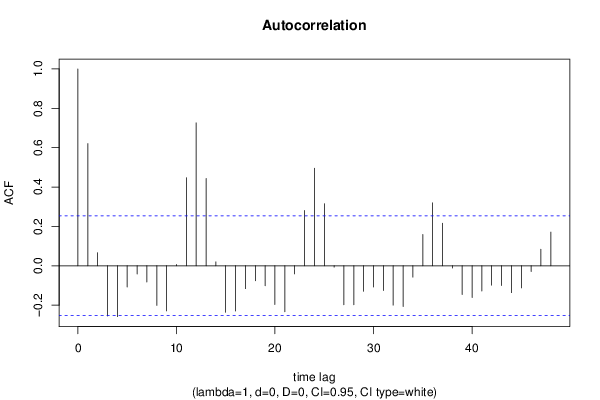
Autocorrelation Function
Time lag kACF(k)T-STATP-value
10.6206824.80785e-06
20.0662880.51350.304756
3-0.255023-1.97540.026414
4-0.258465-2.00210.024902
5-0.107484-0.83260.204195
6-0.041972-0.32510.373114
7-0.082158-0.63640.263471
8-0.201403-1.56010.062003
9-0.229047-1.77420.040553
100.006150.04760.48108
110.4476163.46720.000489
120.7259795.62340
130.4437083.43690.000537
140.0197410.15290.439491
15-0.236029-1.82830.03624
16-0.22956-1.77820.040222
17-0.116188-0.90.185862
18-0.076394-0.59170.278122
19-0.101649-0.78740.217081
20-0.19672-1.52380.066408
21-0.233982-1.81240.037463
22-0.041103-0.31840.37565
230.2811272.17760.016689
240.4959653.84170.000149
250.3155232.4440.008741
26-0.006939-0.05370.478657
27-0.1984-1.53680.0648
28-0.198296-1.5360.064899
29-0.129616-1.0040.159704
30-0.108168-0.83790.202716
31-0.125289-0.97050.167851
32-0.200052-1.54960.063249
33-0.206866-1.60240.057162
34-0.057629-0.44640.32846
350.1586111.22860.11201
360.3198212.47730.008036
370.2158051.67160.049904
38-0.011662-0.09030.464163
39-0.146061-1.13140.131198
40-0.161356-1.24990.108102
41-0.128521-0.99550.161741
42-0.098343-0.76180.224593
43-0.100209-0.77620.220335
44-0.136526-1.05750.147255
45-0.112229-0.86930.194068
46-0.029209-0.22620.410889
470.0836430.64790.259762
480.1710531.3250.095103

\begin{tabular}{lllllllll}
\hline
Autocorrelation Function \tabularnewline
Time lag k & ACF(k) & T-STAT & P-value \tabularnewline
1 & 0.620682 & 4.8078 & 5e-06 \tabularnewline
2 & 0.066288 & 0.5135 & 0.304756 \tabularnewline
3 & -0.255023 & -1.9754 & 0.026414 \tabularnewline
4 & -0.258465 & -2.0021 & 0.024902 \tabularnewline
5 & -0.107484 & -0.8326 & 0.204195 \tabularnewline
6 & -0.041972 & -0.3251 & 0.373114 \tabularnewline
7 & -0.082158 & -0.6364 & 0.263471 \tabularnewline
8 & -0.201403 & -1.5601 & 0.062003 \tabularnewline
9 & -0.229047 & -1.7742 & 0.040553 \tabularnewline
10 & 0.00615 & 0.0476 & 0.48108 \tabularnewline
11 & 0.447616 & 3.4672 & 0.000489 \tabularnewline
12 & 0.725979 & 5.6234 & 0 \tabularnewline
13 & 0.443708 & 3.4369 & 0.000537 \tabularnewline
14 & 0.019741 & 0.1529 & 0.439491 \tabularnewline
15 & -0.236029 & -1.8283 & 0.03624 \tabularnewline
16 & -0.22956 & -1.7782 & 0.040222 \tabularnewline
17 & -0.116188 & -0.9 & 0.185862 \tabularnewline
18 & -0.076394 & -0.5917 & 0.278122 \tabularnewline
19 & -0.101649 & -0.7874 & 0.217081 \tabularnewline
20 & -0.19672 & -1.5238 & 0.066408 \tabularnewline
21 & -0.233982 & -1.8124 & 0.037463 \tabularnewline
22 & -0.041103 & -0.3184 & 0.37565 \tabularnewline
23 & 0.281127 & 2.1776 & 0.016689 \tabularnewline
24 & 0.495965 & 3.8417 & 0.000149 \tabularnewline
25 & 0.315523 & 2.444 & 0.008741 \tabularnewline
26 & -0.006939 & -0.0537 & 0.478657 \tabularnewline
27 & -0.1984 & -1.5368 & 0.0648 \tabularnewline
28 & -0.198296 & -1.536 & 0.064899 \tabularnewline
29 & -0.129616 & -1.004 & 0.159704 \tabularnewline
30 & -0.108168 & -0.8379 & 0.202716 \tabularnewline
31 & -0.125289 & -0.9705 & 0.167851 \tabularnewline
32 & -0.200052 & -1.5496 & 0.063249 \tabularnewline
33 & -0.206866 & -1.6024 & 0.057162 \tabularnewline
34 & -0.057629 & -0.4464 & 0.32846 \tabularnewline
35 & 0.158611 & 1.2286 & 0.11201 \tabularnewline
36 & 0.319821 & 2.4773 & 0.008036 \tabularnewline
37 & 0.215805 & 1.6716 & 0.049904 \tabularnewline
38 & -0.011662 & -0.0903 & 0.464163 \tabularnewline
39 & -0.146061 & -1.1314 & 0.131198 \tabularnewline
40 & -0.161356 & -1.2499 & 0.108102 \tabularnewline
41 & -0.128521 & -0.9955 & 0.161741 \tabularnewline
42 & -0.098343 & -0.7618 & 0.224593 \tabularnewline
43 & -0.100209 & -0.7762 & 0.220335 \tabularnewline
44 & -0.136526 & -1.0575 & 0.147255 \tabularnewline
45 & -0.112229 & -0.8693 & 0.194068 \tabularnewline
46 & -0.029209 & -0.2262 & 0.410889 \tabularnewline
47 & 0.083643 & 0.6479 & 0.259762 \tabularnewline
48 & 0.171053 & 1.325 & 0.095103 \tabularnewline
\hline
\end{tabular}
%Source: https://freestatistics.org/blog/index.php?pk=&T=1

[TABLE]
[ROW][C]Autocorrelation Function[/C][/ROW]
[ROW][C]Time lag k[/C][C]ACF(k)[/C][C]T-STAT[/C][C]P-value[/C][/ROW]
[ROW][C]1[/C][C]0.620682[/C][C]4.8078[/C][C]5e-06[/C][/ROW]
[ROW][C]2[/C][C]0.066288[/C][C]0.5135[/C][C]0.304756[/C][/ROW]
[ROW][C]3[/C][C]-0.255023[/C][C]-1.9754[/C][C]0.026414[/C][/ROW]
[ROW][C]4[/C][C]-0.258465[/C][C]-2.0021[/C][C]0.024902[/C][/ROW]
[ROW][C]5[/C][C]-0.107484[/C][C]-0.8326[/C][C]0.204195[/C][/ROW]
[ROW][C]6[/C][C]-0.041972[/C][C]-0.3251[/C][C]0.373114[/C][/ROW]
[ROW][C]7[/C][C]-0.082158[/C][C]-0.6364[/C][C]0.263471[/C][/ROW]
[ROW][C]8[/C][C]-0.201403[/C][C]-1.5601[/C][C]0.062003[/C][/ROW]
[ROW][C]9[/C][C]-0.229047[/C][C]-1.7742[/C][C]0.040553[/C][/ROW]
[ROW][C]10[/C][C]0.00615[/C][C]0.0476[/C][C]0.48108[/C][/ROW]
[ROW][C]11[/C][C]0.447616[/C][C]3.4672[/C][C]0.000489[/C][/ROW]
[ROW][C]12[/C][C]0.725979[/C][C]5.6234[/C][C]0[/C][/ROW]
[ROW][C]13[/C][C]0.443708[/C][C]3.4369[/C][C]0.000537[/C][/ROW]
[ROW][C]14[/C][C]0.019741[/C][C]0.1529[/C][C]0.439491[/C][/ROW]
[ROW][C]15[/C][C]-0.236029[/C][C]-1.8283[/C][C]0.03624[/C][/ROW]
[ROW][C]16[/C][C]-0.22956[/C][C]-1.7782[/C][C]0.040222[/C][/ROW]
[ROW][C]17[/C][C]-0.116188[/C][C]-0.9[/C][C]0.185862[/C][/ROW]
[ROW][C]18[/C][C]-0.076394[/C][C]-0.5917[/C][C]0.278122[/C][/ROW]
[ROW][C]19[/C][C]-0.101649[/C][C]-0.7874[/C][C]0.217081[/C][/ROW]
[ROW][C]20[/C][C]-0.19672[/C][C]-1.5238[/C][C]0.066408[/C][/ROW]
[ROW][C]21[/C][C]-0.233982[/C][C]-1.8124[/C][C]0.037463[/C][/ROW]
[ROW][C]22[/C][C]-0.041103[/C][C]-0.3184[/C][C]0.37565[/C][/ROW]
[ROW][C]23[/C][C]0.281127[/C][C]2.1776[/C][C]0.016689[/C][/ROW]
[ROW][C]24[/C][C]0.495965[/C][C]3.8417[/C][C]0.000149[/C][/ROW]
[ROW][C]25[/C][C]0.315523[/C][C]2.444[/C][C]0.008741[/C][/ROW]
[ROW][C]26[/C][C]-0.006939[/C][C]-0.0537[/C][C]0.478657[/C][/ROW]
[ROW][C]27[/C][C]-0.1984[/C][C]-1.5368[/C][C]0.0648[/C][/ROW]
[ROW][C]28[/C][C]-0.198296[/C][C]-1.536[/C][C]0.064899[/C][/ROW]
[ROW][C]29[/C][C]-0.129616[/C][C]-1.004[/C][C]0.159704[/C][/ROW]
[ROW][C]30[/C][C]-0.108168[/C][C]-0.8379[/C][C]0.202716[/C][/ROW]
[ROW][C]31[/C][C]-0.125289[/C][C]-0.9705[/C][C]0.167851[/C][/ROW]
[ROW][C]32[/C][C]-0.200052[/C][C]-1.5496[/C][C]0.063249[/C][/ROW]
[ROW][C]33[/C][C]-0.206866[/C][C]-1.6024[/C][C]0.057162[/C][/ROW]
[ROW][C]34[/C][C]-0.057629[/C][C]-0.4464[/C][C]0.32846[/C][/ROW]
[ROW][C]35[/C][C]0.158611[/C][C]1.2286[/C][C]0.11201[/C][/ROW]
[ROW][C]36[/C][C]0.319821[/C][C]2.4773[/C][C]0.008036[/C][/ROW]
[ROW][C]37[/C][C]0.215805[/C][C]1.6716[/C][C]0.049904[/C][/ROW]
[ROW][C]38[/C][C]-0.011662[/C][C]-0.0903[/C][C]0.464163[/C][/ROW]
[ROW][C]39[/C][C]-0.146061[/C][C]-1.1314[/C][C]0.131198[/C][/ROW]
[ROW][C]40[/C][C]-0.161356[/C][C]-1.2499[/C][C]0.108102[/C][/ROW]
[ROW][C]41[/C][C]-0.128521[/C][C]-0.9955[/C][C]0.161741[/C][/ROW]
[ROW][C]42[/C][C]-0.098343[/C][C]-0.7618[/C][C]0.224593[/C][/ROW]
[ROW][C]43[/C][C]-0.100209[/C][C]-0.7762[/C][C]0.220335[/C][/ROW]
[ROW][C]44[/C][C]-0.136526[/C][C]-1.0575[/C][C]0.147255[/C][/ROW]
[ROW][C]45[/C][C]-0.112229[/C][C]-0.8693[/C][C]0.194068[/C][/ROW]
[ROW][C]46[/C][C]-0.029209[/C][C]-0.2262[/C][C]0.410889[/C][/ROW]
[ROW][C]47[/C][C]0.083643[/C][C]0.6479[/C][C]0.259762[/C][/ROW]
[ROW][C]48[/C][C]0.171053[/C][C]1.325[/C][C]0.095103[/C][/ROW]
[/TABLE]
Source: https://freestatistics.org/blog/index.php?pk=&T=1

Globally Unique Identifier (entire table): ba.freestatistics.org/blog/index.php?pk=&T=1

As an alternative you can also use a QR Code:  

The GUIDs for individual cells are displayed in the table below:

Autocorrelation Function
Time lag kACF(k)T-STATP-value
10.6206824.80785e-06
20.0662880.51350.304756
3-0.255023-1.97540.026414
4-0.258465-2.00210.024902
5-0.107484-0.83260.204195
6-0.041972-0.32510.373114
7-0.082158-0.63640.263471
8-0.201403-1.56010.062003
9-0.229047-1.77420.040553
100.006150.04760.48108
110.4476163.46720.000489
120.7259795.62340
130.4437083.43690.000537
140.0197410.15290.439491
15-0.236029-1.82830.03624
16-0.22956-1.77820.040222
17-0.116188-0.90.185862
18-0.076394-0.59170.278122
19-0.101649-0.78740.217081
20-0.19672-1.52380.066408
21-0.233982-1.81240.037463
22-0.041103-0.31840.37565
230.2811272.17760.016689
240.4959653.84170.000149
250.3155232.4440.008741
26-0.006939-0.05370.478657
27-0.1984-1.53680.0648
28-0.198296-1.5360.064899
29-0.129616-1.0040.159704
30-0.108168-0.83790.202716
31-0.125289-0.97050.167851
32-0.200052-1.54960.063249
33-0.206866-1.60240.057162
34-0.057629-0.44640.32846
350.1586111.22860.11201
360.3198212.47730.008036
370.2158051.67160.049904
38-0.011662-0.09030.464163
39-0.146061-1.13140.131198
40-0.161356-1.24990.108102
41-0.128521-0.99550.161741
42-0.098343-0.76180.224593
43-0.100209-0.77620.220335
44-0.136526-1.05750.147255
45-0.112229-0.86930.194068
46-0.029209-0.22620.410889
470.0836430.64790.259762
480.1710531.3250.095103


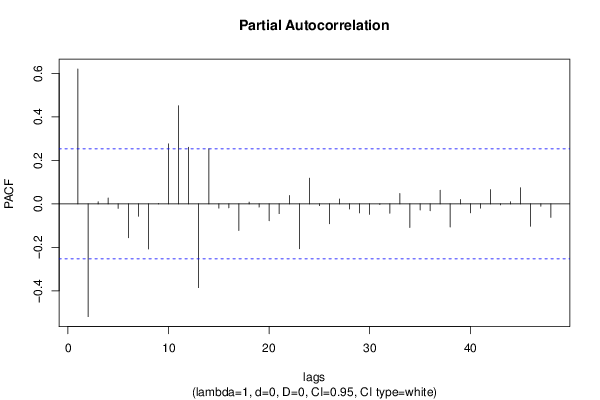
Partial Autocorrelation Function
Time lag kPACF(k)T-STATP-value
10.6206824.80785e-06
2-0.518838-4.01898.3e-05
30.0100590.07790.469077
40.0268420.20790.417997
5-0.020727-0.16060.436492
6-0.155738-1.20630.116211
7-0.057378-0.44440.329159
8-0.208004-1.61120.056193
90.0008240.00640.497463
100.2761682.13920.01825
110.4517843.49950.000443
120.2602842.01620.024134
13-0.385282-2.98440.002053
140.2536861.9650.027022
15-0.019786-0.15330.439354
16-0.018308-0.14180.443851
17-0.122404-0.94810.173431
180.0082190.06370.474725
19-0.014869-0.11520.454347
20-0.077688-0.60180.274797
21-0.044965-0.34830.364417
220.0382980.29670.383876
23-0.206685-1.6010.057318
240.1183320.91660.181513
25-0.008204-0.06350.474772
26-0.091705-0.71030.240121
270.0225460.17460.430975
28-0.023982-0.18580.426629
29-0.041621-0.32240.374136
30-0.048401-0.37490.354525
31-0.003035-0.02350.49066
32-0.04301-0.33320.370089
330.0476110.36880.356791
34-0.108704-0.8420.201561
35-0.028068-0.21740.414312
36-0.031533-0.24430.403933
370.0628810.48710.313991
38-0.106397-0.82410.20656
390.0203480.15760.437644
40-0.041326-0.32010.374999
41-0.01955-0.15140.440071
420.0655010.50740.306877
43-0.004767-0.03690.485334
440.0099570.07710.469389
450.074420.57650.283231
46-0.102748-0.79590.214618
47-0.011355-0.0880.465102
48-0.062256-0.48220.315698

\begin{tabular}{lllllllll}
\hline
Partial Autocorrelation Function \tabularnewline
Time lag k & PACF(k) & T-STAT & P-value \tabularnewline
1 & 0.620682 & 4.8078 & 5e-06 \tabularnewline
2 & -0.518838 & -4.0189 & 8.3e-05 \tabularnewline
3 & 0.010059 & 0.0779 & 0.469077 \tabularnewline
4 & 0.026842 & 0.2079 & 0.417997 \tabularnewline
5 & -0.020727 & -0.1606 & 0.436492 \tabularnewline
6 & -0.155738 & -1.2063 & 0.116211 \tabularnewline
7 & -0.057378 & -0.4444 & 0.329159 \tabularnewline
8 & -0.208004 & -1.6112 & 0.056193 \tabularnewline
9 & 0.000824 & 0.0064 & 0.497463 \tabularnewline
10 & 0.276168 & 2.1392 & 0.01825 \tabularnewline
11 & 0.451784 & 3.4995 & 0.000443 \tabularnewline
12 & 0.260284 & 2.0162 & 0.024134 \tabularnewline
13 & -0.385282 & -2.9844 & 0.002053 \tabularnewline
14 & 0.253686 & 1.965 & 0.027022 \tabularnewline
15 & -0.019786 & -0.1533 & 0.439354 \tabularnewline
16 & -0.018308 & -0.1418 & 0.443851 \tabularnewline
17 & -0.122404 & -0.9481 & 0.173431 \tabularnewline
18 & 0.008219 & 0.0637 & 0.474725 \tabularnewline
19 & -0.014869 & -0.1152 & 0.454347 \tabularnewline
20 & -0.077688 & -0.6018 & 0.274797 \tabularnewline
21 & -0.044965 & -0.3483 & 0.364417 \tabularnewline
22 & 0.038298 & 0.2967 & 0.383876 \tabularnewline
23 & -0.206685 & -1.601 & 0.057318 \tabularnewline
24 & 0.118332 & 0.9166 & 0.181513 \tabularnewline
25 & -0.008204 & -0.0635 & 0.474772 \tabularnewline
26 & -0.091705 & -0.7103 & 0.240121 \tabularnewline
27 & 0.022546 & 0.1746 & 0.430975 \tabularnewline
28 & -0.023982 & -0.1858 & 0.426629 \tabularnewline
29 & -0.041621 & -0.3224 & 0.374136 \tabularnewline
30 & -0.048401 & -0.3749 & 0.354525 \tabularnewline
31 & -0.003035 & -0.0235 & 0.49066 \tabularnewline
32 & -0.04301 & -0.3332 & 0.370089 \tabularnewline
33 & 0.047611 & 0.3688 & 0.356791 \tabularnewline
34 & -0.108704 & -0.842 & 0.201561 \tabularnewline
35 & -0.028068 & -0.2174 & 0.414312 \tabularnewline
36 & -0.031533 & -0.2443 & 0.403933 \tabularnewline
37 & 0.062881 & 0.4871 & 0.313991 \tabularnewline
38 & -0.106397 & -0.8241 & 0.20656 \tabularnewline
39 & 0.020348 & 0.1576 & 0.437644 \tabularnewline
40 & -0.041326 & -0.3201 & 0.374999 \tabularnewline
41 & -0.01955 & -0.1514 & 0.440071 \tabularnewline
42 & 0.065501 & 0.5074 & 0.306877 \tabularnewline
43 & -0.004767 & -0.0369 & 0.485334 \tabularnewline
44 & 0.009957 & 0.0771 & 0.469389 \tabularnewline
45 & 0.07442 & 0.5765 & 0.283231 \tabularnewline
46 & -0.102748 & -0.7959 & 0.214618 \tabularnewline
47 & -0.011355 & -0.088 & 0.465102 \tabularnewline
48 & -0.062256 & -0.4822 & 0.315698 \tabularnewline
\hline
\end{tabular}
%Source: https://freestatistics.org/blog/index.php?pk=&T=2

[TABLE]
[ROW][C]Partial Autocorrelation Function[/C][/ROW]
[ROW][C]Time lag k[/C][C]PACF(k)[/C][C]T-STAT[/C][C]P-value[/C][/ROW]
[ROW][C]1[/C][C]0.620682[/C][C]4.8078[/C][C]5e-06[/C][/ROW]
[ROW][C]2[/C][C]-0.518838[/C][C]-4.0189[/C][C]8.3e-05[/C][/ROW]
[ROW][C]3[/C][C]0.010059[/C][C]0.0779[/C][C]0.469077[/C][/ROW]
[ROW][C]4[/C][C]0.026842[/C][C]0.2079[/C][C]0.417997[/C][/ROW]
[ROW][C]5[/C][C]-0.020727[/C][C]-0.1606[/C][C]0.436492[/C][/ROW]
[ROW][C]6[/C][C]-0.155738[/C][C]-1.2063[/C][C]0.116211[/C][/ROW]
[ROW][C]7[/C][C]-0.057378[/C][C]-0.4444[/C][C]0.329159[/C][/ROW]
[ROW][C]8[/C][C]-0.208004[/C][C]-1.6112[/C][C]0.056193[/C][/ROW]
[ROW][C]9[/C][C]0.000824[/C][C]0.0064[/C][C]0.497463[/C][/ROW]
[ROW][C]10[/C][C]0.276168[/C][C]2.1392[/C][C]0.01825[/C][/ROW]
[ROW][C]11[/C][C]0.451784[/C][C]3.4995[/C][C]0.000443[/C][/ROW]
[ROW][C]12[/C][C]0.260284[/C][C]2.0162[/C][C]0.024134[/C][/ROW]
[ROW][C]13[/C][C]-0.385282[/C][C]-2.9844[/C][C]0.002053[/C][/ROW]
[ROW][C]14[/C][C]0.253686[/C][C]1.965[/C][C]0.027022[/C][/ROW]
[ROW][C]15[/C][C]-0.019786[/C][C]-0.1533[/C][C]0.439354[/C][/ROW]
[ROW][C]16[/C][C]-0.018308[/C][C]-0.1418[/C][C]0.443851[/C][/ROW]
[ROW][C]17[/C][C]-0.122404[/C][C]-0.9481[/C][C]0.173431[/C][/ROW]
[ROW][C]18[/C][C]0.008219[/C][C]0.0637[/C][C]0.474725[/C][/ROW]
[ROW][C]19[/C][C]-0.014869[/C][C]-0.1152[/C][C]0.454347[/C][/ROW]
[ROW][C]20[/C][C]-0.077688[/C][C]-0.6018[/C][C]0.274797[/C][/ROW]
[ROW][C]21[/C][C]-0.044965[/C][C]-0.3483[/C][C]0.364417[/C][/ROW]
[ROW][C]22[/C][C]0.038298[/C][C]0.2967[/C][C]0.383876[/C][/ROW]
[ROW][C]23[/C][C]-0.206685[/C][C]-1.601[/C][C]0.057318[/C][/ROW]
[ROW][C]24[/C][C]0.118332[/C][C]0.9166[/C][C]0.181513[/C][/ROW]
[ROW][C]25[/C][C]-0.008204[/C][C]-0.0635[/C][C]0.474772[/C][/ROW]
[ROW][C]26[/C][C]-0.091705[/C][C]-0.7103[/C][C]0.240121[/C][/ROW]
[ROW][C]27[/C][C]0.022546[/C][C]0.1746[/C][C]0.430975[/C][/ROW]
[ROW][C]28[/C][C]-0.023982[/C][C]-0.1858[/C][C]0.426629[/C][/ROW]
[ROW][C]29[/C][C]-0.041621[/C][C]-0.3224[/C][C]0.374136[/C][/ROW]
[ROW][C]30[/C][C]-0.048401[/C][C]-0.3749[/C][C]0.354525[/C][/ROW]
[ROW][C]31[/C][C]-0.003035[/C][C]-0.0235[/C][C]0.49066[/C][/ROW]
[ROW][C]32[/C][C]-0.04301[/C][C]-0.3332[/C][C]0.370089[/C][/ROW]
[ROW][C]33[/C][C]0.047611[/C][C]0.3688[/C][C]0.356791[/C][/ROW]
[ROW][C]34[/C][C]-0.108704[/C][C]-0.842[/C][C]0.201561[/C][/ROW]
[ROW][C]35[/C][C]-0.028068[/C][C]-0.2174[/C][C]0.414312[/C][/ROW]
[ROW][C]36[/C][C]-0.031533[/C][C]-0.2443[/C][C]0.403933[/C][/ROW]
[ROW][C]37[/C][C]0.062881[/C][C]0.4871[/C][C]0.313991[/C][/ROW]
[ROW][C]38[/C][C]-0.106397[/C][C]-0.8241[/C][C]0.20656[/C][/ROW]
[ROW][C]39[/C][C]0.020348[/C][C]0.1576[/C][C]0.437644[/C][/ROW]
[ROW][C]40[/C][C]-0.041326[/C][C]-0.3201[/C][C]0.374999[/C][/ROW]
[ROW][C]41[/C][C]-0.01955[/C][C]-0.1514[/C][C]0.440071[/C][/ROW]
[ROW][C]42[/C][C]0.065501[/C][C]0.5074[/C][C]0.306877[/C][/ROW]
[ROW][C]43[/C][C]-0.004767[/C][C]-0.0369[/C][C]0.485334[/C][/ROW]
[ROW][C]44[/C][C]0.009957[/C][C]0.0771[/C][C]0.469389[/C][/ROW]
[ROW][C]45[/C][C]0.07442[/C][C]0.5765[/C][C]0.283231[/C][/ROW]
[ROW][C]46[/C][C]-0.102748[/C][C]-0.7959[/C][C]0.214618[/C][/ROW]
[ROW][C]47[/C][C]-0.011355[/C][C]-0.088[/C][C]0.465102[/C][/ROW]
[ROW][C]48[/C][C]-0.062256[/C][C]-0.4822[/C][C]0.315698[/C][/ROW]
[/TABLE]
Source: https://freestatistics.org/blog/index.php?pk=&T=2

Globally Unique Identifier (entire table): ba.freestatistics.org/blog/index.php?pk=&T=2

As an alternative you can also use a QR Code:  

The GUIDs for individual cells are displayed in the table below:

Partial Autocorrelation Function
Time lag kPACF(k)T-STATP-value
10.6206824.80785e-06
2-0.518838-4.01898.3e-05
30.0100590.07790.469077
40.0268420.20790.417997
5-0.020727-0.16060.436492
6-0.155738-1.20630.116211
7-0.057378-0.44440.329159
8-0.208004-1.61120.056193
90.0008240.00640.497463
100.2761682.13920.01825
110.4517843.49950.000443
120.2602842.01620.024134
13-0.385282-2.98440.002053
140.2536861.9650.027022
15-0.019786-0.15330.439354
16-0.018308-0.14180.443851
17-0.122404-0.94810.173431
180.0082190.06370.474725
19-0.014869-0.11520.454347
20-0.077688-0.60180.274797
21-0.044965-0.34830.364417
220.0382980.29670.383876
23-0.206685-1.6010.057318
240.1183320.91660.181513
25-0.008204-0.06350.474772
26-0.091705-0.71030.240121
270.0225460.17460.430975
28-0.023982-0.18580.426629
29-0.041621-0.32240.374136
30-0.048401-0.37490.354525
31-0.003035-0.02350.49066
32-0.04301-0.33320.370089
330.0476110.36880.356791
34-0.108704-0.8420.201561
35-0.028068-0.21740.414312
36-0.031533-0.24430.403933
370.0628810.48710.313991
38-0.106397-0.82410.20656
390.0203480.15760.437644
40-0.041326-0.32010.374999
41-0.01955-0.15140.440071
420.0655010.50740.306877
43-0.004767-0.03690.485334
440.0099570.07710.469389
450.074420.57650.283231
46-0.102748-0.79590.214618
47-0.011355-0.0880.465102
48-0.062256-0.48220.315698


Parameters (Session):
par1 = 48 ; par2 = 1 ; par3 = 0 ; par4 = 0 ; par5 = 12 ; par6 = White Noise ; par7 = 0.95 ;
Parameters (R input):
par1 = 48 ; par2 = 1 ; par3 = 0 ; par4 = 0 ; par5 = 12 ; par6 = White Noise ; par7 = 0.95 ; par8 = ;
R code (references can be found in the software module):
if (par1 == 'Default') {
par1 = 10*log10(length(x))
} else {
par1 <- as.numeric(par1)
}
par2 <- as.numeric(par2)
par3 <- as.numeric(par3)
par4 <- as.numeric(par4)
par5 <- as.numeric(par5)
if (par6 == 'White Noise') par6 <- 'white' else par6 <- 'ma'
par7 <- as.numeric(par7)
if (par8 != '') par8 <- as.numeric(par8)
x <- na.omit(x)
ox <- x
if (par8 == '') {
if (par2 == 0) {
x <- log(x)
} else {
x <- (x ^ par2 - 1) / par2
}
} else {
x <- log(x,base=par8)
}
if (par3 > 0) x <- diff(x,lag=1,difference=par3)
if (par4 > 0) x <- diff(x,lag=par5,difference=par4)
bitmap(file='picts.png')
op <- par(mfrow=c(2,1))
plot(ox,type='l',main='Original Time Series',xlab='time',ylab='value')
if (par8=='') {
mytitle <- paste('Working Time Series (lambda=',par2,', d=',par3,', D=',par4,')',sep='')
mysub <- paste('(lambda=',par2,', d=',par3,', D=',par4,', CI=', par7, ', CI type=',par6,')',sep='')
} else {
mytitle <- paste('Working Time Series (base=',par8,', d=',par3,', D=',par4,')',sep='')
mysub <- paste('(base=',par8,', d=',par3,', D=',par4,', CI=', par7, ', CI type=',par6,')',sep='')
}
plot(x,type='l', main=mytitle,xlab='time',ylab='value')
par(op)
dev.off()
bitmap(file='pic1.png')
racf <- acf(x, par1, main='Autocorrelation', xlab='time lag', ylab='ACF', ci.type=par6, ci=par7, sub=mysub)
dev.off()
bitmap(file='pic2.png')
rpacf <- pacf(x,par1,main='Partial Autocorrelation',xlab='lags',ylab='PACF',sub=mysub)
dev.off()
(myacf <- c(racf$acf))
(mypacf <- c(rpacf$acf))
lengthx <- length(x)
sqrtn <- sqrt(lengthx)
load(file='createtable')
a<-table.start()
a<-table.row.start(a)
a<-table.element(a,'Autocorrelation Function',4,TRUE)
a<-table.row.end(a)
a<-table.row.start(a)
a<-table.element(a,'Time lag k',header=TRUE)
a<-table.element(a,hyperlink('basics.htm','ACF(k)','click here for more information about the Autocorrelation Function'),header=TRUE)
a<-table.element(a,'T-STAT',header=TRUE)
a<-table.element(a,'P-value',header=TRUE)
a<-table.row.end(a)
for (i in 2:(par1+1)) {
a<-table.row.start(a)
a<-table.element(a,i-1,header=TRUE)
a<-table.element(a,round(myacf[i],6))
mytstat <- myacf[i]*sqrtn
a<-table.element(a,round(mytstat,4))
a<-table.element(a,round(1-pt(abs(mytstat),lengthx),6))
a<-table.row.end(a)
}
a<-table.end(a)
table.save(a,file='mytable.tab')
a<-table.start()
a<-table.row.start(a)
a<-table.element(a,'Partial Autocorrelation Function',4,TRUE)
a<-table.row.end(a)
a<-table.row.start(a)
a<-table.element(a,'Time lag k',header=TRUE)
a<-table.element(a,hyperlink('basics.htm','PACF(k)','click here for more information about the Partial Autocorrelation Function'),header=TRUE)
a<-table.element(a,'T-STAT',header=TRUE)
a<-table.element(a,'P-value',header=TRUE)
a<-table.row.end(a)
for (i in 1:par1) {
a<-table.row.start(a)
a<-table.element(a,i,header=TRUE)
a<-table.element(a,round(mypacf[i],6))
mytstat <- mypacf[i]*sqrtn
a<-table.element(a,round(mytstat,4))
a<-table.element(a,round(1-pt(abs(mytstat),lengthx),6))
a<-table.row.end(a)
}
a<-table.end(a)
table.save(a,file='mytable1.tab')