Free Statistics

of Irreproducible Research!

Author's title

Author*Unverified author*
R Software Modulerwasp_autocorrelation.wasp
Title produced by software(Partial) Autocorrelation Function
Date of computationTue, 18 Oct 2016 20:48:45 +0100
Cite this page as followsStatistical Computations at FreeStatistics.org, Office for Research Development and Education, URL https://freestatistics.org/blog/index.php?v=date/2016/Oct/18/t1476820187wiba6jm0hmtdaln.htm/, Retrieved Sun, 28 Apr 2024 06:53:22 +0200
Statistical Computations at FreeStatistics.org, Office for Research Development and Education, URL https://freestatistics.org/blog/index.php?pk=, Retrieved Sun, 28 Apr 2024 06:53:22 +0200
QR Codes:

Original text written by user:
IsPrivate?No (this computation is public)
User-defined keywords
Estimated Impact0
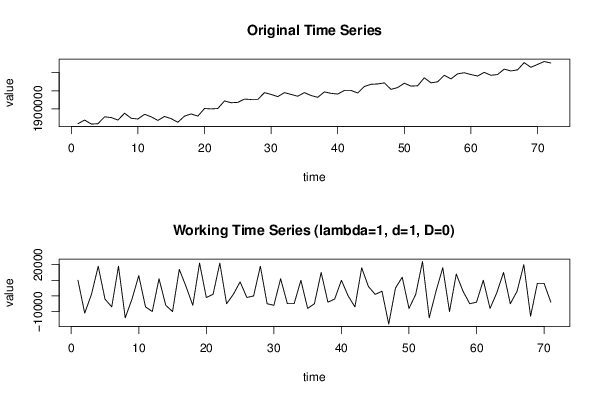
Dataseries X:
1859000
1869000
1858000
1859000
1878000
1876000
1869000
1888000
1874000
1872000
1885000
1878000
1868000
1879000
1873000
1863000
1880000
1886000
1880000
1901000
1900000
1901000
1922000
1917000
1918000
1927000
1926000
1926000
1945000
1940000
1934000
1945000
1940000
1935000
1945000
1937000
1932000
1947000
1943000
1941000
1951000
1951000
1944000
1962000
1968000
1969000
1972000
1954000
1959000
1971000
1963000
1964000
1986000
1972000
1975000
1993000
1983000
1997000
2000000
1995000
1991000
2001000
1993000
1995000
2010000
2005000
2008000
2028000
2015000
2023000
2031000
2027000


Summary of computational transaction
Raw Inputview raw input (R code)
Raw Outputview raw output of R engine
Computing time1 seconds
R Server'Sir Ronald Aylmer Fisher' @ fisher.wessa.net

\begin{tabular}{lllllllll}
\hline
Summary of computational transaction \tabularnewline
Raw Input & view raw input (R code)  \tabularnewline
Raw Output & view raw output of R engine  \tabularnewline
Computing time & 1 seconds \tabularnewline
R Server & 'Sir Ronald Aylmer Fisher' @ fisher.wessa.net \tabularnewline
\hline
\end{tabular}
%Source: https://freestatistics.org/blog/index.php?pk=&T=0

[TABLE]
[ROW][C]Summary of computational transaction[/C][/ROW]
[ROW][C]Raw Input[/C][C]view raw input (R code) [/C][/ROW]
[ROW][C]Raw Output[/C][C]view raw output of R engine [/C][/ROW]
[ROW][C]Computing time[/C][C]1 seconds[/C][/ROW]
[ROW][C]R Server[/C][C]'Sir Ronald Aylmer Fisher' @ fisher.wessa.net[/C][/ROW]
[/TABLE]
Source: https://freestatistics.org/blog/index.php?pk=&T=0

Globally Unique Identifier (entire table): ba.freestatistics.org/blog/index.php?pk=&T=0

As an alternative you can also use a QR Code:  

The GUIDs for individual cells are displayed in the table below:

Summary of computational transaction
Raw Inputview raw input (R code)
Raw Outputview raw output of R engine
Computing time1 seconds
R Server'Sir Ronald Aylmer Fisher' @ fisher.wessa.net


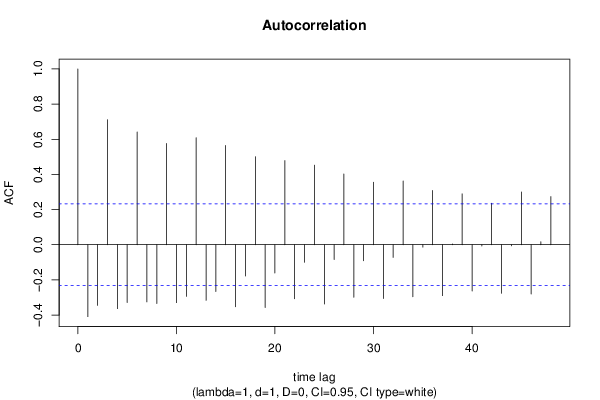
Autocorrelation Function
Time lag kACF(k)T-STATP-value
1-0.40924-3.44830.000476
2-0.345219-2.90890.00242
30.7111515.99230
4-0.363595-3.06370.001544
5-0.328673-2.76950.00358
60.6412415.40320
7-0.325063-2.7390.003893
8-0.334644-2.81980.003112
90.5759924.85343e-06
10-0.329647-2.77770.003499
11-0.293837-2.47590.007838
120.608465.1271e-06
13-0.3165-2.66690.004738
14-0.265848-2.24010.014109
150.5646394.75775e-06
16-0.352632-2.97130.002022
17-0.177993-1.49980.069051
180.5007224.21923.6e-05
19-0.357208-3.00990.001808
20-0.160755-1.35450.089928
210.4783754.03096.9e-05
22-0.3075-2.5910.005803
23-0.099878-0.84160.201422
240.4526913.81440.000144
25-0.336874-2.83860.002953
26-0.084076-0.70840.240497
270.4020813.3880.000576
28-0.299161-2.52080.006979
29-0.091376-0.770.221942
300.3557492.99760.001874
31-0.306087-2.57910.005989
32-0.071964-0.60640.273098
330.3627743.05680.001576
34-0.295628-2.4910.007539
35-0.013659-0.11510.454347
360.3087942.60190.005637
37-0.289534-2.43970.0086
380.0037070.03120.487586
390.2892052.43690.008662
40-0.262979-2.21590.014953
41-0.007684-0.06470.474278
420.2360431.98890.025281
43-0.276452-2.32940.011343
44-0.006408-0.0540.478547
450.299682.52510.0069
46-0.280755-2.36570.010365
470.0170570.14370.443063
480.2737382.30660.012001

\begin{tabular}{lllllllll}
\hline
Autocorrelation Function \tabularnewline
Time lag k & ACF(k) & T-STAT & P-value \tabularnewline
1 & -0.40924 & -3.4483 & 0.000476 \tabularnewline
2 & -0.345219 & -2.9089 & 0.00242 \tabularnewline
3 & 0.711151 & 5.9923 & 0 \tabularnewline
4 & -0.363595 & -3.0637 & 0.001544 \tabularnewline
5 & -0.328673 & -2.7695 & 0.00358 \tabularnewline
6 & 0.641241 & 5.4032 & 0 \tabularnewline
7 & -0.325063 & -2.739 & 0.003893 \tabularnewline
8 & -0.334644 & -2.8198 & 0.003112 \tabularnewline
9 & 0.575992 & 4.8534 & 3e-06 \tabularnewline
10 & -0.329647 & -2.7777 & 0.003499 \tabularnewline
11 & -0.293837 & -2.4759 & 0.007838 \tabularnewline
12 & 0.60846 & 5.127 & 1e-06 \tabularnewline
13 & -0.3165 & -2.6669 & 0.004738 \tabularnewline
14 & -0.265848 & -2.2401 & 0.014109 \tabularnewline
15 & 0.564639 & 4.7577 & 5e-06 \tabularnewline
16 & -0.352632 & -2.9713 & 0.002022 \tabularnewline
17 & -0.177993 & -1.4998 & 0.069051 \tabularnewline
18 & 0.500722 & 4.2192 & 3.6e-05 \tabularnewline
19 & -0.357208 & -3.0099 & 0.001808 \tabularnewline
20 & -0.160755 & -1.3545 & 0.089928 \tabularnewline
21 & 0.478375 & 4.0309 & 6.9e-05 \tabularnewline
22 & -0.3075 & -2.591 & 0.005803 \tabularnewline
23 & -0.099878 & -0.8416 & 0.201422 \tabularnewline
24 & 0.452691 & 3.8144 & 0.000144 \tabularnewline
25 & -0.336874 & -2.8386 & 0.002953 \tabularnewline
26 & -0.084076 & -0.7084 & 0.240497 \tabularnewline
27 & 0.402081 & 3.388 & 0.000576 \tabularnewline
28 & -0.299161 & -2.5208 & 0.006979 \tabularnewline
29 & -0.091376 & -0.77 & 0.221942 \tabularnewline
30 & 0.355749 & 2.9976 & 0.001874 \tabularnewline
31 & -0.306087 & -2.5791 & 0.005989 \tabularnewline
32 & -0.071964 & -0.6064 & 0.273098 \tabularnewline
33 & 0.362774 & 3.0568 & 0.001576 \tabularnewline
34 & -0.295628 & -2.491 & 0.007539 \tabularnewline
35 & -0.013659 & -0.1151 & 0.454347 \tabularnewline
36 & 0.308794 & 2.6019 & 0.005637 \tabularnewline
37 & -0.289534 & -2.4397 & 0.0086 \tabularnewline
38 & 0.003707 & 0.0312 & 0.487586 \tabularnewline
39 & 0.289205 & 2.4369 & 0.008662 \tabularnewline
40 & -0.262979 & -2.2159 & 0.014953 \tabularnewline
41 & -0.007684 & -0.0647 & 0.474278 \tabularnewline
42 & 0.236043 & 1.9889 & 0.025281 \tabularnewline
43 & -0.276452 & -2.3294 & 0.011343 \tabularnewline
44 & -0.006408 & -0.054 & 0.478547 \tabularnewline
45 & 0.29968 & 2.5251 & 0.0069 \tabularnewline
46 & -0.280755 & -2.3657 & 0.010365 \tabularnewline
47 & 0.017057 & 0.1437 & 0.443063 \tabularnewline
48 & 0.273738 & 2.3066 & 0.012001 \tabularnewline
\hline
\end{tabular}
%Source: https://freestatistics.org/blog/index.php?pk=&T=1

[TABLE]
[ROW][C]Autocorrelation Function[/C][/ROW]
[ROW][C]Time lag k[/C][C]ACF(k)[/C][C]T-STAT[/C][C]P-value[/C][/ROW]
[ROW][C]1[/C][C]-0.40924[/C][C]-3.4483[/C][C]0.000476[/C][/ROW]
[ROW][C]2[/C][C]-0.345219[/C][C]-2.9089[/C][C]0.00242[/C][/ROW]
[ROW][C]3[/C][C]0.711151[/C][C]5.9923[/C][C]0[/C][/ROW]
[ROW][C]4[/C][C]-0.363595[/C][C]-3.0637[/C][C]0.001544[/C][/ROW]
[ROW][C]5[/C][C]-0.328673[/C][C]-2.7695[/C][C]0.00358[/C][/ROW]
[ROW][C]6[/C][C]0.641241[/C][C]5.4032[/C][C]0[/C][/ROW]
[ROW][C]7[/C][C]-0.325063[/C][C]-2.739[/C][C]0.003893[/C][/ROW]
[ROW][C]8[/C][C]-0.334644[/C][C]-2.8198[/C][C]0.003112[/C][/ROW]
[ROW][C]9[/C][C]0.575992[/C][C]4.8534[/C][C]3e-06[/C][/ROW]
[ROW][C]10[/C][C]-0.329647[/C][C]-2.7777[/C][C]0.003499[/C][/ROW]
[ROW][C]11[/C][C]-0.293837[/C][C]-2.4759[/C][C]0.007838[/C][/ROW]
[ROW][C]12[/C][C]0.60846[/C][C]5.127[/C][C]1e-06[/C][/ROW]
[ROW][C]13[/C][C]-0.3165[/C][C]-2.6669[/C][C]0.004738[/C][/ROW]
[ROW][C]14[/C][C]-0.265848[/C][C]-2.2401[/C][C]0.014109[/C][/ROW]
[ROW][C]15[/C][C]0.564639[/C][C]4.7577[/C][C]5e-06[/C][/ROW]
[ROW][C]16[/C][C]-0.352632[/C][C]-2.9713[/C][C]0.002022[/C][/ROW]
[ROW][C]17[/C][C]-0.177993[/C][C]-1.4998[/C][C]0.069051[/C][/ROW]
[ROW][C]18[/C][C]0.500722[/C][C]4.2192[/C][C]3.6e-05[/C][/ROW]
[ROW][C]19[/C][C]-0.357208[/C][C]-3.0099[/C][C]0.001808[/C][/ROW]
[ROW][C]20[/C][C]-0.160755[/C][C]-1.3545[/C][C]0.089928[/C][/ROW]
[ROW][C]21[/C][C]0.478375[/C][C]4.0309[/C][C]6.9e-05[/C][/ROW]
[ROW][C]22[/C][C]-0.3075[/C][C]-2.591[/C][C]0.005803[/C][/ROW]
[ROW][C]23[/C][C]-0.099878[/C][C]-0.8416[/C][C]0.201422[/C][/ROW]
[ROW][C]24[/C][C]0.452691[/C][C]3.8144[/C][C]0.000144[/C][/ROW]
[ROW][C]25[/C][C]-0.336874[/C][C]-2.8386[/C][C]0.002953[/C][/ROW]
[ROW][C]26[/C][C]-0.084076[/C][C]-0.7084[/C][C]0.240497[/C][/ROW]
[ROW][C]27[/C][C]0.402081[/C][C]3.388[/C][C]0.000576[/C][/ROW]
[ROW][C]28[/C][C]-0.299161[/C][C]-2.5208[/C][C]0.006979[/C][/ROW]
[ROW][C]29[/C][C]-0.091376[/C][C]-0.77[/C][C]0.221942[/C][/ROW]
[ROW][C]30[/C][C]0.355749[/C][C]2.9976[/C][C]0.001874[/C][/ROW]
[ROW][C]31[/C][C]-0.306087[/C][C]-2.5791[/C][C]0.005989[/C][/ROW]
[ROW][C]32[/C][C]-0.071964[/C][C]-0.6064[/C][C]0.273098[/C][/ROW]
[ROW][C]33[/C][C]0.362774[/C][C]3.0568[/C][C]0.001576[/C][/ROW]
[ROW][C]34[/C][C]-0.295628[/C][C]-2.491[/C][C]0.007539[/C][/ROW]
[ROW][C]35[/C][C]-0.013659[/C][C]-0.1151[/C][C]0.454347[/C][/ROW]
[ROW][C]36[/C][C]0.308794[/C][C]2.6019[/C][C]0.005637[/C][/ROW]
[ROW][C]37[/C][C]-0.289534[/C][C]-2.4397[/C][C]0.0086[/C][/ROW]
[ROW][C]38[/C][C]0.003707[/C][C]0.0312[/C][C]0.487586[/C][/ROW]
[ROW][C]39[/C][C]0.289205[/C][C]2.4369[/C][C]0.008662[/C][/ROW]
[ROW][C]40[/C][C]-0.262979[/C][C]-2.2159[/C][C]0.014953[/C][/ROW]
[ROW][C]41[/C][C]-0.007684[/C][C]-0.0647[/C][C]0.474278[/C][/ROW]
[ROW][C]42[/C][C]0.236043[/C][C]1.9889[/C][C]0.025281[/C][/ROW]
[ROW][C]43[/C][C]-0.276452[/C][C]-2.3294[/C][C]0.011343[/C][/ROW]
[ROW][C]44[/C][C]-0.006408[/C][C]-0.054[/C][C]0.478547[/C][/ROW]
[ROW][C]45[/C][C]0.29968[/C][C]2.5251[/C][C]0.0069[/C][/ROW]
[ROW][C]46[/C][C]-0.280755[/C][C]-2.3657[/C][C]0.010365[/C][/ROW]
[ROW][C]47[/C][C]0.017057[/C][C]0.1437[/C][C]0.443063[/C][/ROW]
[ROW][C]48[/C][C]0.273738[/C][C]2.3066[/C][C]0.012001[/C][/ROW]
[/TABLE]
Source: https://freestatistics.org/blog/index.php?pk=&T=1

Globally Unique Identifier (entire table): ba.freestatistics.org/blog/index.php?pk=&T=1

As an alternative you can also use a QR Code:  

The GUIDs for individual cells are displayed in the table below:

Autocorrelation Function
Time lag kACF(k)T-STATP-value
1-0.40924-3.44830.000476
2-0.345219-2.90890.00242
30.7111515.99230
4-0.363595-3.06370.001544
5-0.328673-2.76950.00358
60.6412415.40320
7-0.325063-2.7390.003893
8-0.334644-2.81980.003112
90.5759924.85343e-06
10-0.329647-2.77770.003499
11-0.293837-2.47590.007838
120.608465.1271e-06
13-0.3165-2.66690.004738
14-0.265848-2.24010.014109
150.5646394.75775e-06
16-0.352632-2.97130.002022
17-0.177993-1.49980.069051
180.5007224.21923.6e-05
19-0.357208-3.00990.001808
20-0.160755-1.35450.089928
210.4783754.03096.9e-05
22-0.3075-2.5910.005803
23-0.099878-0.84160.201422
240.4526913.81440.000144
25-0.336874-2.83860.002953
26-0.084076-0.70840.240497
270.4020813.3880.000576
28-0.299161-2.52080.006979
29-0.091376-0.770.221942
300.3557492.99760.001874
31-0.306087-2.57910.005989
32-0.071964-0.60640.273098
330.3627743.05680.001576
34-0.295628-2.4910.007539
35-0.013659-0.11510.454347
360.3087942.60190.005637
37-0.289534-2.43970.0086
380.0037070.03120.487586
390.2892052.43690.008662
40-0.262979-2.21590.014953
41-0.007684-0.06470.474278
420.2360431.98890.025281
43-0.276452-2.32940.011343
44-0.006408-0.0540.478547
450.299682.52510.0069
46-0.280755-2.36570.010365
470.0170570.14370.443063
480.2737382.30660.012001


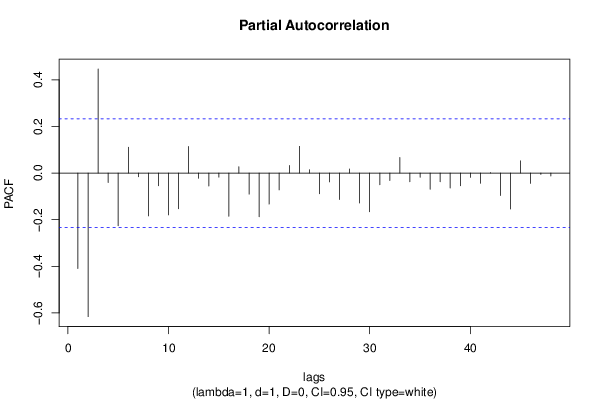
Partial Autocorrelation Function
Time lag kPACF(k)T-STATP-value
1-0.40924-3.44830.000476
2-0.615834-5.18911e-06
30.4466953.76390.000171
4-0.040583-0.3420.366697
5-0.22559-1.90090.03069
60.1106130.9320.177238
7-0.01591-0.13410.446867
8-0.183666-1.54760.063082
9-0.054356-0.4580.32417
10-0.179422-1.51180.067507
11-0.152682-1.28650.101221
120.1139120.95980.170197
13-0.022443-0.18910.425274
14-0.055722-0.46950.320068
15-0.017313-0.14590.442214
16-0.185061-1.55940.06168
170.0275580.23220.408524
18-0.090465-0.76230.224212
19-0.187421-1.57920.059363
20-0.133022-1.12090.133062
21-0.072112-0.60760.272686
220.0324290.27330.392725
230.1145280.9650.168903
240.0141150.11890.45283
25-0.088839-0.74860.228295
26-0.037714-0.31780.375792
27-0.113251-0.95430.171592
280.0172390.14530.442459
29-0.12858-1.08340.141141
30-0.165557-1.3950.083681
31-0.049887-0.42040.337747
32-0.03196-0.26930.394239
330.066930.5640.287277
34-0.037365-0.31480.376902
35-0.018075-0.15230.43969
36-0.069386-0.58470.280315
37-0.037231-0.31370.377329
38-0.063867-0.53820.296077
39-0.054368-0.45810.324134
40-0.018529-0.15610.438189
41-0.043643-0.36770.357078
420.0019320.01630.49353
43-0.096414-0.81240.209639
44-0.153984-1.29750.099331
450.0525090.44250.329754
46-0.044089-0.37150.355685
47-0.005621-0.04740.48118
48-0.012405-0.10450.458522

\begin{tabular}{lllllllll}
\hline
Partial Autocorrelation Function \tabularnewline
Time lag k & PACF(k) & T-STAT & P-value \tabularnewline
1 & -0.40924 & -3.4483 & 0.000476 \tabularnewline
2 & -0.615834 & -5.1891 & 1e-06 \tabularnewline
3 & 0.446695 & 3.7639 & 0.000171 \tabularnewline
4 & -0.040583 & -0.342 & 0.366697 \tabularnewline
5 & -0.22559 & -1.9009 & 0.03069 \tabularnewline
6 & 0.110613 & 0.932 & 0.177238 \tabularnewline
7 & -0.01591 & -0.1341 & 0.446867 \tabularnewline
8 & -0.183666 & -1.5476 & 0.063082 \tabularnewline
9 & -0.054356 & -0.458 & 0.32417 \tabularnewline
10 & -0.179422 & -1.5118 & 0.067507 \tabularnewline
11 & -0.152682 & -1.2865 & 0.101221 \tabularnewline
12 & 0.113912 & 0.9598 & 0.170197 \tabularnewline
13 & -0.022443 & -0.1891 & 0.425274 \tabularnewline
14 & -0.055722 & -0.4695 & 0.320068 \tabularnewline
15 & -0.017313 & -0.1459 & 0.442214 \tabularnewline
16 & -0.185061 & -1.5594 & 0.06168 \tabularnewline
17 & 0.027558 & 0.2322 & 0.408524 \tabularnewline
18 & -0.090465 & -0.7623 & 0.224212 \tabularnewline
19 & -0.187421 & -1.5792 & 0.059363 \tabularnewline
20 & -0.133022 & -1.1209 & 0.133062 \tabularnewline
21 & -0.072112 & -0.6076 & 0.272686 \tabularnewline
22 & 0.032429 & 0.2733 & 0.392725 \tabularnewline
23 & 0.114528 & 0.965 & 0.168903 \tabularnewline
24 & 0.014115 & 0.1189 & 0.45283 \tabularnewline
25 & -0.088839 & -0.7486 & 0.228295 \tabularnewline
26 & -0.037714 & -0.3178 & 0.375792 \tabularnewline
27 & -0.113251 & -0.9543 & 0.171592 \tabularnewline
28 & 0.017239 & 0.1453 & 0.442459 \tabularnewline
29 & -0.12858 & -1.0834 & 0.141141 \tabularnewline
30 & -0.165557 & -1.395 & 0.083681 \tabularnewline
31 & -0.049887 & -0.4204 & 0.337747 \tabularnewline
32 & -0.03196 & -0.2693 & 0.394239 \tabularnewline
33 & 0.06693 & 0.564 & 0.287277 \tabularnewline
34 & -0.037365 & -0.3148 & 0.376902 \tabularnewline
35 & -0.018075 & -0.1523 & 0.43969 \tabularnewline
36 & -0.069386 & -0.5847 & 0.280315 \tabularnewline
37 & -0.037231 & -0.3137 & 0.377329 \tabularnewline
38 & -0.063867 & -0.5382 & 0.296077 \tabularnewline
39 & -0.054368 & -0.4581 & 0.324134 \tabularnewline
40 & -0.018529 & -0.1561 & 0.438189 \tabularnewline
41 & -0.043643 & -0.3677 & 0.357078 \tabularnewline
42 & 0.001932 & 0.0163 & 0.49353 \tabularnewline
43 & -0.096414 & -0.8124 & 0.209639 \tabularnewline
44 & -0.153984 & -1.2975 & 0.099331 \tabularnewline
45 & 0.052509 & 0.4425 & 0.329754 \tabularnewline
46 & -0.044089 & -0.3715 & 0.355685 \tabularnewline
47 & -0.005621 & -0.0474 & 0.48118 \tabularnewline
48 & -0.012405 & -0.1045 & 0.458522 \tabularnewline
\hline
\end{tabular}
%Source: https://freestatistics.org/blog/index.php?pk=&T=2

[TABLE]
[ROW][C]Partial Autocorrelation Function[/C][/ROW]
[ROW][C]Time lag k[/C][C]PACF(k)[/C][C]T-STAT[/C][C]P-value[/C][/ROW]
[ROW][C]1[/C][C]-0.40924[/C][C]-3.4483[/C][C]0.000476[/C][/ROW]
[ROW][C]2[/C][C]-0.615834[/C][C]-5.1891[/C][C]1e-06[/C][/ROW]
[ROW][C]3[/C][C]0.446695[/C][C]3.7639[/C][C]0.000171[/C][/ROW]
[ROW][C]4[/C][C]-0.040583[/C][C]-0.342[/C][C]0.366697[/C][/ROW]
[ROW][C]5[/C][C]-0.22559[/C][C]-1.9009[/C][C]0.03069[/C][/ROW]
[ROW][C]6[/C][C]0.110613[/C][C]0.932[/C][C]0.177238[/C][/ROW]
[ROW][C]7[/C][C]-0.01591[/C][C]-0.1341[/C][C]0.446867[/C][/ROW]
[ROW][C]8[/C][C]-0.183666[/C][C]-1.5476[/C][C]0.063082[/C][/ROW]
[ROW][C]9[/C][C]-0.054356[/C][C]-0.458[/C][C]0.32417[/C][/ROW]
[ROW][C]10[/C][C]-0.179422[/C][C]-1.5118[/C][C]0.067507[/C][/ROW]
[ROW][C]11[/C][C]-0.152682[/C][C]-1.2865[/C][C]0.101221[/C][/ROW]
[ROW][C]12[/C][C]0.113912[/C][C]0.9598[/C][C]0.170197[/C][/ROW]
[ROW][C]13[/C][C]-0.022443[/C][C]-0.1891[/C][C]0.425274[/C][/ROW]
[ROW][C]14[/C][C]-0.055722[/C][C]-0.4695[/C][C]0.320068[/C][/ROW]
[ROW][C]15[/C][C]-0.017313[/C][C]-0.1459[/C][C]0.442214[/C][/ROW]
[ROW][C]16[/C][C]-0.185061[/C][C]-1.5594[/C][C]0.06168[/C][/ROW]
[ROW][C]17[/C][C]0.027558[/C][C]0.2322[/C][C]0.408524[/C][/ROW]
[ROW][C]18[/C][C]-0.090465[/C][C]-0.7623[/C][C]0.224212[/C][/ROW]
[ROW][C]19[/C][C]-0.187421[/C][C]-1.5792[/C][C]0.059363[/C][/ROW]
[ROW][C]20[/C][C]-0.133022[/C][C]-1.1209[/C][C]0.133062[/C][/ROW]
[ROW][C]21[/C][C]-0.072112[/C][C]-0.6076[/C][C]0.272686[/C][/ROW]
[ROW][C]22[/C][C]0.032429[/C][C]0.2733[/C][C]0.392725[/C][/ROW]
[ROW][C]23[/C][C]0.114528[/C][C]0.965[/C][C]0.168903[/C][/ROW]
[ROW][C]24[/C][C]0.014115[/C][C]0.1189[/C][C]0.45283[/C][/ROW]
[ROW][C]25[/C][C]-0.088839[/C][C]-0.7486[/C][C]0.228295[/C][/ROW]
[ROW][C]26[/C][C]-0.037714[/C][C]-0.3178[/C][C]0.375792[/C][/ROW]
[ROW][C]27[/C][C]-0.113251[/C][C]-0.9543[/C][C]0.171592[/C][/ROW]
[ROW][C]28[/C][C]0.017239[/C][C]0.1453[/C][C]0.442459[/C][/ROW]
[ROW][C]29[/C][C]-0.12858[/C][C]-1.0834[/C][C]0.141141[/C][/ROW]
[ROW][C]30[/C][C]-0.165557[/C][C]-1.395[/C][C]0.083681[/C][/ROW]
[ROW][C]31[/C][C]-0.049887[/C][C]-0.4204[/C][C]0.337747[/C][/ROW]
[ROW][C]32[/C][C]-0.03196[/C][C]-0.2693[/C][C]0.394239[/C][/ROW]
[ROW][C]33[/C][C]0.06693[/C][C]0.564[/C][C]0.287277[/C][/ROW]
[ROW][C]34[/C][C]-0.037365[/C][C]-0.3148[/C][C]0.376902[/C][/ROW]
[ROW][C]35[/C][C]-0.018075[/C][C]-0.1523[/C][C]0.43969[/C][/ROW]
[ROW][C]36[/C][C]-0.069386[/C][C]-0.5847[/C][C]0.280315[/C][/ROW]
[ROW][C]37[/C][C]-0.037231[/C][C]-0.3137[/C][C]0.377329[/C][/ROW]
[ROW][C]38[/C][C]-0.063867[/C][C]-0.5382[/C][C]0.296077[/C][/ROW]
[ROW][C]39[/C][C]-0.054368[/C][C]-0.4581[/C][C]0.324134[/C][/ROW]
[ROW][C]40[/C][C]-0.018529[/C][C]-0.1561[/C][C]0.438189[/C][/ROW]
[ROW][C]41[/C][C]-0.043643[/C][C]-0.3677[/C][C]0.357078[/C][/ROW]
[ROW][C]42[/C][C]0.001932[/C][C]0.0163[/C][C]0.49353[/C][/ROW]
[ROW][C]43[/C][C]-0.096414[/C][C]-0.8124[/C][C]0.209639[/C][/ROW]
[ROW][C]44[/C][C]-0.153984[/C][C]-1.2975[/C][C]0.099331[/C][/ROW]
[ROW][C]45[/C][C]0.052509[/C][C]0.4425[/C][C]0.329754[/C][/ROW]
[ROW][C]46[/C][C]-0.044089[/C][C]-0.3715[/C][C]0.355685[/C][/ROW]
[ROW][C]47[/C][C]-0.005621[/C][C]-0.0474[/C][C]0.48118[/C][/ROW]
[ROW][C]48[/C][C]-0.012405[/C][C]-0.1045[/C][C]0.458522[/C][/ROW]
[/TABLE]
Source: https://freestatistics.org/blog/index.php?pk=&T=2

Globally Unique Identifier (entire table): ba.freestatistics.org/blog/index.php?pk=&T=2

As an alternative you can also use a QR Code:  

The GUIDs for individual cells are displayed in the table below:

Partial Autocorrelation Function
Time lag kPACF(k)T-STATP-value
1-0.40924-3.44830.000476
2-0.615834-5.18911e-06
30.4466953.76390.000171
4-0.040583-0.3420.366697
5-0.22559-1.90090.03069
60.1106130.9320.177238
7-0.01591-0.13410.446867
8-0.183666-1.54760.063082
9-0.054356-0.4580.32417
10-0.179422-1.51180.067507
11-0.152682-1.28650.101221
120.1139120.95980.170197
13-0.022443-0.18910.425274
14-0.055722-0.46950.320068
15-0.017313-0.14590.442214
16-0.185061-1.55940.06168
170.0275580.23220.408524
18-0.090465-0.76230.224212
19-0.187421-1.57920.059363
20-0.133022-1.12090.133062
21-0.072112-0.60760.272686
220.0324290.27330.392725
230.1145280.9650.168903
240.0141150.11890.45283
25-0.088839-0.74860.228295
26-0.037714-0.31780.375792
27-0.113251-0.95430.171592
280.0172390.14530.442459
29-0.12858-1.08340.141141
30-0.165557-1.3950.083681
31-0.049887-0.42040.337747
32-0.03196-0.26930.394239
330.066930.5640.287277
34-0.037365-0.31480.376902
35-0.018075-0.15230.43969
36-0.069386-0.58470.280315
37-0.037231-0.31370.377329
38-0.063867-0.53820.296077
39-0.054368-0.45810.324134
40-0.018529-0.15610.438189
41-0.043643-0.36770.357078
420.0019320.01630.49353
43-0.096414-0.81240.209639
44-0.153984-1.29750.099331
450.0525090.44250.329754
46-0.044089-0.37150.355685
47-0.005621-0.04740.48118
48-0.012405-0.10450.458522


Parameters (Session):
par1 = 48 ; par2 = 1 ; par3 = 1 ; par4 = 0 ; par5 = 12 ; par6 = White Noise ; par7 = 0.95 ;
Parameters (R input):
par1 = 48 ; par2 = 1 ; par3 = 1 ; par4 = 0 ; par5 = 12 ; par6 = White Noise ; par7 = 0.95 ; par8 = ;
R code (references can be found in the software module):
par8 <- ''
par7 <- '0.95'
par6 <- 'White Noise'
par5 <- '12'
par4 <- '0'
par3 <- '0'
par2 <- '1'
par1 <- '48'
if (par1 == 'Default') {
par1 = 10*log10(length(x))
} else {
par1 <- as.numeric(par1)
}
par2 <- as.numeric(par2)
par3 <- as.numeric(par3)
par4 <- as.numeric(par4)
par5 <- as.numeric(par5)
if (par6 == 'White Noise') par6 <- 'white' else par6 <- 'ma'
par7 <- as.numeric(par7)
if (par8 != '') par8 <- as.numeric(par8)
x <- na.omit(x)
ox <- x
if (par8 == '') {
if (par2 == 0) {
x <- log(x)
} else {
x <- (x ^ par2 - 1) / par2
}
} else {
x <- log(x,base=par8)
}
if (par3 > 0) x <- diff(x,lag=1,difference=par3)
if (par4 > 0) x <- diff(x,lag=par5,difference=par4)
bitmap(file='picts.png')
op <- par(mfrow=c(2,1))
plot(ox,type='l',main='Original Time Series',xlab='time',ylab='value')
if (par8=='') {
mytitle <- paste('Working Time Series (lambda=',par2,', d=',par3,', D=',par4,')',sep='')
mysub <- paste('(lambda=',par2,', d=',par3,', D=',par4,', CI=', par7, ', CI type=',par6,')',sep='')
} else {
mytitle <- paste('Working Time Series (base=',par8,', d=',par3,', D=',par4,')',sep='')
mysub <- paste('(base=',par8,', d=',par3,', D=',par4,', CI=', par7, ', CI type=',par6,')',sep='')
}
plot(x,type='l', main=mytitle,xlab='time',ylab='value')
par(op)
dev.off()
bitmap(file='pic1.png')
racf <- acf(x, par1, main='Autocorrelation', xlab='time lag', ylab='ACF', ci.type=par6, ci=par7, sub=mysub)
dev.off()
bitmap(file='pic2.png')
rpacf <- pacf(x,par1,main='Partial Autocorrelation',xlab='lags',ylab='PACF',sub=mysub)
dev.off()
(myacf <- c(racf$acf))
(mypacf <- c(rpacf$acf))
lengthx <- length(x)
sqrtn <- sqrt(lengthx)
load(file='createtable')
a<-table.start()
a<-table.row.start(a)
a<-table.element(a,'Autocorrelation Function',4,TRUE)
a<-table.row.end(a)
a<-table.row.start(a)
a<-table.element(a,'Time lag k',header=TRUE)
a<-table.element(a,hyperlink('basics.htm','ACF(k)','click here for more information about the Autocorrelation Function'),header=TRUE)
a<-table.element(a,'T-STAT',header=TRUE)
a<-table.element(a,'P-value',header=TRUE)
a<-table.row.end(a)
for (i in 2:(par1+1)) {
a<-table.row.start(a)
a<-table.element(a,i-1,header=TRUE)
a<-table.element(a,round(myacf[i],6))
mytstat <- myacf[i]*sqrtn
a<-table.element(a,round(mytstat,4))
a<-table.element(a,round(1-pt(abs(mytstat),lengthx),6))
a<-table.row.end(a)
}
a<-table.end(a)
table.save(a,file='mytable.tab')
a<-table.start()
a<-table.row.start(a)
a<-table.element(a,'Partial Autocorrelation Function',4,TRUE)
a<-table.row.end(a)
a<-table.row.start(a)
a<-table.element(a,'Time lag k',header=TRUE)
a<-table.element(a,hyperlink('basics.htm','PACF(k)','click here for more information about the Partial Autocorrelation Function'),header=TRUE)
a<-table.element(a,'T-STAT',header=TRUE)
a<-table.element(a,'P-value',header=TRUE)
a<-table.row.end(a)
for (i in 1:par1) {
a<-table.row.start(a)
a<-table.element(a,i,header=TRUE)
a<-table.element(a,round(mypacf[i],6))
mytstat <- mypacf[i]*sqrtn
a<-table.element(a,round(mytstat,4))
a<-table.element(a,round(1-pt(abs(mytstat),lengthx),6))
a<-table.row.end(a)
}
a<-table.end(a)
table.save(a,file='mytable1.tab')