Free Statistics

of Irreproducible Research!

Author's title

Author*Unverified author*
R Software Modulerwasp_autocorrelation.wasp
Title produced by software(Partial) Autocorrelation Function
Date of computationTue, 18 Oct 2016 20:54:48 +0100
Cite this page as followsStatistical Computations at FreeStatistics.org, Office for Research Development and Education, URL https://freestatistics.org/blog/index.php?v=date/2016/Oct/18/t1476820510lsgm5ueu5smwe0x.htm/, Retrieved Sun, 28 Apr 2024 15:34:19 +0200
Statistical Computations at FreeStatistics.org, Office for Research Development and Education, URL https://freestatistics.org/blog/index.php?pk=, Retrieved Sun, 28 Apr 2024 15:34:19 +0200
QR Codes:

Original text written by user:
IsPrivate?No (this computation is public)
User-defined keywords
Estimated Impact0
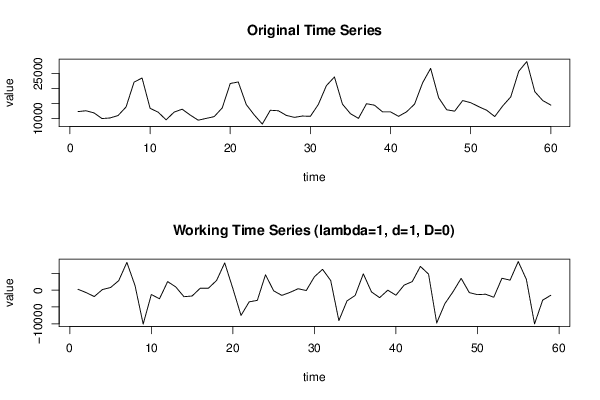
Dataseries X:
12347
12624
11918
10028
10228
11026
13878
22165
23533
13445
12164
9606
12177
13142
11210
9485
10082
10680
13579
21709
22205
14687
11222
8196
12794
12627
11080
10425
10865
10771
14771
20993
23882
14825
11648
10091
14976
14472
12254
12257
10767
12275
14845
21939
26740
16974
12956
12494
16024
15306
13989
12792
10697
14257
17251
25795
29016
18968
16009
14511


Summary of computational transaction
Raw Inputview raw input (R code)
Raw Outputview raw output of R engine
Computing time1 seconds
R Server'George Udny Yule' @ yule.wessa.net

\begin{tabular}{lllllllll}
\hline
Summary of computational transaction \tabularnewline
Raw Input & view raw input (R code)  \tabularnewline
Raw Output & view raw output of R engine  \tabularnewline
Computing time & 1 seconds \tabularnewline
R Server & 'George Udny Yule' @ yule.wessa.net \tabularnewline
\hline
\end{tabular}
%Source: https://freestatistics.org/blog/index.php?pk=&T=0

[TABLE]
[ROW][C]Summary of computational transaction[/C][/ROW]
[ROW][C]Raw Input[/C][C]view raw input (R code) [/C][/ROW]
[ROW][C]Raw Output[/C][C]view raw output of R engine [/C][/ROW]
[ROW][C]Computing time[/C][C]1 seconds[/C][/ROW]
[ROW][C]R Server[/C][C]'George Udny Yule' @ yule.wessa.net[/C][/ROW]
[/TABLE]
Source: https://freestatistics.org/blog/index.php?pk=&T=0

Globally Unique Identifier (entire table): ba.freestatistics.org/blog/index.php?pk=&T=0

As an alternative you can also use a QR Code:  

The GUIDs for individual cells are displayed in the table below:

Summary of computational transaction
Raw Inputview raw input (R code)
Raw Outputview raw output of R engine
Computing time1 seconds
R Server'George Udny Yule' @ yule.wessa.net


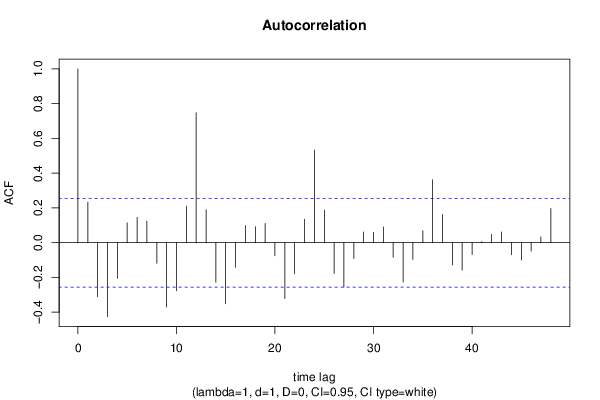
Autocorrelation Function
Time lag kACF(k)T-STATP-value
10.2324811.78570.039642
2-0.310429-2.38450.010169
3-0.425436-3.26780.000905
4-0.204855-1.57350.060473
50.1143160.87810.191731
60.1461281.12240.133114
70.1232120.94640.173901
8-0.117844-0.90520.184526
9-0.370373-2.84490.003049
10-0.276126-2.1210.019069
110.2102141.61470.055857
120.7481255.74650
130.1898421.45820.075044
14-0.227093-1.74430.043154
15-0.351347-2.69870.004532
16-0.140991-1.0830.141614
170.0982560.75470.226711
180.092450.71010.240213
190.1106880.85020.199323
20-0.075074-0.57670.283184
21-0.321365-2.46850.008243
22-0.179018-1.37510.087155
230.1353431.03960.151386
240.5335744.09856.4e-05
250.1878431.44290.077175
26-0.176955-1.35920.089625
27-0.255282-1.96090.027311
28-0.090422-0.69450.245033
290.0618630.47520.318206
300.0598080.45940.323819
310.0903950.69430.245098
32-0.083223-0.63920.262569
33-0.226542-1.74010.043528
34-0.09576-0.73560.232459
350.0693330.53260.29817
360.362072.78110.00363
370.1626431.24930.108247
38-0.128137-0.98420.164509
39-0.15781-1.21220.115142
40-0.067516-0.51860.302989
410.0063330.04860.480684
420.048060.36920.356667
430.0616060.47320.318906
44-0.06918-0.53140.298573
45-0.099062-0.76090.22487
46-0.048339-0.37130.355872
470.0325860.25030.401613
480.1972721.51530.067521

\begin{tabular}{lllllllll}
\hline
Autocorrelation Function \tabularnewline
Time lag k & ACF(k) & T-STAT & P-value \tabularnewline
1 & 0.232481 & 1.7857 & 0.039642 \tabularnewline
2 & -0.310429 & -2.3845 & 0.010169 \tabularnewline
3 & -0.425436 & -3.2678 & 0.000905 \tabularnewline
4 & -0.204855 & -1.5735 & 0.060473 \tabularnewline
5 & 0.114316 & 0.8781 & 0.191731 \tabularnewline
6 & 0.146128 & 1.1224 & 0.133114 \tabularnewline
7 & 0.123212 & 0.9464 & 0.173901 \tabularnewline
8 & -0.117844 & -0.9052 & 0.184526 \tabularnewline
9 & -0.370373 & -2.8449 & 0.003049 \tabularnewline
10 & -0.276126 & -2.121 & 0.019069 \tabularnewline
11 & 0.210214 & 1.6147 & 0.055857 \tabularnewline
12 & 0.748125 & 5.7465 & 0 \tabularnewline
13 & 0.189842 & 1.4582 & 0.075044 \tabularnewline
14 & -0.227093 & -1.7443 & 0.043154 \tabularnewline
15 & -0.351347 & -2.6987 & 0.004532 \tabularnewline
16 & -0.140991 & -1.083 & 0.141614 \tabularnewline
17 & 0.098256 & 0.7547 & 0.226711 \tabularnewline
18 & 0.09245 & 0.7101 & 0.240213 \tabularnewline
19 & 0.110688 & 0.8502 & 0.199323 \tabularnewline
20 & -0.075074 & -0.5767 & 0.283184 \tabularnewline
21 & -0.321365 & -2.4685 & 0.008243 \tabularnewline
22 & -0.179018 & -1.3751 & 0.087155 \tabularnewline
23 & 0.135343 & 1.0396 & 0.151386 \tabularnewline
24 & 0.533574 & 4.0985 & 6.4e-05 \tabularnewline
25 & 0.187843 & 1.4429 & 0.077175 \tabularnewline
26 & -0.176955 & -1.3592 & 0.089625 \tabularnewline
27 & -0.255282 & -1.9609 & 0.027311 \tabularnewline
28 & -0.090422 & -0.6945 & 0.245033 \tabularnewline
29 & 0.061863 & 0.4752 & 0.318206 \tabularnewline
30 & 0.059808 & 0.4594 & 0.323819 \tabularnewline
31 & 0.090395 & 0.6943 & 0.245098 \tabularnewline
32 & -0.083223 & -0.6392 & 0.262569 \tabularnewline
33 & -0.226542 & -1.7401 & 0.043528 \tabularnewline
34 & -0.09576 & -0.7356 & 0.232459 \tabularnewline
35 & 0.069333 & 0.5326 & 0.29817 \tabularnewline
36 & 0.36207 & 2.7811 & 0.00363 \tabularnewline
37 & 0.162643 & 1.2493 & 0.108247 \tabularnewline
38 & -0.128137 & -0.9842 & 0.164509 \tabularnewline
39 & -0.15781 & -1.2122 & 0.115142 \tabularnewline
40 & -0.067516 & -0.5186 & 0.302989 \tabularnewline
41 & 0.006333 & 0.0486 & 0.480684 \tabularnewline
42 & 0.04806 & 0.3692 & 0.356667 \tabularnewline
43 & 0.061606 & 0.4732 & 0.318906 \tabularnewline
44 & -0.06918 & -0.5314 & 0.298573 \tabularnewline
45 & -0.099062 & -0.7609 & 0.22487 \tabularnewline
46 & -0.048339 & -0.3713 & 0.355872 \tabularnewline
47 & 0.032586 & 0.2503 & 0.401613 \tabularnewline
48 & 0.197272 & 1.5153 & 0.067521 \tabularnewline
\hline
\end{tabular}
%Source: https://freestatistics.org/blog/index.php?pk=&T=1

[TABLE]
[ROW][C]Autocorrelation Function[/C][/ROW]
[ROW][C]Time lag k[/C][C]ACF(k)[/C][C]T-STAT[/C][C]P-value[/C][/ROW]
[ROW][C]1[/C][C]0.232481[/C][C]1.7857[/C][C]0.039642[/C][/ROW]
[ROW][C]2[/C][C]-0.310429[/C][C]-2.3845[/C][C]0.010169[/C][/ROW]
[ROW][C]3[/C][C]-0.425436[/C][C]-3.2678[/C][C]0.000905[/C][/ROW]
[ROW][C]4[/C][C]-0.204855[/C][C]-1.5735[/C][C]0.060473[/C][/ROW]
[ROW][C]5[/C][C]0.114316[/C][C]0.8781[/C][C]0.191731[/C][/ROW]
[ROW][C]6[/C][C]0.146128[/C][C]1.1224[/C][C]0.133114[/C][/ROW]
[ROW][C]7[/C][C]0.123212[/C][C]0.9464[/C][C]0.173901[/C][/ROW]
[ROW][C]8[/C][C]-0.117844[/C][C]-0.9052[/C][C]0.184526[/C][/ROW]
[ROW][C]9[/C][C]-0.370373[/C][C]-2.8449[/C][C]0.003049[/C][/ROW]
[ROW][C]10[/C][C]-0.276126[/C][C]-2.121[/C][C]0.019069[/C][/ROW]
[ROW][C]11[/C][C]0.210214[/C][C]1.6147[/C][C]0.055857[/C][/ROW]
[ROW][C]12[/C][C]0.748125[/C][C]5.7465[/C][C]0[/C][/ROW]
[ROW][C]13[/C][C]0.189842[/C][C]1.4582[/C][C]0.075044[/C][/ROW]
[ROW][C]14[/C][C]-0.227093[/C][C]-1.7443[/C][C]0.043154[/C][/ROW]
[ROW][C]15[/C][C]-0.351347[/C][C]-2.6987[/C][C]0.004532[/C][/ROW]
[ROW][C]16[/C][C]-0.140991[/C][C]-1.083[/C][C]0.141614[/C][/ROW]
[ROW][C]17[/C][C]0.098256[/C][C]0.7547[/C][C]0.226711[/C][/ROW]
[ROW][C]18[/C][C]0.09245[/C][C]0.7101[/C][C]0.240213[/C][/ROW]
[ROW][C]19[/C][C]0.110688[/C][C]0.8502[/C][C]0.199323[/C][/ROW]
[ROW][C]20[/C][C]-0.075074[/C][C]-0.5767[/C][C]0.283184[/C][/ROW]
[ROW][C]21[/C][C]-0.321365[/C][C]-2.4685[/C][C]0.008243[/C][/ROW]
[ROW][C]22[/C][C]-0.179018[/C][C]-1.3751[/C][C]0.087155[/C][/ROW]
[ROW][C]23[/C][C]0.135343[/C][C]1.0396[/C][C]0.151386[/C][/ROW]
[ROW][C]24[/C][C]0.533574[/C][C]4.0985[/C][C]6.4e-05[/C][/ROW]
[ROW][C]25[/C][C]0.187843[/C][C]1.4429[/C][C]0.077175[/C][/ROW]
[ROW][C]26[/C][C]-0.176955[/C][C]-1.3592[/C][C]0.089625[/C][/ROW]
[ROW][C]27[/C][C]-0.255282[/C][C]-1.9609[/C][C]0.027311[/C][/ROW]
[ROW][C]28[/C][C]-0.090422[/C][C]-0.6945[/C][C]0.245033[/C][/ROW]
[ROW][C]29[/C][C]0.061863[/C][C]0.4752[/C][C]0.318206[/C][/ROW]
[ROW][C]30[/C][C]0.059808[/C][C]0.4594[/C][C]0.323819[/C][/ROW]
[ROW][C]31[/C][C]0.090395[/C][C]0.6943[/C][C]0.245098[/C][/ROW]
[ROW][C]32[/C][C]-0.083223[/C][C]-0.6392[/C][C]0.262569[/C][/ROW]
[ROW][C]33[/C][C]-0.226542[/C][C]-1.7401[/C][C]0.043528[/C][/ROW]
[ROW][C]34[/C][C]-0.09576[/C][C]-0.7356[/C][C]0.232459[/C][/ROW]
[ROW][C]35[/C][C]0.069333[/C][C]0.5326[/C][C]0.29817[/C][/ROW]
[ROW][C]36[/C][C]0.36207[/C][C]2.7811[/C][C]0.00363[/C][/ROW]
[ROW][C]37[/C][C]0.162643[/C][C]1.2493[/C][C]0.108247[/C][/ROW]
[ROW][C]38[/C][C]-0.128137[/C][C]-0.9842[/C][C]0.164509[/C][/ROW]
[ROW][C]39[/C][C]-0.15781[/C][C]-1.2122[/C][C]0.115142[/C][/ROW]
[ROW][C]40[/C][C]-0.067516[/C][C]-0.5186[/C][C]0.302989[/C][/ROW]
[ROW][C]41[/C][C]0.006333[/C][C]0.0486[/C][C]0.480684[/C][/ROW]
[ROW][C]42[/C][C]0.04806[/C][C]0.3692[/C][C]0.356667[/C][/ROW]
[ROW][C]43[/C][C]0.061606[/C][C]0.4732[/C][C]0.318906[/C][/ROW]
[ROW][C]44[/C][C]-0.06918[/C][C]-0.5314[/C][C]0.298573[/C][/ROW]
[ROW][C]45[/C][C]-0.099062[/C][C]-0.7609[/C][C]0.22487[/C][/ROW]
[ROW][C]46[/C][C]-0.048339[/C][C]-0.3713[/C][C]0.355872[/C][/ROW]
[ROW][C]47[/C][C]0.032586[/C][C]0.2503[/C][C]0.401613[/C][/ROW]
[ROW][C]48[/C][C]0.197272[/C][C]1.5153[/C][C]0.067521[/C][/ROW]
[/TABLE]
Source: https://freestatistics.org/blog/index.php?pk=&T=1

Globally Unique Identifier (entire table): ba.freestatistics.org/blog/index.php?pk=&T=1

As an alternative you can also use a QR Code:  

The GUIDs for individual cells are displayed in the table below:

Autocorrelation Function
Time lag kACF(k)T-STATP-value
10.2324811.78570.039642
2-0.310429-2.38450.010169
3-0.425436-3.26780.000905
4-0.204855-1.57350.060473
50.1143160.87810.191731
60.1461281.12240.133114
70.1232120.94640.173901
8-0.117844-0.90520.184526
9-0.370373-2.84490.003049
10-0.276126-2.1210.019069
110.2102141.61470.055857
120.7481255.74650
130.1898421.45820.075044
14-0.227093-1.74430.043154
15-0.351347-2.69870.004532
16-0.140991-1.0830.141614
170.0982560.75470.226711
180.092450.71010.240213
190.1106880.85020.199323
20-0.075074-0.57670.283184
21-0.321365-2.46850.008243
22-0.179018-1.37510.087155
230.1353431.03960.151386
240.5335744.09856.4e-05
250.1878431.44290.077175
26-0.176955-1.35920.089625
27-0.255282-1.96090.027311
28-0.090422-0.69450.245033
290.0618630.47520.318206
300.0598080.45940.323819
310.0903950.69430.245098
32-0.083223-0.63920.262569
33-0.226542-1.74010.043528
34-0.09576-0.73560.232459
350.0693330.53260.29817
360.362072.78110.00363
370.1626431.24930.108247
38-0.128137-0.98420.164509
39-0.15781-1.21220.115142
40-0.067516-0.51860.302989
410.0063330.04860.480684
420.048060.36920.356667
430.0616060.47320.318906
44-0.06918-0.53140.298573
45-0.099062-0.76090.22487
46-0.048339-0.37130.355872
470.0325860.25030.401613
480.1972721.51530.067521


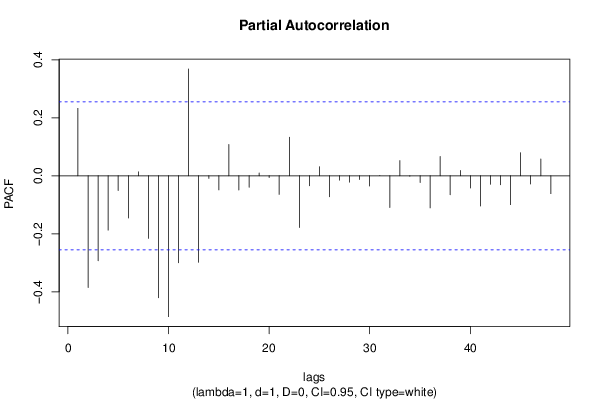
Partial Autocorrelation Function
Time lag kPACF(k)T-STATP-value
10.2324811.78570.039642
2-0.385301-2.95960.002215
3-0.292837-2.24930.014119
4-0.187518-1.44040.077527
5-0.050969-0.39150.348419
6-0.145566-1.11810.134026
70.0135420.1040.458752
8-0.215917-1.65850.051263
9-0.42032-3.22850.001017
10-0.485715-3.73080.000215
11-0.300083-2.3050.012352
120.3684122.82980.003178
13-0.298046-2.28930.012827
14-0.008873-0.06820.472946
15-0.04857-0.37310.355217
160.1078010.8280.205495
17-0.04891-0.37570.354248
18-0.039608-0.30420.381009
190.0098260.07550.470046
20-0.005846-0.04490.482167
21-0.064148-0.49270.312016
220.1330581.0220.155467
23-0.178593-1.37180.08766
24-0.034549-0.26540.395821
250.0311860.23950.405758
26-0.072167-0.55430.290726
27-0.015004-0.11520.454321
28-0.021776-0.16730.433868
29-0.012571-0.09660.4617
30-0.034989-0.26880.394528
310.0003580.00280.498907
32-0.109558-0.84150.201725
330.0523440.40210.344546
34-0.001523-0.01170.495354
35-0.022926-0.17610.430409
36-0.110789-0.8510.199109
370.066660.5120.305272
38-0.06513-0.50030.309373
390.0183560.1410.444178
40-0.042208-0.32420.373463
41-0.10421-0.80050.21333
42-0.029417-0.2260.411007
43-0.030925-0.23750.406531
44-0.099542-0.76460.223781
450.0796270.61160.271568
46-0.028584-0.21960.413486
470.0577880.44390.329378
48-0.061443-0.4720.31935

\begin{tabular}{lllllllll}
\hline
Partial Autocorrelation Function \tabularnewline
Time lag k & PACF(k) & T-STAT & P-value \tabularnewline
1 & 0.232481 & 1.7857 & 0.039642 \tabularnewline
2 & -0.385301 & -2.9596 & 0.002215 \tabularnewline
3 & -0.292837 & -2.2493 & 0.014119 \tabularnewline
4 & -0.187518 & -1.4404 & 0.077527 \tabularnewline
5 & -0.050969 & -0.3915 & 0.348419 \tabularnewline
6 & -0.145566 & -1.1181 & 0.134026 \tabularnewline
7 & 0.013542 & 0.104 & 0.458752 \tabularnewline
8 & -0.215917 & -1.6585 & 0.051263 \tabularnewline
9 & -0.42032 & -3.2285 & 0.001017 \tabularnewline
10 & -0.485715 & -3.7308 & 0.000215 \tabularnewline
11 & -0.300083 & -2.305 & 0.012352 \tabularnewline
12 & 0.368412 & 2.8298 & 0.003178 \tabularnewline
13 & -0.298046 & -2.2893 & 0.012827 \tabularnewline
14 & -0.008873 & -0.0682 & 0.472946 \tabularnewline
15 & -0.04857 & -0.3731 & 0.355217 \tabularnewline
16 & 0.107801 & 0.828 & 0.205495 \tabularnewline
17 & -0.04891 & -0.3757 & 0.354248 \tabularnewline
18 & -0.039608 & -0.3042 & 0.381009 \tabularnewline
19 & 0.009826 & 0.0755 & 0.470046 \tabularnewline
20 & -0.005846 & -0.0449 & 0.482167 \tabularnewline
21 & -0.064148 & -0.4927 & 0.312016 \tabularnewline
22 & 0.133058 & 1.022 & 0.155467 \tabularnewline
23 & -0.178593 & -1.3718 & 0.08766 \tabularnewline
24 & -0.034549 & -0.2654 & 0.395821 \tabularnewline
25 & 0.031186 & 0.2395 & 0.405758 \tabularnewline
26 & -0.072167 & -0.5543 & 0.290726 \tabularnewline
27 & -0.015004 & -0.1152 & 0.454321 \tabularnewline
28 & -0.021776 & -0.1673 & 0.433868 \tabularnewline
29 & -0.012571 & -0.0966 & 0.4617 \tabularnewline
30 & -0.034989 & -0.2688 & 0.394528 \tabularnewline
31 & 0.000358 & 0.0028 & 0.498907 \tabularnewline
32 & -0.109558 & -0.8415 & 0.201725 \tabularnewline
33 & 0.052344 & 0.4021 & 0.344546 \tabularnewline
34 & -0.001523 & -0.0117 & 0.495354 \tabularnewline
35 & -0.022926 & -0.1761 & 0.430409 \tabularnewline
36 & -0.110789 & -0.851 & 0.199109 \tabularnewline
37 & 0.06666 & 0.512 & 0.305272 \tabularnewline
38 & -0.06513 & -0.5003 & 0.309373 \tabularnewline
39 & 0.018356 & 0.141 & 0.444178 \tabularnewline
40 & -0.042208 & -0.3242 & 0.373463 \tabularnewline
41 & -0.10421 & -0.8005 & 0.21333 \tabularnewline
42 & -0.029417 & -0.226 & 0.411007 \tabularnewline
43 & -0.030925 & -0.2375 & 0.406531 \tabularnewline
44 & -0.099542 & -0.7646 & 0.223781 \tabularnewline
45 & 0.079627 & 0.6116 & 0.271568 \tabularnewline
46 & -0.028584 & -0.2196 & 0.413486 \tabularnewline
47 & 0.057788 & 0.4439 & 0.329378 \tabularnewline
48 & -0.061443 & -0.472 & 0.31935 \tabularnewline
\hline
\end{tabular}
%Source: https://freestatistics.org/blog/index.php?pk=&T=2

[TABLE]
[ROW][C]Partial Autocorrelation Function[/C][/ROW]
[ROW][C]Time lag k[/C][C]PACF(k)[/C][C]T-STAT[/C][C]P-value[/C][/ROW]
[ROW][C]1[/C][C]0.232481[/C][C]1.7857[/C][C]0.039642[/C][/ROW]
[ROW][C]2[/C][C]-0.385301[/C][C]-2.9596[/C][C]0.002215[/C][/ROW]
[ROW][C]3[/C][C]-0.292837[/C][C]-2.2493[/C][C]0.014119[/C][/ROW]
[ROW][C]4[/C][C]-0.187518[/C][C]-1.4404[/C][C]0.077527[/C][/ROW]
[ROW][C]5[/C][C]-0.050969[/C][C]-0.3915[/C][C]0.348419[/C][/ROW]
[ROW][C]6[/C][C]-0.145566[/C][C]-1.1181[/C][C]0.134026[/C][/ROW]
[ROW][C]7[/C][C]0.013542[/C][C]0.104[/C][C]0.458752[/C][/ROW]
[ROW][C]8[/C][C]-0.215917[/C][C]-1.6585[/C][C]0.051263[/C][/ROW]
[ROW][C]9[/C][C]-0.42032[/C][C]-3.2285[/C][C]0.001017[/C][/ROW]
[ROW][C]10[/C][C]-0.485715[/C][C]-3.7308[/C][C]0.000215[/C][/ROW]
[ROW][C]11[/C][C]-0.300083[/C][C]-2.305[/C][C]0.012352[/C][/ROW]
[ROW][C]12[/C][C]0.368412[/C][C]2.8298[/C][C]0.003178[/C][/ROW]
[ROW][C]13[/C][C]-0.298046[/C][C]-2.2893[/C][C]0.012827[/C][/ROW]
[ROW][C]14[/C][C]-0.008873[/C][C]-0.0682[/C][C]0.472946[/C][/ROW]
[ROW][C]15[/C][C]-0.04857[/C][C]-0.3731[/C][C]0.355217[/C][/ROW]
[ROW][C]16[/C][C]0.107801[/C][C]0.828[/C][C]0.205495[/C][/ROW]
[ROW][C]17[/C][C]-0.04891[/C][C]-0.3757[/C][C]0.354248[/C][/ROW]
[ROW][C]18[/C][C]-0.039608[/C][C]-0.3042[/C][C]0.381009[/C][/ROW]
[ROW][C]19[/C][C]0.009826[/C][C]0.0755[/C][C]0.470046[/C][/ROW]
[ROW][C]20[/C][C]-0.005846[/C][C]-0.0449[/C][C]0.482167[/C][/ROW]
[ROW][C]21[/C][C]-0.064148[/C][C]-0.4927[/C][C]0.312016[/C][/ROW]
[ROW][C]22[/C][C]0.133058[/C][C]1.022[/C][C]0.155467[/C][/ROW]
[ROW][C]23[/C][C]-0.178593[/C][C]-1.3718[/C][C]0.08766[/C][/ROW]
[ROW][C]24[/C][C]-0.034549[/C][C]-0.2654[/C][C]0.395821[/C][/ROW]
[ROW][C]25[/C][C]0.031186[/C][C]0.2395[/C][C]0.405758[/C][/ROW]
[ROW][C]26[/C][C]-0.072167[/C][C]-0.5543[/C][C]0.290726[/C][/ROW]
[ROW][C]27[/C][C]-0.015004[/C][C]-0.1152[/C][C]0.454321[/C][/ROW]
[ROW][C]28[/C][C]-0.021776[/C][C]-0.1673[/C][C]0.433868[/C][/ROW]
[ROW][C]29[/C][C]-0.012571[/C][C]-0.0966[/C][C]0.4617[/C][/ROW]
[ROW][C]30[/C][C]-0.034989[/C][C]-0.2688[/C][C]0.394528[/C][/ROW]
[ROW][C]31[/C][C]0.000358[/C][C]0.0028[/C][C]0.498907[/C][/ROW]
[ROW][C]32[/C][C]-0.109558[/C][C]-0.8415[/C][C]0.201725[/C][/ROW]
[ROW][C]33[/C][C]0.052344[/C][C]0.4021[/C][C]0.344546[/C][/ROW]
[ROW][C]34[/C][C]-0.001523[/C][C]-0.0117[/C][C]0.495354[/C][/ROW]
[ROW][C]35[/C][C]-0.022926[/C][C]-0.1761[/C][C]0.430409[/C][/ROW]
[ROW][C]36[/C][C]-0.110789[/C][C]-0.851[/C][C]0.199109[/C][/ROW]
[ROW][C]37[/C][C]0.06666[/C][C]0.512[/C][C]0.305272[/C][/ROW]
[ROW][C]38[/C][C]-0.06513[/C][C]-0.5003[/C][C]0.309373[/C][/ROW]
[ROW][C]39[/C][C]0.018356[/C][C]0.141[/C][C]0.444178[/C][/ROW]
[ROW][C]40[/C][C]-0.042208[/C][C]-0.3242[/C][C]0.373463[/C][/ROW]
[ROW][C]41[/C][C]-0.10421[/C][C]-0.8005[/C][C]0.21333[/C][/ROW]
[ROW][C]42[/C][C]-0.029417[/C][C]-0.226[/C][C]0.411007[/C][/ROW]
[ROW][C]43[/C][C]-0.030925[/C][C]-0.2375[/C][C]0.406531[/C][/ROW]
[ROW][C]44[/C][C]-0.099542[/C][C]-0.7646[/C][C]0.223781[/C][/ROW]
[ROW][C]45[/C][C]0.079627[/C][C]0.6116[/C][C]0.271568[/C][/ROW]
[ROW][C]46[/C][C]-0.028584[/C][C]-0.2196[/C][C]0.413486[/C][/ROW]
[ROW][C]47[/C][C]0.057788[/C][C]0.4439[/C][C]0.329378[/C][/ROW]
[ROW][C]48[/C][C]-0.061443[/C][C]-0.472[/C][C]0.31935[/C][/ROW]
[/TABLE]
Source: https://freestatistics.org/blog/index.php?pk=&T=2

Globally Unique Identifier (entire table): ba.freestatistics.org/blog/index.php?pk=&T=2

As an alternative you can also use a QR Code:  

The GUIDs for individual cells are displayed in the table below:

Partial Autocorrelation Function
Time lag kPACF(k)T-STATP-value
10.2324811.78570.039642
2-0.385301-2.95960.002215
3-0.292837-2.24930.014119
4-0.187518-1.44040.077527
5-0.050969-0.39150.348419
6-0.145566-1.11810.134026
70.0135420.1040.458752
8-0.215917-1.65850.051263
9-0.42032-3.22850.001017
10-0.485715-3.73080.000215
11-0.300083-2.3050.012352
120.3684122.82980.003178
13-0.298046-2.28930.012827
14-0.008873-0.06820.472946
15-0.04857-0.37310.355217
160.1078010.8280.205495
17-0.04891-0.37570.354248
18-0.039608-0.30420.381009
190.0098260.07550.470046
20-0.005846-0.04490.482167
21-0.064148-0.49270.312016
220.1330581.0220.155467
23-0.178593-1.37180.08766
24-0.034549-0.26540.395821
250.0311860.23950.405758
26-0.072167-0.55430.290726
27-0.015004-0.11520.454321
28-0.021776-0.16730.433868
29-0.012571-0.09660.4617
30-0.034989-0.26880.394528
310.0003580.00280.498907
32-0.109558-0.84150.201725
330.0523440.40210.344546
34-0.001523-0.01170.495354
35-0.022926-0.17610.430409
36-0.110789-0.8510.199109
370.066660.5120.305272
38-0.06513-0.50030.309373
390.0183560.1410.444178
40-0.042208-0.32420.373463
41-0.10421-0.80050.21333
42-0.029417-0.2260.411007
43-0.030925-0.23750.406531
44-0.099542-0.76460.223781
450.0796270.61160.271568
46-0.028584-0.21960.413486
470.0577880.44390.329378
48-0.061443-0.4720.31935


Parameters (Session):
par1 = 48 ; par2 = 1 ; par3 = 1 ; par4 = 0 ; par5 = 12 ; par6 = White Noise ; par7 = 0.95 ;
Parameters (R input):
par1 = 48 ; par2 = 1 ; par3 = 1 ; par4 = 0 ; par5 = 12 ; par6 = White Noise ; par7 = 0.95 ; par8 = ;
R code (references can be found in the software module):
if (par1 == 'Default') {
par1 = 10*log10(length(x))
} else {
par1 <- as.numeric(par1)
}
par2 <- as.numeric(par2)
par3 <- as.numeric(par3)
par4 <- as.numeric(par4)
par5 <- as.numeric(par5)
if (par6 == 'White Noise') par6 <- 'white' else par6 <- 'ma'
par7 <- as.numeric(par7)
if (par8 != '') par8 <- as.numeric(par8)
x <- na.omit(x)
ox <- x
if (par8 == '') {
if (par2 == 0) {
x <- log(x)
} else {
x <- (x ^ par2 - 1) / par2
}
} else {
x <- log(x,base=par8)
}
if (par3 > 0) x <- diff(x,lag=1,difference=par3)
if (par4 > 0) x <- diff(x,lag=par5,difference=par4)
bitmap(file='picts.png')
op <- par(mfrow=c(2,1))
plot(ox,type='l',main='Original Time Series',xlab='time',ylab='value')
if (par8=='') {
mytitle <- paste('Working Time Series (lambda=',par2,', d=',par3,', D=',par4,')',sep='')
mysub <- paste('(lambda=',par2,', d=',par3,', D=',par4,', CI=', par7, ', CI type=',par6,')',sep='')
} else {
mytitle <- paste('Working Time Series (base=',par8,', d=',par3,', D=',par4,')',sep='')
mysub <- paste('(base=',par8,', d=',par3,', D=',par4,', CI=', par7, ', CI type=',par6,')',sep='')
}
plot(x,type='l', main=mytitle,xlab='time',ylab='value')
par(op)
dev.off()
bitmap(file='pic1.png')
racf <- acf(x, par1, main='Autocorrelation', xlab='time lag', ylab='ACF', ci.type=par6, ci=par7, sub=mysub)
dev.off()
bitmap(file='pic2.png')
rpacf <- pacf(x,par1,main='Partial Autocorrelation',xlab='lags',ylab='PACF',sub=mysub)
dev.off()
(myacf <- c(racf$acf))
(mypacf <- c(rpacf$acf))
lengthx <- length(x)
sqrtn <- sqrt(lengthx)
load(file='createtable')
a<-table.start()
a<-table.row.start(a)
a<-table.element(a,'Autocorrelation Function',4,TRUE)
a<-table.row.end(a)
a<-table.row.start(a)
a<-table.element(a,'Time lag k',header=TRUE)
a<-table.element(a,hyperlink('basics.htm','ACF(k)','click here for more information about the Autocorrelation Function'),header=TRUE)
a<-table.element(a,'T-STAT',header=TRUE)
a<-table.element(a,'P-value',header=TRUE)
a<-table.row.end(a)
for (i in 2:(par1+1)) {
a<-table.row.start(a)
a<-table.element(a,i-1,header=TRUE)
a<-table.element(a,round(myacf[i],6))
mytstat <- myacf[i]*sqrtn
a<-table.element(a,round(mytstat,4))
a<-table.element(a,round(1-pt(abs(mytstat),lengthx),6))
a<-table.row.end(a)
}
a<-table.end(a)
table.save(a,file='mytable.tab')
a<-table.start()
a<-table.row.start(a)
a<-table.element(a,'Partial Autocorrelation Function',4,TRUE)
a<-table.row.end(a)
a<-table.row.start(a)
a<-table.element(a,'Time lag k',header=TRUE)
a<-table.element(a,hyperlink('basics.htm','PACF(k)','click here for more information about the Partial Autocorrelation Function'),header=TRUE)
a<-table.element(a,'T-STAT',header=TRUE)
a<-table.element(a,'P-value',header=TRUE)
a<-table.row.end(a)
for (i in 1:par1) {
a<-table.row.start(a)
a<-table.element(a,i,header=TRUE)
a<-table.element(a,round(mypacf[i],6))
mytstat <- mypacf[i]*sqrtn
a<-table.element(a,round(mytstat,4))
a<-table.element(a,round(1-pt(abs(mytstat),lengthx),6))
a<-table.row.end(a)
}
a<-table.end(a)
table.save(a,file='mytable1.tab')