Free Statistics

of Irreproducible Research!

Author's title

Author*Unverified author*
R Software Modulerwasp_autocorrelation.wasp
Title produced by software(Partial) Autocorrelation Function
Date of computationTue, 18 Oct 2016 21:42:58 +0100
Cite this page as followsStatistical Computations at FreeStatistics.org, Office for Research Development and Education, URL https://freestatistics.org/blog/index.php?v=date/2016/Oct/18/t1476823390mmjxwm546l1i4of.htm/, Retrieved Sat, 27 Apr 2024 23:25:43 +0200
Statistical Computations at FreeStatistics.org, Office for Research Development and Education, URL https://freestatistics.org/blog/index.php?pk=, Retrieved Sat, 27 Apr 2024 23:25:43 +0200
QR Codes:

Original text written by user:
IsPrivate?No (this computation is public)
User-defined keywords
Estimated Impact0
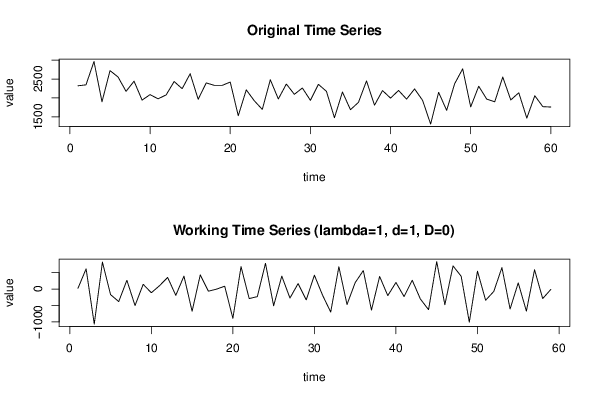
Dataseries X:
2322
2347
2963
1900
2723
2555
2176
2444
1944
2089
1978
2081
2435
2246
2641
1966
2398
2334
2333
2421
1531
2215
1927
1698
2482
1974
2369
2097
2264
1938
2360
2176
1478
2158
1690
1886
2450
1811
2196
1997
2199
1970
2239
1937
1311
2149
1673
2378
2770
1764
2310
1971
1899
2554
1948
2138
1469
2059
1771
1761


Summary of computational transaction
Raw Inputview raw input (R code)
Raw Outputview raw output of R engine
Computing time1 seconds
R Server'George Udny Yule' @ yule.wessa.net

\begin{tabular}{lllllllll}
\hline
Summary of computational transaction \tabularnewline
Raw Input & view raw input (R code)  \tabularnewline
Raw Output & view raw output of R engine  \tabularnewline
Computing time & 1 seconds \tabularnewline
R Server & 'George Udny Yule' @ yule.wessa.net \tabularnewline
\hline
\end{tabular}
%Source: https://freestatistics.org/blog/index.php?pk=&T=0

[TABLE]
[ROW][C]Summary of computational transaction[/C][/ROW]
[ROW][C]Raw Input[/C][C]view raw input (R code) [/C][/ROW]
[ROW][C]Raw Output[/C][C]view raw output of R engine [/C][/ROW]
[ROW][C]Computing time[/C][C]1 seconds[/C][/ROW]
[ROW][C]R Server[/C][C]'George Udny Yule' @ yule.wessa.net[/C][/ROW]
[/TABLE]
Source: https://freestatistics.org/blog/index.php?pk=&T=0

Globally Unique Identifier (entire table): ba.freestatistics.org/blog/index.php?pk=&T=0

As an alternative you can also use a QR Code:  

The GUIDs for individual cells are displayed in the table below:

Summary of computational transaction
Raw Inputview raw input (R code)
Raw Outputview raw output of R engine
Computing time1 seconds
R Server'George Udny Yule' @ yule.wessa.net


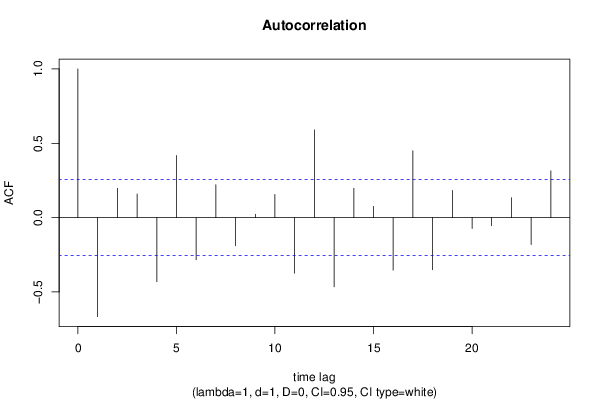
Autocorrelation Function
Time lag kACF(k)T-STATP-value
1-0.666209-5.11722e-06
20.1976711.51830.067135
30.1590441.22160.113352
4-0.431763-3.31640.000782
50.4180773.21130.00107
6-0.283736-2.17940.016652
70.2209051.69680.047502
8-0.189908-1.45870.074974
90.0224990.17280.431692
100.155391.19360.118711
11-0.37351-2.8690.002853
120.5904274.53521.4e-05
13-0.465752-3.57750.00035
140.1974591.51670.06734
150.0756240.58090.281766
16-0.353537-2.71560.004333
170.4493813.45180.000518
18-0.350707-2.69380.004592
190.1824931.40180.083114
20-0.07347-0.56430.287334
21-0.054744-0.42050.337825
220.1332831.02380.155062
23-0.180795-1.38870.08507
240.3146692.4170.009379

\begin{tabular}{lllllllll}
\hline
Autocorrelation Function \tabularnewline
Time lag k & ACF(k) & T-STAT & P-value \tabularnewline
1 & -0.666209 & -5.1172 & 2e-06 \tabularnewline
2 & 0.197671 & 1.5183 & 0.067135 \tabularnewline
3 & 0.159044 & 1.2216 & 0.113352 \tabularnewline
4 & -0.431763 & -3.3164 & 0.000782 \tabularnewline
5 & 0.418077 & 3.2113 & 0.00107 \tabularnewline
6 & -0.283736 & -2.1794 & 0.016652 \tabularnewline
7 & 0.220905 & 1.6968 & 0.047502 \tabularnewline
8 & -0.189908 & -1.4587 & 0.074974 \tabularnewline
9 & 0.022499 & 0.1728 & 0.431692 \tabularnewline
10 & 0.15539 & 1.1936 & 0.118711 \tabularnewline
11 & -0.37351 & -2.869 & 0.002853 \tabularnewline
12 & 0.590427 & 4.5352 & 1.4e-05 \tabularnewline
13 & -0.465752 & -3.5775 & 0.00035 \tabularnewline
14 & 0.197459 & 1.5167 & 0.06734 \tabularnewline
15 & 0.075624 & 0.5809 & 0.281766 \tabularnewline
16 & -0.353537 & -2.7156 & 0.004333 \tabularnewline
17 & 0.449381 & 3.4518 & 0.000518 \tabularnewline
18 & -0.350707 & -2.6938 & 0.004592 \tabularnewline
19 & 0.182493 & 1.4018 & 0.083114 \tabularnewline
20 & -0.07347 & -0.5643 & 0.287334 \tabularnewline
21 & -0.054744 & -0.4205 & 0.337825 \tabularnewline
22 & 0.133283 & 1.0238 & 0.155062 \tabularnewline
23 & -0.180795 & -1.3887 & 0.08507 \tabularnewline
24 & 0.314669 & 2.417 & 0.009379 \tabularnewline
\hline
\end{tabular}
%Source: https://freestatistics.org/blog/index.php?pk=&T=1

[TABLE]
[ROW][C]Autocorrelation Function[/C][/ROW]
[ROW][C]Time lag k[/C][C]ACF(k)[/C][C]T-STAT[/C][C]P-value[/C][/ROW]
[ROW][C]1[/C][C]-0.666209[/C][C]-5.1172[/C][C]2e-06[/C][/ROW]
[ROW][C]2[/C][C]0.197671[/C][C]1.5183[/C][C]0.067135[/C][/ROW]
[ROW][C]3[/C][C]0.159044[/C][C]1.2216[/C][C]0.113352[/C][/ROW]
[ROW][C]4[/C][C]-0.431763[/C][C]-3.3164[/C][C]0.000782[/C][/ROW]
[ROW][C]5[/C][C]0.418077[/C][C]3.2113[/C][C]0.00107[/C][/ROW]
[ROW][C]6[/C][C]-0.283736[/C][C]-2.1794[/C][C]0.016652[/C][/ROW]
[ROW][C]7[/C][C]0.220905[/C][C]1.6968[/C][C]0.047502[/C][/ROW]
[ROW][C]8[/C][C]-0.189908[/C][C]-1.4587[/C][C]0.074974[/C][/ROW]
[ROW][C]9[/C][C]0.022499[/C][C]0.1728[/C][C]0.431692[/C][/ROW]
[ROW][C]10[/C][C]0.15539[/C][C]1.1936[/C][C]0.118711[/C][/ROW]
[ROW][C]11[/C][C]-0.37351[/C][C]-2.869[/C][C]0.002853[/C][/ROW]
[ROW][C]12[/C][C]0.590427[/C][C]4.5352[/C][C]1.4e-05[/C][/ROW]
[ROW][C]13[/C][C]-0.465752[/C][C]-3.5775[/C][C]0.00035[/C][/ROW]
[ROW][C]14[/C][C]0.197459[/C][C]1.5167[/C][C]0.06734[/C][/ROW]
[ROW][C]15[/C][C]0.075624[/C][C]0.5809[/C][C]0.281766[/C][/ROW]
[ROW][C]16[/C][C]-0.353537[/C][C]-2.7156[/C][C]0.004333[/C][/ROW]
[ROW][C]17[/C][C]0.449381[/C][C]3.4518[/C][C]0.000518[/C][/ROW]
[ROW][C]18[/C][C]-0.350707[/C][C]-2.6938[/C][C]0.004592[/C][/ROW]
[ROW][C]19[/C][C]0.182493[/C][C]1.4018[/C][C]0.083114[/C][/ROW]
[ROW][C]20[/C][C]-0.07347[/C][C]-0.5643[/C][C]0.287334[/C][/ROW]
[ROW][C]21[/C][C]-0.054744[/C][C]-0.4205[/C][C]0.337825[/C][/ROW]
[ROW][C]22[/C][C]0.133283[/C][C]1.0238[/C][C]0.155062[/C][/ROW]
[ROW][C]23[/C][C]-0.180795[/C][C]-1.3887[/C][C]0.08507[/C][/ROW]
[ROW][C]24[/C][C]0.314669[/C][C]2.417[/C][C]0.009379[/C][/ROW]
[/TABLE]
Source: https://freestatistics.org/blog/index.php?pk=&T=1

Globally Unique Identifier (entire table): ba.freestatistics.org/blog/index.php?pk=&T=1

As an alternative you can also use a QR Code:  

The GUIDs for individual cells are displayed in the table below:

Autocorrelation Function
Time lag kACF(k)T-STATP-value
1-0.666209-5.11722e-06
20.1976711.51830.067135
30.1590441.22160.113352
4-0.431763-3.31640.000782
50.4180773.21130.00107
6-0.283736-2.17940.016652
70.2209051.69680.047502
8-0.189908-1.45870.074974
90.0224990.17280.431692
100.155391.19360.118711
11-0.37351-2.8690.002853
120.5904274.53521.4e-05
13-0.465752-3.57750.00035
140.1974591.51670.06734
150.0756240.58090.281766
16-0.353537-2.71560.004333
170.4493813.45180.000518
18-0.350707-2.69380.004592
190.1824931.40180.083114
20-0.07347-0.56430.287334
21-0.054744-0.42050.337825
220.1332831.02380.155062
23-0.180795-1.38870.08507
240.3146692.4170.009379


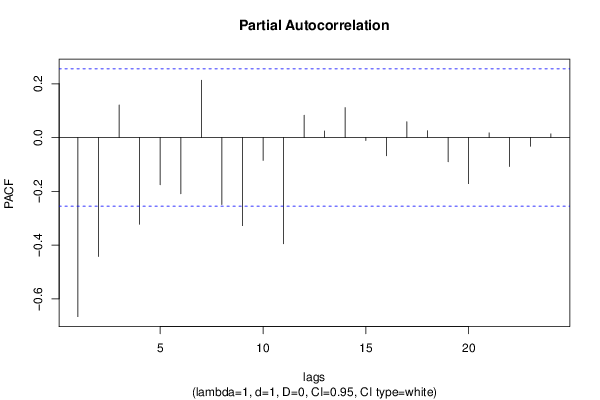
Partial Autocorrelation Function
Time lag kPACF(k)T-STATP-value
1-0.666209-5.11722e-06
2-0.442609-3.39970.000607
30.1210850.93010.178061
4-0.322878-2.48010.008005
5-0.175677-1.34940.091181
6-0.209134-1.60640.056764
70.2129621.63580.053604
8-0.248812-1.91120.030423
9-0.327699-2.51710.007285
10-0.08508-0.65350.257982
11-0.395262-3.03610.001782
120.0832990.63980.262379
130.0243160.18680.42624
140.1113870.85560.197846
15-0.010828-0.08320.466999
16-0.067522-0.51860.302973
170.0587420.45120.326748
180.0253330.19460.423193
19-0.090044-0.69160.245938
20-0.171501-1.31730.096411
210.0175350.13470.446657
22-0.107418-0.82510.206321
23-0.032141-0.24690.402929
240.0136550.10490.458411

\begin{tabular}{lllllllll}
\hline
Partial Autocorrelation Function \tabularnewline
Time lag k & PACF(k) & T-STAT & P-value \tabularnewline
1 & -0.666209 & -5.1172 & 2e-06 \tabularnewline
2 & -0.442609 & -3.3997 & 0.000607 \tabularnewline
3 & 0.121085 & 0.9301 & 0.178061 \tabularnewline
4 & -0.322878 & -2.4801 & 0.008005 \tabularnewline
5 & -0.175677 & -1.3494 & 0.091181 \tabularnewline
6 & -0.209134 & -1.6064 & 0.056764 \tabularnewline
7 & 0.212962 & 1.6358 & 0.053604 \tabularnewline
8 & -0.248812 & -1.9112 & 0.030423 \tabularnewline
9 & -0.327699 & -2.5171 & 0.007285 \tabularnewline
10 & -0.08508 & -0.6535 & 0.257982 \tabularnewline
11 & -0.395262 & -3.0361 & 0.001782 \tabularnewline
12 & 0.083299 & 0.6398 & 0.262379 \tabularnewline
13 & 0.024316 & 0.1868 & 0.42624 \tabularnewline
14 & 0.111387 & 0.8556 & 0.197846 \tabularnewline
15 & -0.010828 & -0.0832 & 0.466999 \tabularnewline
16 & -0.067522 & -0.5186 & 0.302973 \tabularnewline
17 & 0.058742 & 0.4512 & 0.326748 \tabularnewline
18 & 0.025333 & 0.1946 & 0.423193 \tabularnewline
19 & -0.090044 & -0.6916 & 0.245938 \tabularnewline
20 & -0.171501 & -1.3173 & 0.096411 \tabularnewline
21 & 0.017535 & 0.1347 & 0.446657 \tabularnewline
22 & -0.107418 & -0.8251 & 0.206321 \tabularnewline
23 & -0.032141 & -0.2469 & 0.402929 \tabularnewline
24 & 0.013655 & 0.1049 & 0.458411 \tabularnewline
\hline
\end{tabular}
%Source: https://freestatistics.org/blog/index.php?pk=&T=2

[TABLE]
[ROW][C]Partial Autocorrelation Function[/C][/ROW]
[ROW][C]Time lag k[/C][C]PACF(k)[/C][C]T-STAT[/C][C]P-value[/C][/ROW]
[ROW][C]1[/C][C]-0.666209[/C][C]-5.1172[/C][C]2e-06[/C][/ROW]
[ROW][C]2[/C][C]-0.442609[/C][C]-3.3997[/C][C]0.000607[/C][/ROW]
[ROW][C]3[/C][C]0.121085[/C][C]0.9301[/C][C]0.178061[/C][/ROW]
[ROW][C]4[/C][C]-0.322878[/C][C]-2.4801[/C][C]0.008005[/C][/ROW]
[ROW][C]5[/C][C]-0.175677[/C][C]-1.3494[/C][C]0.091181[/C][/ROW]
[ROW][C]6[/C][C]-0.209134[/C][C]-1.6064[/C][C]0.056764[/C][/ROW]
[ROW][C]7[/C][C]0.212962[/C][C]1.6358[/C][C]0.053604[/C][/ROW]
[ROW][C]8[/C][C]-0.248812[/C][C]-1.9112[/C][C]0.030423[/C][/ROW]
[ROW][C]9[/C][C]-0.327699[/C][C]-2.5171[/C][C]0.007285[/C][/ROW]
[ROW][C]10[/C][C]-0.08508[/C][C]-0.6535[/C][C]0.257982[/C][/ROW]
[ROW][C]11[/C][C]-0.395262[/C][C]-3.0361[/C][C]0.001782[/C][/ROW]
[ROW][C]12[/C][C]0.083299[/C][C]0.6398[/C][C]0.262379[/C][/ROW]
[ROW][C]13[/C][C]0.024316[/C][C]0.1868[/C][C]0.42624[/C][/ROW]
[ROW][C]14[/C][C]0.111387[/C][C]0.8556[/C][C]0.197846[/C][/ROW]
[ROW][C]15[/C][C]-0.010828[/C][C]-0.0832[/C][C]0.466999[/C][/ROW]
[ROW][C]16[/C][C]-0.067522[/C][C]-0.5186[/C][C]0.302973[/C][/ROW]
[ROW][C]17[/C][C]0.058742[/C][C]0.4512[/C][C]0.326748[/C][/ROW]
[ROW][C]18[/C][C]0.025333[/C][C]0.1946[/C][C]0.423193[/C][/ROW]
[ROW][C]19[/C][C]-0.090044[/C][C]-0.6916[/C][C]0.245938[/C][/ROW]
[ROW][C]20[/C][C]-0.171501[/C][C]-1.3173[/C][C]0.096411[/C][/ROW]
[ROW][C]21[/C][C]0.017535[/C][C]0.1347[/C][C]0.446657[/C][/ROW]
[ROW][C]22[/C][C]-0.107418[/C][C]-0.8251[/C][C]0.206321[/C][/ROW]
[ROW][C]23[/C][C]-0.032141[/C][C]-0.2469[/C][C]0.402929[/C][/ROW]
[ROW][C]24[/C][C]0.013655[/C][C]0.1049[/C][C]0.458411[/C][/ROW]
[/TABLE]
Source: https://freestatistics.org/blog/index.php?pk=&T=2

Globally Unique Identifier (entire table): ba.freestatistics.org/blog/index.php?pk=&T=2

As an alternative you can also use a QR Code:  

The GUIDs for individual cells are displayed in the table below:

Partial Autocorrelation Function
Time lag kPACF(k)T-STATP-value
1-0.666209-5.11722e-06
2-0.442609-3.39970.000607
30.1210850.93010.178061
4-0.322878-2.48010.008005
5-0.175677-1.34940.091181
6-0.209134-1.60640.056764
70.2129621.63580.053604
8-0.248812-1.91120.030423
9-0.327699-2.51710.007285
10-0.08508-0.65350.257982
11-0.395262-3.03610.001782
120.0832990.63980.262379
130.0243160.18680.42624
140.1113870.85560.197846
15-0.010828-0.08320.466999
16-0.067522-0.51860.302973
170.0587420.45120.326748
180.0253330.19460.423193
19-0.090044-0.69160.245938
20-0.171501-1.31730.096411
210.0175350.13470.446657
22-0.107418-0.82510.206321
23-0.032141-0.24690.402929
240.0136550.10490.458411


Parameters (Session):
par1 = 24 ; par2 = 1 ; par3 = 1 ; par4 = 0 ; par5 = 12 ; par6 = White Noise ; par7 = 0.95 ;
Parameters (R input):
par1 = 24 ; par2 = 1 ; par3 = 1 ; par4 = 0 ; par5 = 12 ; par6 = White Noise ; par7 = 0.95 ; par8 = ;
R code (references can be found in the software module):
if (par1 == 'Default') {
par1 = 10*log10(length(x))
} else {
par1 <- as.numeric(par1)
}
par2 <- as.numeric(par2)
par3 <- as.numeric(par3)
par4 <- as.numeric(par4)
par5 <- as.numeric(par5)
if (par6 == 'White Noise') par6 <- 'white' else par6 <- 'ma'
par7 <- as.numeric(par7)
if (par8 != '') par8 <- as.numeric(par8)
x <- na.omit(x)
ox <- x
if (par8 == '') {
if (par2 == 0) {
x <- log(x)
} else {
x <- (x ^ par2 - 1) / par2
}
} else {
x <- log(x,base=par8)
}
if (par3 > 0) x <- diff(x,lag=1,difference=par3)
if (par4 > 0) x <- diff(x,lag=par5,difference=par4)
bitmap(file='picts.png')
op <- par(mfrow=c(2,1))
plot(ox,type='l',main='Original Time Series',xlab='time',ylab='value')
if (par8=='') {
mytitle <- paste('Working Time Series (lambda=',par2,', d=',par3,', D=',par4,')',sep='')
mysub <- paste('(lambda=',par2,', d=',par3,', D=',par4,', CI=', par7, ', CI type=',par6,')',sep='')
} else {
mytitle <- paste('Working Time Series (base=',par8,', d=',par3,', D=',par4,')',sep='')
mysub <- paste('(base=',par8,', d=',par3,', D=',par4,', CI=', par7, ', CI type=',par6,')',sep='')
}
plot(x,type='l', main=mytitle,xlab='time',ylab='value')
par(op)
dev.off()
bitmap(file='pic1.png')
racf <- acf(x, par1, main='Autocorrelation', xlab='time lag', ylab='ACF', ci.type=par6, ci=par7, sub=mysub)
dev.off()
bitmap(file='pic2.png')
rpacf <- pacf(x,par1,main='Partial Autocorrelation',xlab='lags',ylab='PACF',sub=mysub)
dev.off()
(myacf <- c(racf$acf))
(mypacf <- c(rpacf$acf))
lengthx <- length(x)
sqrtn <- sqrt(lengthx)
load(file='createtable')
a<-table.start()
a<-table.row.start(a)
a<-table.element(a,'Autocorrelation Function',4,TRUE)
a<-table.row.end(a)
a<-table.row.start(a)
a<-table.element(a,'Time lag k',header=TRUE)
a<-table.element(a,hyperlink('basics.htm','ACF(k)','click here for more information about the Autocorrelation Function'),header=TRUE)
a<-table.element(a,'T-STAT',header=TRUE)
a<-table.element(a,'P-value',header=TRUE)
a<-table.row.end(a)
for (i in 2:(par1+1)) {
a<-table.row.start(a)
a<-table.element(a,i-1,header=TRUE)
a<-table.element(a,round(myacf[i],6))
mytstat <- myacf[i]*sqrtn
a<-table.element(a,round(mytstat,4))
a<-table.element(a,round(1-pt(abs(mytstat),lengthx),6))
a<-table.row.end(a)
}
a<-table.end(a)
table.save(a,file='mytable.tab')
a<-table.start()
a<-table.row.start(a)
a<-table.element(a,'Partial Autocorrelation Function',4,TRUE)
a<-table.row.end(a)
a<-table.row.start(a)
a<-table.element(a,'Time lag k',header=TRUE)
a<-table.element(a,hyperlink('basics.htm','PACF(k)','click here for more information about the Partial Autocorrelation Function'),header=TRUE)
a<-table.element(a,'T-STAT',header=TRUE)
a<-table.element(a,'P-value',header=TRUE)
a<-table.row.end(a)
for (i in 1:par1) {
a<-table.row.start(a)
a<-table.element(a,i,header=TRUE)
a<-table.element(a,round(mypacf[i],6))
mytstat <- mypacf[i]*sqrtn
a<-table.element(a,round(mytstat,4))
a<-table.element(a,round(1-pt(abs(mytstat),lengthx),6))
a<-table.row.end(a)
}
a<-table.end(a)
table.save(a,file='mytable1.tab')