Free Statistics

of Irreproducible Research!

Author's title

Author*Unverified author*
R Software Modulerwasp_autocorrelation.wasp
Title produced by software(Partial) Autocorrelation Function
Date of computationTue, 18 Oct 2016 22:36:44 +0100
Cite this page as followsStatistical Computations at FreeStatistics.org, Office for Research Development and Education, URL https://freestatistics.org/blog/index.php?v=date/2016/Oct/18/t1476826644drtxet6bume1app.htm/, Retrieved Sun, 28 Apr 2024 17:47:53 +0200
Statistical Computations at FreeStatistics.org, Office for Research Development and Education, URL https://freestatistics.org/blog/index.php?pk=, Retrieved Sun, 28 Apr 2024 17:47:53 +0200
QR Codes:

Original text written by user:
IsPrivate?No (this computation is public)
User-defined keywords
Estimated Impact0
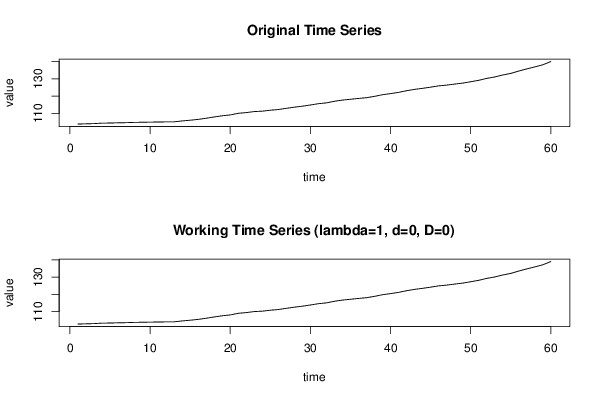
Dataseries X:
103,75
103,89
104,01
104,28
104,34
104,48
104,56
104,71
104,79
104,87
104,95
105
105,05
105,57
105,98
106,45
107,13
107,87
108,56
109,04
109,98
110,4
110,99
111,23
111,76
112,18
112,88
113,54
114,11
114,8
115,56
116,03
116,98
117,65
118,12
118,6
119,03
119,82
120,76
121,4
122,12
123,08
123,86
124,46
125,14
125,89
126,32
126,93
127,48
128,28
129,11
130,23
131,04
132,2
133,12
134,48
135,74
136,88
138,12
139,99


Summary of computational transaction
Raw Inputview raw input (R code)
Raw Outputview raw output of R engine
Computing time2 seconds
R Server'Sir Ronald Aylmer Fisher' @ fisher.wessa.net

\begin{tabular}{lllllllll}
\hline
Summary of computational transaction \tabularnewline
Raw Input & view raw input (R code)  \tabularnewline
Raw Output & view raw output of R engine  \tabularnewline
Computing time & 2 seconds \tabularnewline
R Server & 'Sir Ronald Aylmer Fisher' @ fisher.wessa.net \tabularnewline
\hline
\end{tabular}
%Source: https://freestatistics.org/blog/index.php?pk=&T=0

[TABLE]
[ROW][C]Summary of computational transaction[/C][/ROW]
[ROW][C]Raw Input[/C][C]view raw input (R code) [/C][/ROW]
[ROW][C]Raw Output[/C][C]view raw output of R engine [/C][/ROW]
[ROW][C]Computing time[/C][C]2 seconds[/C][/ROW]
[ROW][C]R Server[/C][C]'Sir Ronald Aylmer Fisher' @ fisher.wessa.net[/C][/ROW]
[/TABLE]
Source: https://freestatistics.org/blog/index.php?pk=&T=0

Globally Unique Identifier (entire table): ba.freestatistics.org/blog/index.php?pk=&T=0

As an alternative you can also use a QR Code:  

The GUIDs for individual cells are displayed in the table below:

Summary of computational transaction
Raw Inputview raw input (R code)
Raw Outputview raw output of R engine
Computing time2 seconds
R Server'Sir Ronald Aylmer Fisher' @ fisher.wessa.net


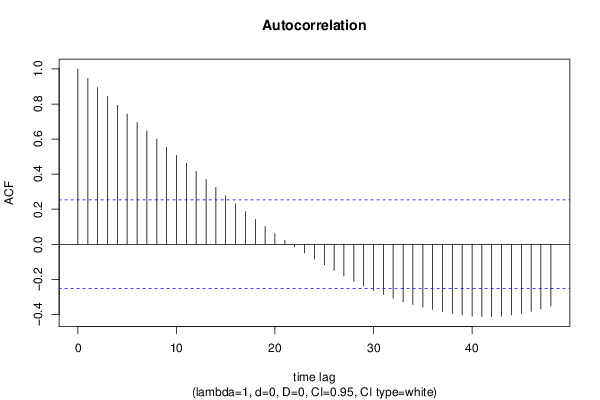
Autocorrelation Function
Time lag kACF(k)T-STATP-value
10.9456097.32470
20.8938916.9240
30.8427626.5280
40.7923346.13740
50.7427355.75320
60.6947365.38141e-06
70.6467655.00983e-06
80.5999794.64749e-06
90.5530714.28413.4e-05
100.5072523.92920.000112
110.4615733.57530.000349
120.415953.22190.001029
130.3695062.86220.002893
140.3234272.50530.007484
150.2769082.14490.018009
160.231231.79110.039161
170.1866691.44590.0767
180.1430711.10820.136094
190.1010410.78270.218452
200.0609160.47190.319371
210.0228810.17720.429961
22-0.014368-0.11130.455877
23-0.049319-0.3820.351898
24-0.083092-0.64360.261135
25-0.11633-0.90110.185571
26-0.14905-1.15450.126429
27-0.180662-1.39940.083421
28-0.210532-1.63080.054088
29-0.237669-1.8410.035285
30-0.263501-2.04110.022825
31-0.286751-2.22120.015063
32-0.308177-2.38710.010074
33-0.327173-2.53430.006948
34-0.343937-2.66410.004949
35-0.358617-2.77780.003646
36-0.372167-2.88280.002732
37-0.38422-2.97620.002102
38-0.395098-3.06040.001652
39-0.40324-3.12350.001376
40-0.409786-3.17420.001186
41-0.412618-3.19610.001111
42-0.412777-3.19740.001107
43-0.409807-3.17430.001185
44-0.403734-3.12730.00136
45-0.394477-3.05560.001675
46-0.382533-2.96310.002181
47-0.368683-2.85580.002944
48-0.352067-2.72710.004183

\begin{tabular}{lllllllll}
\hline
Autocorrelation Function \tabularnewline
Time lag k & ACF(k) & T-STAT & P-value \tabularnewline
1 & 0.945609 & 7.3247 & 0 \tabularnewline
2 & 0.893891 & 6.924 & 0 \tabularnewline
3 & 0.842762 & 6.528 & 0 \tabularnewline
4 & 0.792334 & 6.1374 & 0 \tabularnewline
5 & 0.742735 & 5.7532 & 0 \tabularnewline
6 & 0.694736 & 5.3814 & 1e-06 \tabularnewline
7 & 0.646765 & 5.0098 & 3e-06 \tabularnewline
8 & 0.599979 & 4.6474 & 9e-06 \tabularnewline
9 & 0.553071 & 4.2841 & 3.4e-05 \tabularnewline
10 & 0.507252 & 3.9292 & 0.000112 \tabularnewline
11 & 0.461573 & 3.5753 & 0.000349 \tabularnewline
12 & 0.41595 & 3.2219 & 0.001029 \tabularnewline
13 & 0.369506 & 2.8622 & 0.002893 \tabularnewline
14 & 0.323427 & 2.5053 & 0.007484 \tabularnewline
15 & 0.276908 & 2.1449 & 0.018009 \tabularnewline
16 & 0.23123 & 1.7911 & 0.039161 \tabularnewline
17 & 0.186669 & 1.4459 & 0.0767 \tabularnewline
18 & 0.143071 & 1.1082 & 0.136094 \tabularnewline
19 & 0.101041 & 0.7827 & 0.218452 \tabularnewline
20 & 0.060916 & 0.4719 & 0.319371 \tabularnewline
21 & 0.022881 & 0.1772 & 0.429961 \tabularnewline
22 & -0.014368 & -0.1113 & 0.455877 \tabularnewline
23 & -0.049319 & -0.382 & 0.351898 \tabularnewline
24 & -0.083092 & -0.6436 & 0.261135 \tabularnewline
25 & -0.11633 & -0.9011 & 0.185571 \tabularnewline
26 & -0.14905 & -1.1545 & 0.126429 \tabularnewline
27 & -0.180662 & -1.3994 & 0.083421 \tabularnewline
28 & -0.210532 & -1.6308 & 0.054088 \tabularnewline
29 & -0.237669 & -1.841 & 0.035285 \tabularnewline
30 & -0.263501 & -2.0411 & 0.022825 \tabularnewline
31 & -0.286751 & -2.2212 & 0.015063 \tabularnewline
32 & -0.308177 & -2.3871 & 0.010074 \tabularnewline
33 & -0.327173 & -2.5343 & 0.006948 \tabularnewline
34 & -0.343937 & -2.6641 & 0.004949 \tabularnewline
35 & -0.358617 & -2.7778 & 0.003646 \tabularnewline
36 & -0.372167 & -2.8828 & 0.002732 \tabularnewline
37 & -0.38422 & -2.9762 & 0.002102 \tabularnewline
38 & -0.395098 & -3.0604 & 0.001652 \tabularnewline
39 & -0.40324 & -3.1235 & 0.001376 \tabularnewline
40 & -0.409786 & -3.1742 & 0.001186 \tabularnewline
41 & -0.412618 & -3.1961 & 0.001111 \tabularnewline
42 & -0.412777 & -3.1974 & 0.001107 \tabularnewline
43 & -0.409807 & -3.1743 & 0.001185 \tabularnewline
44 & -0.403734 & -3.1273 & 0.00136 \tabularnewline
45 & -0.394477 & -3.0556 & 0.001675 \tabularnewline
46 & -0.382533 & -2.9631 & 0.002181 \tabularnewline
47 & -0.368683 & -2.8558 & 0.002944 \tabularnewline
48 & -0.352067 & -2.7271 & 0.004183 \tabularnewline
\hline
\end{tabular}
%Source: https://freestatistics.org/blog/index.php?pk=&T=1

[TABLE]
[ROW][C]Autocorrelation Function[/C][/ROW]
[ROW][C]Time lag k[/C][C]ACF(k)[/C][C]T-STAT[/C][C]P-value[/C][/ROW]
[ROW][C]1[/C][C]0.945609[/C][C]7.3247[/C][C]0[/C][/ROW]
[ROW][C]2[/C][C]0.893891[/C][C]6.924[/C][C]0[/C][/ROW]
[ROW][C]3[/C][C]0.842762[/C][C]6.528[/C][C]0[/C][/ROW]
[ROW][C]4[/C][C]0.792334[/C][C]6.1374[/C][C]0[/C][/ROW]
[ROW][C]5[/C][C]0.742735[/C][C]5.7532[/C][C]0[/C][/ROW]
[ROW][C]6[/C][C]0.694736[/C][C]5.3814[/C][C]1e-06[/C][/ROW]
[ROW][C]7[/C][C]0.646765[/C][C]5.0098[/C][C]3e-06[/C][/ROW]
[ROW][C]8[/C][C]0.599979[/C][C]4.6474[/C][C]9e-06[/C][/ROW]
[ROW][C]9[/C][C]0.553071[/C][C]4.2841[/C][C]3.4e-05[/C][/ROW]
[ROW][C]10[/C][C]0.507252[/C][C]3.9292[/C][C]0.000112[/C][/ROW]
[ROW][C]11[/C][C]0.461573[/C][C]3.5753[/C][C]0.000349[/C][/ROW]
[ROW][C]12[/C][C]0.41595[/C][C]3.2219[/C][C]0.001029[/C][/ROW]
[ROW][C]13[/C][C]0.369506[/C][C]2.8622[/C][C]0.002893[/C][/ROW]
[ROW][C]14[/C][C]0.323427[/C][C]2.5053[/C][C]0.007484[/C][/ROW]
[ROW][C]15[/C][C]0.276908[/C][C]2.1449[/C][C]0.018009[/C][/ROW]
[ROW][C]16[/C][C]0.23123[/C][C]1.7911[/C][C]0.039161[/C][/ROW]
[ROW][C]17[/C][C]0.186669[/C][C]1.4459[/C][C]0.0767[/C][/ROW]
[ROW][C]18[/C][C]0.143071[/C][C]1.1082[/C][C]0.136094[/C][/ROW]
[ROW][C]19[/C][C]0.101041[/C][C]0.7827[/C][C]0.218452[/C][/ROW]
[ROW][C]20[/C][C]0.060916[/C][C]0.4719[/C][C]0.319371[/C][/ROW]
[ROW][C]21[/C][C]0.022881[/C][C]0.1772[/C][C]0.429961[/C][/ROW]
[ROW][C]22[/C][C]-0.014368[/C][C]-0.1113[/C][C]0.455877[/C][/ROW]
[ROW][C]23[/C][C]-0.049319[/C][C]-0.382[/C][C]0.351898[/C][/ROW]
[ROW][C]24[/C][C]-0.083092[/C][C]-0.6436[/C][C]0.261135[/C][/ROW]
[ROW][C]25[/C][C]-0.11633[/C][C]-0.9011[/C][C]0.185571[/C][/ROW]
[ROW][C]26[/C][C]-0.14905[/C][C]-1.1545[/C][C]0.126429[/C][/ROW]
[ROW][C]27[/C][C]-0.180662[/C][C]-1.3994[/C][C]0.083421[/C][/ROW]
[ROW][C]28[/C][C]-0.210532[/C][C]-1.6308[/C][C]0.054088[/C][/ROW]
[ROW][C]29[/C][C]-0.237669[/C][C]-1.841[/C][C]0.035285[/C][/ROW]
[ROW][C]30[/C][C]-0.263501[/C][C]-2.0411[/C][C]0.022825[/C][/ROW]
[ROW][C]31[/C][C]-0.286751[/C][C]-2.2212[/C][C]0.015063[/C][/ROW]
[ROW][C]32[/C][C]-0.308177[/C][C]-2.3871[/C][C]0.010074[/C][/ROW]
[ROW][C]33[/C][C]-0.327173[/C][C]-2.5343[/C][C]0.006948[/C][/ROW]
[ROW][C]34[/C][C]-0.343937[/C][C]-2.6641[/C][C]0.004949[/C][/ROW]
[ROW][C]35[/C][C]-0.358617[/C][C]-2.7778[/C][C]0.003646[/C][/ROW]
[ROW][C]36[/C][C]-0.372167[/C][C]-2.8828[/C][C]0.002732[/C][/ROW]
[ROW][C]37[/C][C]-0.38422[/C][C]-2.9762[/C][C]0.002102[/C][/ROW]
[ROW][C]38[/C][C]-0.395098[/C][C]-3.0604[/C][C]0.001652[/C][/ROW]
[ROW][C]39[/C][C]-0.40324[/C][C]-3.1235[/C][C]0.001376[/C][/ROW]
[ROW][C]40[/C][C]-0.409786[/C][C]-3.1742[/C][C]0.001186[/C][/ROW]
[ROW][C]41[/C][C]-0.412618[/C][C]-3.1961[/C][C]0.001111[/C][/ROW]
[ROW][C]42[/C][C]-0.412777[/C][C]-3.1974[/C][C]0.001107[/C][/ROW]
[ROW][C]43[/C][C]-0.409807[/C][C]-3.1743[/C][C]0.001185[/C][/ROW]
[ROW][C]44[/C][C]-0.403734[/C][C]-3.1273[/C][C]0.00136[/C][/ROW]
[ROW][C]45[/C][C]-0.394477[/C][C]-3.0556[/C][C]0.001675[/C][/ROW]
[ROW][C]46[/C][C]-0.382533[/C][C]-2.9631[/C][C]0.002181[/C][/ROW]
[ROW][C]47[/C][C]-0.368683[/C][C]-2.8558[/C][C]0.002944[/C][/ROW]
[ROW][C]48[/C][C]-0.352067[/C][C]-2.7271[/C][C]0.004183[/C][/ROW]
[/TABLE]
Source: https://freestatistics.org/blog/index.php?pk=&T=1

Globally Unique Identifier (entire table): ba.freestatistics.org/blog/index.php?pk=&T=1

As an alternative you can also use a QR Code:  

The GUIDs for individual cells are displayed in the table below:

Autocorrelation Function
Time lag kACF(k)T-STATP-value
10.9456097.32470
20.8938916.9240
30.8427626.5280
40.7923346.13740
50.7427355.75320
60.6947365.38141e-06
70.6467655.00983e-06
80.5999794.64749e-06
90.5530714.28413.4e-05
100.5072523.92920.000112
110.4615733.57530.000349
120.415953.22190.001029
130.3695062.86220.002893
140.3234272.50530.007484
150.2769082.14490.018009
160.231231.79110.039161
170.1866691.44590.0767
180.1430711.10820.136094
190.1010410.78270.218452
200.0609160.47190.319371
210.0228810.17720.429961
22-0.014368-0.11130.455877
23-0.049319-0.3820.351898
24-0.083092-0.64360.261135
25-0.11633-0.90110.185571
26-0.14905-1.15450.126429
27-0.180662-1.39940.083421
28-0.210532-1.63080.054088
29-0.237669-1.8410.035285
30-0.263501-2.04110.022825
31-0.286751-2.22120.015063
32-0.308177-2.38710.010074
33-0.327173-2.53430.006948
34-0.343937-2.66410.004949
35-0.358617-2.77780.003646
36-0.372167-2.88280.002732
37-0.38422-2.97620.002102
38-0.395098-3.06040.001652
39-0.40324-3.12350.001376
40-0.409786-3.17420.001186
41-0.412618-3.19610.001111
42-0.412777-3.19740.001107
43-0.409807-3.17430.001185
44-0.403734-3.12730.00136
45-0.394477-3.05560.001675
46-0.382533-2.96310.002181
47-0.368683-2.85580.002944
48-0.352067-2.72710.004183


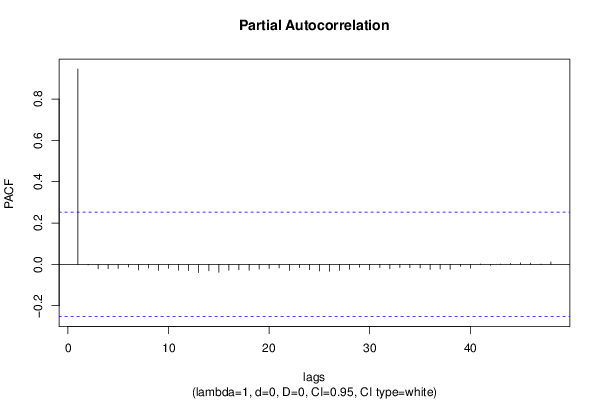
Partial Autocorrelation Function
Time lag kPACF(k)T-STATP-value
10.9456097.32470
2-0.002704-0.02090.491679
3-0.021151-0.16380.435205
4-0.02084-0.16140.43615
5-0.019962-0.15460.438817
6-0.012898-0.09990.460376
7-0.027274-0.21130.416698
8-0.017653-0.13670.445846
9-0.029709-0.23010.409388
10-0.019624-0.1520.439846
11-0.028346-0.21960.413476
12-0.030472-0.2360.407105
13-0.039633-0.3070.379955
14-0.030652-0.23740.406568
15-0.038546-0.29860.383149
16-0.028604-0.22160.412703
17-0.026032-0.20160.420439
18-0.028165-0.21820.414019
19-0.022678-0.17570.430574
20-0.019677-0.15240.439684
21-0.017093-0.13240.447555
22-0.029397-0.22770.410324
23-0.015741-0.12190.451682
24-0.025387-0.19660.422384
25-0.032111-0.24870.402211
26-0.033528-0.25970.397989
27-0.029158-0.22590.411039
28-0.023383-0.18110.428441
29-0.014135-0.10950.456589
30-0.026392-0.20440.419354
31-0.015444-0.11960.452589
32-0.021065-0.16320.435466
33-0.015291-0.11840.453057
34-0.01579-0.12230.451531
35-0.016874-0.13070.448224
36-0.024446-0.18940.425225
37-0.021825-0.16910.433161
38-0.023847-0.18470.427036
39-0.009308-0.07210.471381
40-0.018187-0.14090.44422
410.0018550.01440.494291
42-0.004363-0.03380.486576
430.0012690.00980.496094
440.0041130.03190.487344
450.0070920.05490.478188
460.0061690.04780.481023
470.0007270.00560.497763
480.0116780.09050.464111

\begin{tabular}{lllllllll}
\hline
Partial Autocorrelation Function \tabularnewline
Time lag k & PACF(k) & T-STAT & P-value \tabularnewline
1 & 0.945609 & 7.3247 & 0 \tabularnewline
2 & -0.002704 & -0.0209 & 0.491679 \tabularnewline
3 & -0.021151 & -0.1638 & 0.435205 \tabularnewline
4 & -0.02084 & -0.1614 & 0.43615 \tabularnewline
5 & -0.019962 & -0.1546 & 0.438817 \tabularnewline
6 & -0.012898 & -0.0999 & 0.460376 \tabularnewline
7 & -0.027274 & -0.2113 & 0.416698 \tabularnewline
8 & -0.017653 & -0.1367 & 0.445846 \tabularnewline
9 & -0.029709 & -0.2301 & 0.409388 \tabularnewline
10 & -0.019624 & -0.152 & 0.439846 \tabularnewline
11 & -0.028346 & -0.2196 & 0.413476 \tabularnewline
12 & -0.030472 & -0.236 & 0.407105 \tabularnewline
13 & -0.039633 & -0.307 & 0.379955 \tabularnewline
14 & -0.030652 & -0.2374 & 0.406568 \tabularnewline
15 & -0.038546 & -0.2986 & 0.383149 \tabularnewline
16 & -0.028604 & -0.2216 & 0.412703 \tabularnewline
17 & -0.026032 & -0.2016 & 0.420439 \tabularnewline
18 & -0.028165 & -0.2182 & 0.414019 \tabularnewline
19 & -0.022678 & -0.1757 & 0.430574 \tabularnewline
20 & -0.019677 & -0.1524 & 0.439684 \tabularnewline
21 & -0.017093 & -0.1324 & 0.447555 \tabularnewline
22 & -0.029397 & -0.2277 & 0.410324 \tabularnewline
23 & -0.015741 & -0.1219 & 0.451682 \tabularnewline
24 & -0.025387 & -0.1966 & 0.422384 \tabularnewline
25 & -0.032111 & -0.2487 & 0.402211 \tabularnewline
26 & -0.033528 & -0.2597 & 0.397989 \tabularnewline
27 & -0.029158 & -0.2259 & 0.411039 \tabularnewline
28 & -0.023383 & -0.1811 & 0.428441 \tabularnewline
29 & -0.014135 & -0.1095 & 0.456589 \tabularnewline
30 & -0.026392 & -0.2044 & 0.419354 \tabularnewline
31 & -0.015444 & -0.1196 & 0.452589 \tabularnewline
32 & -0.021065 & -0.1632 & 0.435466 \tabularnewline
33 & -0.015291 & -0.1184 & 0.453057 \tabularnewline
34 & -0.01579 & -0.1223 & 0.451531 \tabularnewline
35 & -0.016874 & -0.1307 & 0.448224 \tabularnewline
36 & -0.024446 & -0.1894 & 0.425225 \tabularnewline
37 & -0.021825 & -0.1691 & 0.433161 \tabularnewline
38 & -0.023847 & -0.1847 & 0.427036 \tabularnewline
39 & -0.009308 & -0.0721 & 0.471381 \tabularnewline
40 & -0.018187 & -0.1409 & 0.44422 \tabularnewline
41 & 0.001855 & 0.0144 & 0.494291 \tabularnewline
42 & -0.004363 & -0.0338 & 0.486576 \tabularnewline
43 & 0.001269 & 0.0098 & 0.496094 \tabularnewline
44 & 0.004113 & 0.0319 & 0.487344 \tabularnewline
45 & 0.007092 & 0.0549 & 0.478188 \tabularnewline
46 & 0.006169 & 0.0478 & 0.481023 \tabularnewline
47 & 0.000727 & 0.0056 & 0.497763 \tabularnewline
48 & 0.011678 & 0.0905 & 0.464111 \tabularnewline
\hline
\end{tabular}
%Source: https://freestatistics.org/blog/index.php?pk=&T=2

[TABLE]
[ROW][C]Partial Autocorrelation Function[/C][/ROW]
[ROW][C]Time lag k[/C][C]PACF(k)[/C][C]T-STAT[/C][C]P-value[/C][/ROW]
[ROW][C]1[/C][C]0.945609[/C][C]7.3247[/C][C]0[/C][/ROW]
[ROW][C]2[/C][C]-0.002704[/C][C]-0.0209[/C][C]0.491679[/C][/ROW]
[ROW][C]3[/C][C]-0.021151[/C][C]-0.1638[/C][C]0.435205[/C][/ROW]
[ROW][C]4[/C][C]-0.02084[/C][C]-0.1614[/C][C]0.43615[/C][/ROW]
[ROW][C]5[/C][C]-0.019962[/C][C]-0.1546[/C][C]0.438817[/C][/ROW]
[ROW][C]6[/C][C]-0.012898[/C][C]-0.0999[/C][C]0.460376[/C][/ROW]
[ROW][C]7[/C][C]-0.027274[/C][C]-0.2113[/C][C]0.416698[/C][/ROW]
[ROW][C]8[/C][C]-0.017653[/C][C]-0.1367[/C][C]0.445846[/C][/ROW]
[ROW][C]9[/C][C]-0.029709[/C][C]-0.2301[/C][C]0.409388[/C][/ROW]
[ROW][C]10[/C][C]-0.019624[/C][C]-0.152[/C][C]0.439846[/C][/ROW]
[ROW][C]11[/C][C]-0.028346[/C][C]-0.2196[/C][C]0.413476[/C][/ROW]
[ROW][C]12[/C][C]-0.030472[/C][C]-0.236[/C][C]0.407105[/C][/ROW]
[ROW][C]13[/C][C]-0.039633[/C][C]-0.307[/C][C]0.379955[/C][/ROW]
[ROW][C]14[/C][C]-0.030652[/C][C]-0.2374[/C][C]0.406568[/C][/ROW]
[ROW][C]15[/C][C]-0.038546[/C][C]-0.2986[/C][C]0.383149[/C][/ROW]
[ROW][C]16[/C][C]-0.028604[/C][C]-0.2216[/C][C]0.412703[/C][/ROW]
[ROW][C]17[/C][C]-0.026032[/C][C]-0.2016[/C][C]0.420439[/C][/ROW]
[ROW][C]18[/C][C]-0.028165[/C][C]-0.2182[/C][C]0.414019[/C][/ROW]
[ROW][C]19[/C][C]-0.022678[/C][C]-0.1757[/C][C]0.430574[/C][/ROW]
[ROW][C]20[/C][C]-0.019677[/C][C]-0.1524[/C][C]0.439684[/C][/ROW]
[ROW][C]21[/C][C]-0.017093[/C][C]-0.1324[/C][C]0.447555[/C][/ROW]
[ROW][C]22[/C][C]-0.029397[/C][C]-0.2277[/C][C]0.410324[/C][/ROW]
[ROW][C]23[/C][C]-0.015741[/C][C]-0.1219[/C][C]0.451682[/C][/ROW]
[ROW][C]24[/C][C]-0.025387[/C][C]-0.1966[/C][C]0.422384[/C][/ROW]
[ROW][C]25[/C][C]-0.032111[/C][C]-0.2487[/C][C]0.402211[/C][/ROW]
[ROW][C]26[/C][C]-0.033528[/C][C]-0.2597[/C][C]0.397989[/C][/ROW]
[ROW][C]27[/C][C]-0.029158[/C][C]-0.2259[/C][C]0.411039[/C][/ROW]
[ROW][C]28[/C][C]-0.023383[/C][C]-0.1811[/C][C]0.428441[/C][/ROW]
[ROW][C]29[/C][C]-0.014135[/C][C]-0.1095[/C][C]0.456589[/C][/ROW]
[ROW][C]30[/C][C]-0.026392[/C][C]-0.2044[/C][C]0.419354[/C][/ROW]
[ROW][C]31[/C][C]-0.015444[/C][C]-0.1196[/C][C]0.452589[/C][/ROW]
[ROW][C]32[/C][C]-0.021065[/C][C]-0.1632[/C][C]0.435466[/C][/ROW]
[ROW][C]33[/C][C]-0.015291[/C][C]-0.1184[/C][C]0.453057[/C][/ROW]
[ROW][C]34[/C][C]-0.01579[/C][C]-0.1223[/C][C]0.451531[/C][/ROW]
[ROW][C]35[/C][C]-0.016874[/C][C]-0.1307[/C][C]0.448224[/C][/ROW]
[ROW][C]36[/C][C]-0.024446[/C][C]-0.1894[/C][C]0.425225[/C][/ROW]
[ROW][C]37[/C][C]-0.021825[/C][C]-0.1691[/C][C]0.433161[/C][/ROW]
[ROW][C]38[/C][C]-0.023847[/C][C]-0.1847[/C][C]0.427036[/C][/ROW]
[ROW][C]39[/C][C]-0.009308[/C][C]-0.0721[/C][C]0.471381[/C][/ROW]
[ROW][C]40[/C][C]-0.018187[/C][C]-0.1409[/C][C]0.44422[/C][/ROW]
[ROW][C]41[/C][C]0.001855[/C][C]0.0144[/C][C]0.494291[/C][/ROW]
[ROW][C]42[/C][C]-0.004363[/C][C]-0.0338[/C][C]0.486576[/C][/ROW]
[ROW][C]43[/C][C]0.001269[/C][C]0.0098[/C][C]0.496094[/C][/ROW]
[ROW][C]44[/C][C]0.004113[/C][C]0.0319[/C][C]0.487344[/C][/ROW]
[ROW][C]45[/C][C]0.007092[/C][C]0.0549[/C][C]0.478188[/C][/ROW]
[ROW][C]46[/C][C]0.006169[/C][C]0.0478[/C][C]0.481023[/C][/ROW]
[ROW][C]47[/C][C]0.000727[/C][C]0.0056[/C][C]0.497763[/C][/ROW]
[ROW][C]48[/C][C]0.011678[/C][C]0.0905[/C][C]0.464111[/C][/ROW]
[/TABLE]
Source: https://freestatistics.org/blog/index.php?pk=&T=2

Globally Unique Identifier (entire table): ba.freestatistics.org/blog/index.php?pk=&T=2

As an alternative you can also use a QR Code:  

The GUIDs for individual cells are displayed in the table below:

Partial Autocorrelation Function
Time lag kPACF(k)T-STATP-value
10.9456097.32470
2-0.002704-0.02090.491679
3-0.021151-0.16380.435205
4-0.02084-0.16140.43615
5-0.019962-0.15460.438817
6-0.012898-0.09990.460376
7-0.027274-0.21130.416698
8-0.017653-0.13670.445846
9-0.029709-0.23010.409388
10-0.019624-0.1520.439846
11-0.028346-0.21960.413476
12-0.030472-0.2360.407105
13-0.039633-0.3070.379955
14-0.030652-0.23740.406568
15-0.038546-0.29860.383149
16-0.028604-0.22160.412703
17-0.026032-0.20160.420439
18-0.028165-0.21820.414019
19-0.022678-0.17570.430574
20-0.019677-0.15240.439684
21-0.017093-0.13240.447555
22-0.029397-0.22770.410324
23-0.015741-0.12190.451682
24-0.025387-0.19660.422384
25-0.032111-0.24870.402211
26-0.033528-0.25970.397989
27-0.029158-0.22590.411039
28-0.023383-0.18110.428441
29-0.014135-0.10950.456589
30-0.026392-0.20440.419354
31-0.015444-0.11960.452589
32-0.021065-0.16320.435466
33-0.015291-0.11840.453057
34-0.01579-0.12230.451531
35-0.016874-0.13070.448224
36-0.024446-0.18940.425225
37-0.021825-0.16910.433161
38-0.023847-0.18470.427036
39-0.009308-0.07210.471381
40-0.018187-0.14090.44422
410.0018550.01440.494291
42-0.004363-0.03380.486576
430.0012690.00980.496094
440.0041130.03190.487344
450.0070920.05490.478188
460.0061690.04780.481023
470.0007270.00560.497763
480.0116780.09050.464111


Parameters (Session):
par1 = 48 ; par2 = 1 ; par3 = 0 ; par4 = 0 ; par5 = 12 ; par6 = White Noise ; par7 = 0.95 ;
Parameters (R input):
par1 = 48 ; par2 = 1 ; par3 = 0 ; par4 = 0 ; par5 = 12 ; par6 = White Noise ; par7 = 0.95 ; par8 = ;
R code (references can be found in the software module):
if (par1 == 'Default') {
par1 = 10*log10(length(x))
} else {
par1 <- as.numeric(par1)
}
par2 <- as.numeric(par2)
par3 <- as.numeric(par3)
par4 <- as.numeric(par4)
par5 <- as.numeric(par5)
if (par6 == 'White Noise') par6 <- 'white' else par6 <- 'ma'
par7 <- as.numeric(par7)
if (par8 != '') par8 <- as.numeric(par8)
x <- na.omit(x)
ox <- x
if (par8 == '') {
if (par2 == 0) {
x <- log(x)
} else {
x <- (x ^ par2 - 1) / par2
}
} else {
x <- log(x,base=par8)
}
if (par3 > 0) x <- diff(x,lag=1,difference=par3)
if (par4 > 0) x <- diff(x,lag=par5,difference=par4)
bitmap(file='picts.png')
op <- par(mfrow=c(2,1))
plot(ox,type='l',main='Original Time Series',xlab='time',ylab='value')
if (par8=='') {
mytitle <- paste('Working Time Series (lambda=',par2,', d=',par3,', D=',par4,')',sep='')
mysub <- paste('(lambda=',par2,', d=',par3,', D=',par4,', CI=', par7, ', CI type=',par6,')',sep='')
} else {
mytitle <- paste('Working Time Series (base=',par8,', d=',par3,', D=',par4,')',sep='')
mysub <- paste('(base=',par8,', d=',par3,', D=',par4,', CI=', par7, ', CI type=',par6,')',sep='')
}
plot(x,type='l', main=mytitle,xlab='time',ylab='value')
par(op)
dev.off()
bitmap(file='pic1.png')
racf <- acf(x, par1, main='Autocorrelation', xlab='time lag', ylab='ACF', ci.type=par6, ci=par7, sub=mysub)
dev.off()
bitmap(file='pic2.png')
rpacf <- pacf(x,par1,main='Partial Autocorrelation',xlab='lags',ylab='PACF',sub=mysub)
dev.off()
(myacf <- c(racf$acf))
(mypacf <- c(rpacf$acf))
lengthx <- length(x)
sqrtn <- sqrt(lengthx)
load(file='createtable')
a<-table.start()
a<-table.row.start(a)
a<-table.element(a,'Autocorrelation Function',4,TRUE)
a<-table.row.end(a)
a<-table.row.start(a)
a<-table.element(a,'Time lag k',header=TRUE)
a<-table.element(a,hyperlink('basics.htm','ACF(k)','click here for more information about the Autocorrelation Function'),header=TRUE)
a<-table.element(a,'T-STAT',header=TRUE)
a<-table.element(a,'P-value',header=TRUE)
a<-table.row.end(a)
for (i in 2:(par1+1)) {
a<-table.row.start(a)
a<-table.element(a,i-1,header=TRUE)
a<-table.element(a,round(myacf[i],6))
mytstat <- myacf[i]*sqrtn
a<-table.element(a,round(mytstat,4))
a<-table.element(a,round(1-pt(abs(mytstat),lengthx),6))
a<-table.row.end(a)
}
a<-table.end(a)
table.save(a,file='mytable.tab')
a<-table.start()
a<-table.row.start(a)
a<-table.element(a,'Partial Autocorrelation Function',4,TRUE)
a<-table.row.end(a)
a<-table.row.start(a)
a<-table.element(a,'Time lag k',header=TRUE)
a<-table.element(a,hyperlink('basics.htm','PACF(k)','click here for more information about the Partial Autocorrelation Function'),header=TRUE)
a<-table.element(a,'T-STAT',header=TRUE)
a<-table.element(a,'P-value',header=TRUE)
a<-table.row.end(a)
for (i in 1:par1) {
a<-table.row.start(a)
a<-table.element(a,i,header=TRUE)
a<-table.element(a,round(mypacf[i],6))
mytstat <- mypacf[i]*sqrtn
a<-table.element(a,round(mytstat,4))
a<-table.element(a,round(1-pt(abs(mytstat),lengthx),6))
a<-table.row.end(a)
}
a<-table.end(a)
table.save(a,file='mytable1.tab')