Free Statistics

of Irreproducible Research!

Author's title

Author*Unverified author*
R Software Modulerwasp_autocorrelation.wasp
Title produced by software(Partial) Autocorrelation Function
Date of computationTue, 18 Oct 2016 22:38:57 +0100
Cite this page as followsStatistical Computations at FreeStatistics.org, Office for Research Development and Education, URL https://freestatistics.org/blog/index.php?v=date/2016/Oct/18/t1476826849bvkjb1gbsfr95sh.htm/, Retrieved Sat, 27 Apr 2024 17:46:09 +0200
Statistical Computations at FreeStatistics.org, Office for Research Development and Education, URL https://freestatistics.org/blog/index.php?pk=, Retrieved Sat, 27 Apr 2024 17:46:09 +0200
QR Codes:

Original text written by user:
IsPrivate?No (this computation is public)
User-defined keywords
Estimated Impact0
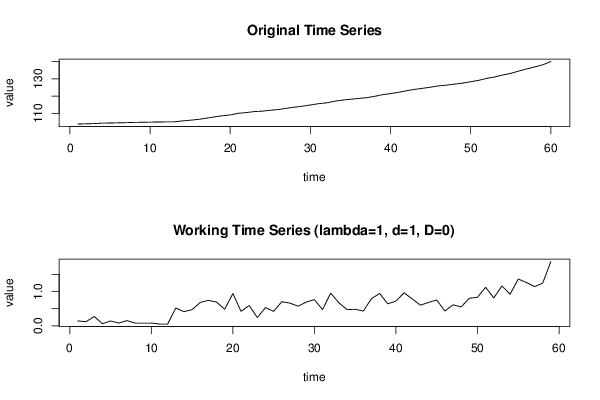
Dataseries X:
103.75
103.89
104.01
104.28
104.34
104.48
104.56
104.71
104.79
104.87
104.95
105
105.05
105.57
105.98
106.45
107.13
107.87
108.56
109.04
109.98
110.4
110.99
111.23
111.76
112.18
112.88
113.54
114.11
114.8
115.56
116.03
116.98
117.65
118.12
118.6
119.03
119.82
120.76
121.4
122.12
123.08
123.86
124.46
125.14
125.89
126.32
126.93
127.48
128.28
129.11
130.23
131.04
132.2
133.12
134.48
135.74
136.88
138.12
139.99


Summary of computational transaction
Raw Inputview raw input (R code)
Raw Outputview raw output of R engine
Computing time1 seconds
R Server'Sir Maurice George Kendall' @ kendall.wessa.net

\begin{tabular}{lllllllll}
\hline
Summary of computational transaction \tabularnewline
Raw Input & view raw input (R code)  \tabularnewline
Raw Output & view raw output of R engine  \tabularnewline
Computing time & 1 seconds \tabularnewline
R Server & 'Sir Maurice George Kendall' @ kendall.wessa.net \tabularnewline
\hline
\end{tabular}
%Source: https://freestatistics.org/blog/index.php?pk=&T=0

[TABLE]
[ROW][C]Summary of computational transaction[/C][/ROW]
[ROW][C]Raw Input[/C][C]view raw input (R code) [/C][/ROW]
[ROW][C]Raw Output[/C][C]view raw output of R engine [/C][/ROW]
[ROW][C]Computing time[/C][C]1 seconds[/C][/ROW]
[ROW][C]R Server[/C][C]'Sir Maurice George Kendall' @ kendall.wessa.net[/C][/ROW]
[/TABLE]
Source: https://freestatistics.org/blog/index.php?pk=&T=0

Globally Unique Identifier (entire table): ba.freestatistics.org/blog/index.php?pk=&T=0

As an alternative you can also use a QR Code:  

The GUIDs for individual cells are displayed in the table below:

Summary of computational transaction
Raw Inputview raw input (R code)
Raw Outputview raw output of R engine
Computing time1 seconds
R Server'Sir Maurice George Kendall' @ kendall.wessa.net


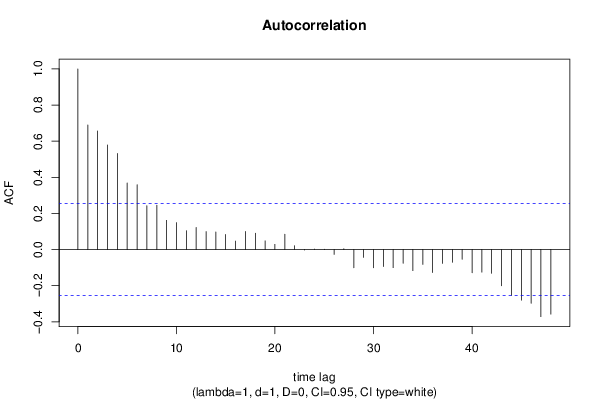
Autocorrelation Function
Time lag kACF(k)T-STATP-value
10.6893495.2951e-06
20.6564165.0422e-06
30.5793374.451.9e-05
40.5314354.0826.8e-05
50.3686472.83160.003162
60.3590682.75810.003865
70.2424411.86220.033777
80.2448571.88080.03247
90.1616791.24190.109598
100.1492051.14610.128197
110.104360.80160.213
120.1216840.93470.176883
130.0991130.76130.224754
140.0975880.74960.228241
150.0829070.63680.263353
160.0467460.35910.360415
170.0994840.76420.223911
180.0904190.69450.245041
190.0481140.36960.356513
200.0287640.22090.41295
210.0850880.65360.257963
220.02140.16440.434998
23-0.002168-0.01670.493386
240.0007880.00610.497596
250.0014780.01140.495489
26-0.02673-0.20530.419016
270.0045370.03480.48616
28-0.101119-0.77670.220216
29-0.043553-0.33450.36958
30-0.101134-0.77680.220183
31-0.093595-0.71890.237516
32-0.100167-0.76940.222364
33-0.075675-0.58130.281636
34-0.116905-0.8980.186426
35-0.082414-0.6330.264579
36-0.127055-0.97590.166543
37-0.076785-0.58980.278788
38-0.070269-0.53970.295702
39-0.053638-0.4120.340917
40-0.129053-0.99130.1628
41-0.125062-0.96060.170332
42-0.131292-1.00850.158673
43-0.20092-1.54330.064053
44-0.254988-1.95860.027446
45-0.280397-2.15380.017678
46-0.297313-2.28370.013003
47-0.371666-2.85480.002967
48-0.357704-2.74760.003976

\begin{tabular}{lllllllll}
\hline
Autocorrelation Function \tabularnewline
Time lag k & ACF(k) & T-STAT & P-value \tabularnewline
1 & 0.689349 & 5.295 & 1e-06 \tabularnewline
2 & 0.656416 & 5.042 & 2e-06 \tabularnewline
3 & 0.579337 & 4.45 & 1.9e-05 \tabularnewline
4 & 0.531435 & 4.082 & 6.8e-05 \tabularnewline
5 & 0.368647 & 2.8316 & 0.003162 \tabularnewline
6 & 0.359068 & 2.7581 & 0.003865 \tabularnewline
7 & 0.242441 & 1.8622 & 0.033777 \tabularnewline
8 & 0.244857 & 1.8808 & 0.03247 \tabularnewline
9 & 0.161679 & 1.2419 & 0.109598 \tabularnewline
10 & 0.149205 & 1.1461 & 0.128197 \tabularnewline
11 & 0.10436 & 0.8016 & 0.213 \tabularnewline
12 & 0.121684 & 0.9347 & 0.176883 \tabularnewline
13 & 0.099113 & 0.7613 & 0.224754 \tabularnewline
14 & 0.097588 & 0.7496 & 0.228241 \tabularnewline
15 & 0.082907 & 0.6368 & 0.263353 \tabularnewline
16 & 0.046746 & 0.3591 & 0.360415 \tabularnewline
17 & 0.099484 & 0.7642 & 0.223911 \tabularnewline
18 & 0.090419 & 0.6945 & 0.245041 \tabularnewline
19 & 0.048114 & 0.3696 & 0.356513 \tabularnewline
20 & 0.028764 & 0.2209 & 0.41295 \tabularnewline
21 & 0.085088 & 0.6536 & 0.257963 \tabularnewline
22 & 0.0214 & 0.1644 & 0.434998 \tabularnewline
23 & -0.002168 & -0.0167 & 0.493386 \tabularnewline
24 & 0.000788 & 0.0061 & 0.497596 \tabularnewline
25 & 0.001478 & 0.0114 & 0.495489 \tabularnewline
26 & -0.02673 & -0.2053 & 0.419016 \tabularnewline
27 & 0.004537 & 0.0348 & 0.48616 \tabularnewline
28 & -0.101119 & -0.7767 & 0.220216 \tabularnewline
29 & -0.043553 & -0.3345 & 0.36958 \tabularnewline
30 & -0.101134 & -0.7768 & 0.220183 \tabularnewline
31 & -0.093595 & -0.7189 & 0.237516 \tabularnewline
32 & -0.100167 & -0.7694 & 0.222364 \tabularnewline
33 & -0.075675 & -0.5813 & 0.281636 \tabularnewline
34 & -0.116905 & -0.898 & 0.186426 \tabularnewline
35 & -0.082414 & -0.633 & 0.264579 \tabularnewline
36 & -0.127055 & -0.9759 & 0.166543 \tabularnewline
37 & -0.076785 & -0.5898 & 0.278788 \tabularnewline
38 & -0.070269 & -0.5397 & 0.295702 \tabularnewline
39 & -0.053638 & -0.412 & 0.340917 \tabularnewline
40 & -0.129053 & -0.9913 & 0.1628 \tabularnewline
41 & -0.125062 & -0.9606 & 0.170332 \tabularnewline
42 & -0.131292 & -1.0085 & 0.158673 \tabularnewline
43 & -0.20092 & -1.5433 & 0.064053 \tabularnewline
44 & -0.254988 & -1.9586 & 0.027446 \tabularnewline
45 & -0.280397 & -2.1538 & 0.017678 \tabularnewline
46 & -0.297313 & -2.2837 & 0.013003 \tabularnewline
47 & -0.371666 & -2.8548 & 0.002967 \tabularnewline
48 & -0.357704 & -2.7476 & 0.003976 \tabularnewline
\hline
\end{tabular}
%Source: https://freestatistics.org/blog/index.php?pk=&T=1

[TABLE]
[ROW][C]Autocorrelation Function[/C][/ROW]
[ROW][C]Time lag k[/C][C]ACF(k)[/C][C]T-STAT[/C][C]P-value[/C][/ROW]
[ROW][C]1[/C][C]0.689349[/C][C]5.295[/C][C]1e-06[/C][/ROW]
[ROW][C]2[/C][C]0.656416[/C][C]5.042[/C][C]2e-06[/C][/ROW]
[ROW][C]3[/C][C]0.579337[/C][C]4.45[/C][C]1.9e-05[/C][/ROW]
[ROW][C]4[/C][C]0.531435[/C][C]4.082[/C][C]6.8e-05[/C][/ROW]
[ROW][C]5[/C][C]0.368647[/C][C]2.8316[/C][C]0.003162[/C][/ROW]
[ROW][C]6[/C][C]0.359068[/C][C]2.7581[/C][C]0.003865[/C][/ROW]
[ROW][C]7[/C][C]0.242441[/C][C]1.8622[/C][C]0.033777[/C][/ROW]
[ROW][C]8[/C][C]0.244857[/C][C]1.8808[/C][C]0.03247[/C][/ROW]
[ROW][C]9[/C][C]0.161679[/C][C]1.2419[/C][C]0.109598[/C][/ROW]
[ROW][C]10[/C][C]0.149205[/C][C]1.1461[/C][C]0.128197[/C][/ROW]
[ROW][C]11[/C][C]0.10436[/C][C]0.8016[/C][C]0.213[/C][/ROW]
[ROW][C]12[/C][C]0.121684[/C][C]0.9347[/C][C]0.176883[/C][/ROW]
[ROW][C]13[/C][C]0.099113[/C][C]0.7613[/C][C]0.224754[/C][/ROW]
[ROW][C]14[/C][C]0.097588[/C][C]0.7496[/C][C]0.228241[/C][/ROW]
[ROW][C]15[/C][C]0.082907[/C][C]0.6368[/C][C]0.263353[/C][/ROW]
[ROW][C]16[/C][C]0.046746[/C][C]0.3591[/C][C]0.360415[/C][/ROW]
[ROW][C]17[/C][C]0.099484[/C][C]0.7642[/C][C]0.223911[/C][/ROW]
[ROW][C]18[/C][C]0.090419[/C][C]0.6945[/C][C]0.245041[/C][/ROW]
[ROW][C]19[/C][C]0.048114[/C][C]0.3696[/C][C]0.356513[/C][/ROW]
[ROW][C]20[/C][C]0.028764[/C][C]0.2209[/C][C]0.41295[/C][/ROW]
[ROW][C]21[/C][C]0.085088[/C][C]0.6536[/C][C]0.257963[/C][/ROW]
[ROW][C]22[/C][C]0.0214[/C][C]0.1644[/C][C]0.434998[/C][/ROW]
[ROW][C]23[/C][C]-0.002168[/C][C]-0.0167[/C][C]0.493386[/C][/ROW]
[ROW][C]24[/C][C]0.000788[/C][C]0.0061[/C][C]0.497596[/C][/ROW]
[ROW][C]25[/C][C]0.001478[/C][C]0.0114[/C][C]0.495489[/C][/ROW]
[ROW][C]26[/C][C]-0.02673[/C][C]-0.2053[/C][C]0.419016[/C][/ROW]
[ROW][C]27[/C][C]0.004537[/C][C]0.0348[/C][C]0.48616[/C][/ROW]
[ROW][C]28[/C][C]-0.101119[/C][C]-0.7767[/C][C]0.220216[/C][/ROW]
[ROW][C]29[/C][C]-0.043553[/C][C]-0.3345[/C][C]0.36958[/C][/ROW]
[ROW][C]30[/C][C]-0.101134[/C][C]-0.7768[/C][C]0.220183[/C][/ROW]
[ROW][C]31[/C][C]-0.093595[/C][C]-0.7189[/C][C]0.237516[/C][/ROW]
[ROW][C]32[/C][C]-0.100167[/C][C]-0.7694[/C][C]0.222364[/C][/ROW]
[ROW][C]33[/C][C]-0.075675[/C][C]-0.5813[/C][C]0.281636[/C][/ROW]
[ROW][C]34[/C][C]-0.116905[/C][C]-0.898[/C][C]0.186426[/C][/ROW]
[ROW][C]35[/C][C]-0.082414[/C][C]-0.633[/C][C]0.264579[/C][/ROW]
[ROW][C]36[/C][C]-0.127055[/C][C]-0.9759[/C][C]0.166543[/C][/ROW]
[ROW][C]37[/C][C]-0.076785[/C][C]-0.5898[/C][C]0.278788[/C][/ROW]
[ROW][C]38[/C][C]-0.070269[/C][C]-0.5397[/C][C]0.295702[/C][/ROW]
[ROW][C]39[/C][C]-0.053638[/C][C]-0.412[/C][C]0.340917[/C][/ROW]
[ROW][C]40[/C][C]-0.129053[/C][C]-0.9913[/C][C]0.1628[/C][/ROW]
[ROW][C]41[/C][C]-0.125062[/C][C]-0.9606[/C][C]0.170332[/C][/ROW]
[ROW][C]42[/C][C]-0.131292[/C][C]-1.0085[/C][C]0.158673[/C][/ROW]
[ROW][C]43[/C][C]-0.20092[/C][C]-1.5433[/C][C]0.064053[/C][/ROW]
[ROW][C]44[/C][C]-0.254988[/C][C]-1.9586[/C][C]0.027446[/C][/ROW]
[ROW][C]45[/C][C]-0.280397[/C][C]-2.1538[/C][C]0.017678[/C][/ROW]
[ROW][C]46[/C][C]-0.297313[/C][C]-2.2837[/C][C]0.013003[/C][/ROW]
[ROW][C]47[/C][C]-0.371666[/C][C]-2.8548[/C][C]0.002967[/C][/ROW]
[ROW][C]48[/C][C]-0.357704[/C][C]-2.7476[/C][C]0.003976[/C][/ROW]
[/TABLE]
Source: https://freestatistics.org/blog/index.php?pk=&T=1

Globally Unique Identifier (entire table): ba.freestatistics.org/blog/index.php?pk=&T=1

As an alternative you can also use a QR Code:  

The GUIDs for individual cells are displayed in the table below:

Autocorrelation Function
Time lag kACF(k)T-STATP-value
10.6893495.2951e-06
20.6564165.0422e-06
30.5793374.451.9e-05
40.5314354.0826.8e-05
50.3686472.83160.003162
60.3590682.75810.003865
70.2424411.86220.033777
80.2448571.88080.03247
90.1616791.24190.109598
100.1492051.14610.128197
110.104360.80160.213
120.1216840.93470.176883
130.0991130.76130.224754
140.0975880.74960.228241
150.0829070.63680.263353
160.0467460.35910.360415
170.0994840.76420.223911
180.0904190.69450.245041
190.0481140.36960.356513
200.0287640.22090.41295
210.0850880.65360.257963
220.02140.16440.434998
23-0.002168-0.01670.493386
240.0007880.00610.497596
250.0014780.01140.495489
26-0.02673-0.20530.419016
270.0045370.03480.48616
28-0.101119-0.77670.220216
29-0.043553-0.33450.36958
30-0.101134-0.77680.220183
31-0.093595-0.71890.237516
32-0.100167-0.76940.222364
33-0.075675-0.58130.281636
34-0.116905-0.8980.186426
35-0.082414-0.6330.264579
36-0.127055-0.97590.166543
37-0.076785-0.58980.278788
38-0.070269-0.53970.295702
39-0.053638-0.4120.340917
40-0.129053-0.99130.1628
41-0.125062-0.96060.170332
42-0.131292-1.00850.158673
43-0.20092-1.54330.064053
44-0.254988-1.95860.027446
45-0.280397-2.15380.017678
46-0.297313-2.28370.013003
47-0.371666-2.85480.002967
48-0.357704-2.74760.003976


Partial Autocorrelation Function
Time lag kPACF(k)T-STATP-value
10.6893495.2951e-06
20.3453032.65230.005126
30.0974690.74870.228514
40.0534950.41090.341315
5-0.223329-1.71540.045757
60.0463150.35580.361648
7-0.095953-0.7370.232012
80.1009870.77570.220513
9-0.024578-0.18880.425453
10-0.00643-0.04940.480389
110.0111310.08550.466078
120.0307730.23640.406982
130.0583410.44810.327851
14-0.025574-0.19640.422473
150.0061150.0470.481348
16-0.116987-0.89860.186261
170.1559581.19790.117867
180.0200290.15380.439127
19-0.082538-0.6340.264269
20-0.058718-0.4510.326813
210.0872540.67020.252669
22-0.038091-0.29260.385433
23-0.080877-0.62120.268421
240.0478420.36750.357287
25-0.025064-0.19250.423999
260.0188160.14450.442788
270.0489690.37610.354081
28-0.212662-1.63350.053846
290.0921120.70750.241013
30-0.103213-0.79280.215537
310.0401360.30830.379473
320.0645080.49550.311047
33-0.0109-0.08370.466778
34-0.023786-0.18270.427828
35-0.073045-0.56110.288439
36-0.021716-0.16680.434048
370.0990410.76080.224917
380.0507880.39010.348931
39-0.071915-0.55240.291384
40-0.15296-1.17490.122376
41-0.075597-0.58070.281837
420.0324030.24890.402154
43-0.119572-0.91840.181062
44-0.126794-0.97390.167035
45-0.053677-0.41230.340805
460.0161340.12390.450895
47-0.130337-1.00110.160424
480.0323330.24840.402361

\begin{tabular}{lllllllll}
\hline
Partial Autocorrelation Function \tabularnewline
Time lag k & PACF(k) & T-STAT & P-value \tabularnewline
1 & 0.689349 & 5.295 & 1e-06 \tabularnewline
2 & 0.345303 & 2.6523 & 0.005126 \tabularnewline
3 & 0.097469 & 0.7487 & 0.228514 \tabularnewline
4 & 0.053495 & 0.4109 & 0.341315 \tabularnewline
5 & -0.223329 & -1.7154 & 0.045757 \tabularnewline
6 & 0.046315 & 0.3558 & 0.361648 \tabularnewline
7 & -0.095953 & -0.737 & 0.232012 \tabularnewline
8 & 0.100987 & 0.7757 & 0.220513 \tabularnewline
9 & -0.024578 & -0.1888 & 0.425453 \tabularnewline
10 & -0.00643 & -0.0494 & 0.480389 \tabularnewline
11 & 0.011131 & 0.0855 & 0.466078 \tabularnewline
12 & 0.030773 & 0.2364 & 0.406982 \tabularnewline
13 & 0.058341 & 0.4481 & 0.327851 \tabularnewline
14 & -0.025574 & -0.1964 & 0.422473 \tabularnewline
15 & 0.006115 & 0.047 & 0.481348 \tabularnewline
16 & -0.116987 & -0.8986 & 0.186261 \tabularnewline
17 & 0.155958 & 1.1979 & 0.117867 \tabularnewline
18 & 0.020029 & 0.1538 & 0.439127 \tabularnewline
19 & -0.082538 & -0.634 & 0.264269 \tabularnewline
20 & -0.058718 & -0.451 & 0.326813 \tabularnewline
21 & 0.087254 & 0.6702 & 0.252669 \tabularnewline
22 & -0.038091 & -0.2926 & 0.385433 \tabularnewline
23 & -0.080877 & -0.6212 & 0.268421 \tabularnewline
24 & 0.047842 & 0.3675 & 0.357287 \tabularnewline
25 & -0.025064 & -0.1925 & 0.423999 \tabularnewline
26 & 0.018816 & 0.1445 & 0.442788 \tabularnewline
27 & 0.048969 & 0.3761 & 0.354081 \tabularnewline
28 & -0.212662 & -1.6335 & 0.053846 \tabularnewline
29 & 0.092112 & 0.7075 & 0.241013 \tabularnewline
30 & -0.103213 & -0.7928 & 0.215537 \tabularnewline
31 & 0.040136 & 0.3083 & 0.379473 \tabularnewline
32 & 0.064508 & 0.4955 & 0.311047 \tabularnewline
33 & -0.0109 & -0.0837 & 0.466778 \tabularnewline
34 & -0.023786 & -0.1827 & 0.427828 \tabularnewline
35 & -0.073045 & -0.5611 & 0.288439 \tabularnewline
36 & -0.021716 & -0.1668 & 0.434048 \tabularnewline
37 & 0.099041 & 0.7608 & 0.224917 \tabularnewline
38 & 0.050788 & 0.3901 & 0.348931 \tabularnewline
39 & -0.071915 & -0.5524 & 0.291384 \tabularnewline
40 & -0.15296 & -1.1749 & 0.122376 \tabularnewline
41 & -0.075597 & -0.5807 & 0.281837 \tabularnewline
42 & 0.032403 & 0.2489 & 0.402154 \tabularnewline
43 & -0.119572 & -0.9184 & 0.181062 \tabularnewline
44 & -0.126794 & -0.9739 & 0.167035 \tabularnewline
45 & -0.053677 & -0.4123 & 0.340805 \tabularnewline
46 & 0.016134 & 0.1239 & 0.450895 \tabularnewline
47 & -0.130337 & -1.0011 & 0.160424 \tabularnewline
48 & 0.032333 & 0.2484 & 0.402361 \tabularnewline
\hline
\end{tabular}
%Source: https://freestatistics.org/blog/index.php?pk=&T=2

[TABLE]
[ROW][C]Partial Autocorrelation Function[/C][/ROW]
[ROW][C]Time lag k[/C][C]PACF(k)[/C][C]T-STAT[/C][C]P-value[/C][/ROW]
[ROW][C]1[/C][C]0.689349[/C][C]5.295[/C][C]1e-06[/C][/ROW]
[ROW][C]2[/C][C]0.345303[/C][C]2.6523[/C][C]0.005126[/C][/ROW]
[ROW][C]3[/C][C]0.097469[/C][C]0.7487[/C][C]0.228514[/C][/ROW]
[ROW][C]4[/C][C]0.053495[/C][C]0.4109[/C][C]0.341315[/C][/ROW]
[ROW][C]5[/C][C]-0.223329[/C][C]-1.7154[/C][C]0.045757[/C][/ROW]
[ROW][C]6[/C][C]0.046315[/C][C]0.3558[/C][C]0.361648[/C][/ROW]
[ROW][C]7[/C][C]-0.095953[/C][C]-0.737[/C][C]0.232012[/C][/ROW]
[ROW][C]8[/C][C]0.100987[/C][C]0.7757[/C][C]0.220513[/C][/ROW]
[ROW][C]9[/C][C]-0.024578[/C][C]-0.1888[/C][C]0.425453[/C][/ROW]
[ROW][C]10[/C][C]-0.00643[/C][C]-0.0494[/C][C]0.480389[/C][/ROW]
[ROW][C]11[/C][C]0.011131[/C][C]0.0855[/C][C]0.466078[/C][/ROW]
[ROW][C]12[/C][C]0.030773[/C][C]0.2364[/C][C]0.406982[/C][/ROW]
[ROW][C]13[/C][C]0.058341[/C][C]0.4481[/C][C]0.327851[/C][/ROW]
[ROW][C]14[/C][C]-0.025574[/C][C]-0.1964[/C][C]0.422473[/C][/ROW]
[ROW][C]15[/C][C]0.006115[/C][C]0.047[/C][C]0.481348[/C][/ROW]
[ROW][C]16[/C][C]-0.116987[/C][C]-0.8986[/C][C]0.186261[/C][/ROW]
[ROW][C]17[/C][C]0.155958[/C][C]1.1979[/C][C]0.117867[/C][/ROW]
[ROW][C]18[/C][C]0.020029[/C][C]0.1538[/C][C]0.439127[/C][/ROW]
[ROW][C]19[/C][C]-0.082538[/C][C]-0.634[/C][C]0.264269[/C][/ROW]
[ROW][C]20[/C][C]-0.058718[/C][C]-0.451[/C][C]0.326813[/C][/ROW]
[ROW][C]21[/C][C]0.087254[/C][C]0.6702[/C][C]0.252669[/C][/ROW]
[ROW][C]22[/C][C]-0.038091[/C][C]-0.2926[/C][C]0.385433[/C][/ROW]
[ROW][C]23[/C][C]-0.080877[/C][C]-0.6212[/C][C]0.268421[/C][/ROW]
[ROW][C]24[/C][C]0.047842[/C][C]0.3675[/C][C]0.357287[/C][/ROW]
[ROW][C]25[/C][C]-0.025064[/C][C]-0.1925[/C][C]0.423999[/C][/ROW]
[ROW][C]26[/C][C]0.018816[/C][C]0.1445[/C][C]0.442788[/C][/ROW]
[ROW][C]27[/C][C]0.048969[/C][C]0.3761[/C][C]0.354081[/C][/ROW]
[ROW][C]28[/C][C]-0.212662[/C][C]-1.6335[/C][C]0.053846[/C][/ROW]
[ROW][C]29[/C][C]0.092112[/C][C]0.7075[/C][C]0.241013[/C][/ROW]
[ROW][C]30[/C][C]-0.103213[/C][C]-0.7928[/C][C]0.215537[/C][/ROW]
[ROW][C]31[/C][C]0.040136[/C][C]0.3083[/C][C]0.379473[/C][/ROW]
[ROW][C]32[/C][C]0.064508[/C][C]0.4955[/C][C]0.311047[/C][/ROW]
[ROW][C]33[/C][C]-0.0109[/C][C]-0.0837[/C][C]0.466778[/C][/ROW]
[ROW][C]34[/C][C]-0.023786[/C][C]-0.1827[/C][C]0.427828[/C][/ROW]
[ROW][C]35[/C][C]-0.073045[/C][C]-0.5611[/C][C]0.288439[/C][/ROW]
[ROW][C]36[/C][C]-0.021716[/C][C]-0.1668[/C][C]0.434048[/C][/ROW]
[ROW][C]37[/C][C]0.099041[/C][C]0.7608[/C][C]0.224917[/C][/ROW]
[ROW][C]38[/C][C]0.050788[/C][C]0.3901[/C][C]0.348931[/C][/ROW]
[ROW][C]39[/C][C]-0.071915[/C][C]-0.5524[/C][C]0.291384[/C][/ROW]
[ROW][C]40[/C][C]-0.15296[/C][C]-1.1749[/C][C]0.122376[/C][/ROW]
[ROW][C]41[/C][C]-0.075597[/C][C]-0.5807[/C][C]0.281837[/C][/ROW]
[ROW][C]42[/C][C]0.032403[/C][C]0.2489[/C][C]0.402154[/C][/ROW]
[ROW][C]43[/C][C]-0.119572[/C][C]-0.9184[/C][C]0.181062[/C][/ROW]
[ROW][C]44[/C][C]-0.126794[/C][C]-0.9739[/C][C]0.167035[/C][/ROW]
[ROW][C]45[/C][C]-0.053677[/C][C]-0.4123[/C][C]0.340805[/C][/ROW]
[ROW][C]46[/C][C]0.016134[/C][C]0.1239[/C][C]0.450895[/C][/ROW]
[ROW][C]47[/C][C]-0.130337[/C][C]-1.0011[/C][C]0.160424[/C][/ROW]
[ROW][C]48[/C][C]0.032333[/C][C]0.2484[/C][C]0.402361[/C][/ROW]
[/TABLE]
Source: https://freestatistics.org/blog/index.php?pk=&T=2

Globally Unique Identifier (entire table): ba.freestatistics.org/blog/index.php?pk=&T=2

As an alternative you can also use a QR Code:  

The GUIDs for individual cells are displayed in the table below:

Partial Autocorrelation Function
Time lag kPACF(k)T-STATP-value
10.6893495.2951e-06
20.3453032.65230.005126
30.0974690.74870.228514
40.0534950.41090.341315
5-0.223329-1.71540.045757
60.0463150.35580.361648
7-0.095953-0.7370.232012
80.1009870.77570.220513
9-0.024578-0.18880.425453
10-0.00643-0.04940.480389
110.0111310.08550.466078
120.0307730.23640.406982
130.0583410.44810.327851
14-0.025574-0.19640.422473
150.0061150.0470.481348
16-0.116987-0.89860.186261
170.1559581.19790.117867
180.0200290.15380.439127
19-0.082538-0.6340.264269
20-0.058718-0.4510.326813
210.0872540.67020.252669
22-0.038091-0.29260.385433
23-0.080877-0.62120.268421
240.0478420.36750.357287
25-0.025064-0.19250.423999
260.0188160.14450.442788
270.0489690.37610.354081
28-0.212662-1.63350.053846
290.0921120.70750.241013
30-0.103213-0.79280.215537
310.0401360.30830.379473
320.0645080.49550.311047
33-0.0109-0.08370.466778
34-0.023786-0.18270.427828
35-0.073045-0.56110.288439
36-0.021716-0.16680.434048
370.0990410.76080.224917
380.0507880.39010.348931
39-0.071915-0.55240.291384
40-0.15296-1.17490.122376
41-0.075597-0.58070.281837
420.0324030.24890.402154
43-0.119572-0.91840.181062
44-0.126794-0.97390.167035
45-0.053677-0.41230.340805
460.0161340.12390.450895
47-0.130337-1.00110.160424
480.0323330.24840.402361


Parameters (Session):
par1 = 48 ; par2 = 1 ; par3 = 1 ; par4 = 0 ; par5 = 12 ; par6 = White Noise ; par7 = 0.95 ;
Parameters (R input):
par1 = 48 ; par2 = 1 ; par3 = 1 ; par4 = 0 ; par5 = 12 ; par6 = White Noise ; par7 = 0.95 ; par8 = ;
R code (references can be found in the software module):
par8 <- ''
par7 <- '0.95'
par6 <- 'White Noise'
par5 <- '12'
par4 <- '0'
par3 <- '0'
par2 <- '1'
par1 <- '48'
if (par1 == 'Default') {
par1 = 10*log10(length(x))
} else {
par1 <- as.numeric(par1)
}
par2 <- as.numeric(par2)
par3 <- as.numeric(par3)
par4 <- as.numeric(par4)
par5 <- as.numeric(par5)
if (par6 == 'White Noise') par6 <- 'white' else par6 <- 'ma'
par7 <- as.numeric(par7)
if (par8 != '') par8 <- as.numeric(par8)
x <- na.omit(x)
ox <- x
if (par8 == '') {
if (par2 == 0) {
x <- log(x)
} else {
x <- (x ^ par2 - 1) / par2
}
} else {
x <- log(x,base=par8)
}
if (par3 > 0) x <- diff(x,lag=1,difference=par3)
if (par4 > 0) x <- diff(x,lag=par5,difference=par4)
bitmap(file='picts.png')
op <- par(mfrow=c(2,1))
plot(ox,type='l',main='Original Time Series',xlab='time',ylab='value')
if (par8=='') {
mytitle <- paste('Working Time Series (lambda=',par2,', d=',par3,', D=',par4,')',sep='')
mysub <- paste('(lambda=',par2,', d=',par3,', D=',par4,', CI=', par7, ', CI type=',par6,')',sep='')
} else {
mytitle <- paste('Working Time Series (base=',par8,', d=',par3,', D=',par4,')',sep='')
mysub <- paste('(base=',par8,', d=',par3,', D=',par4,', CI=', par7, ', CI type=',par6,')',sep='')
}
plot(x,type='l', main=mytitle,xlab='time',ylab='value')
par(op)
dev.off()
bitmap(file='pic1.png')
racf <- acf(x, par1, main='Autocorrelation', xlab='time lag', ylab='ACF', ci.type=par6, ci=par7, sub=mysub)
dev.off()
bitmap(file='pic2.png')
rpacf <- pacf(x,par1,main='Partial Autocorrelation',xlab='lags',ylab='PACF',sub=mysub)
dev.off()
(myacf <- c(racf$acf))
(mypacf <- c(rpacf$acf))
lengthx <- length(x)
sqrtn <- sqrt(lengthx)
load(file='createtable')
a<-table.start()
a<-table.row.start(a)
a<-table.element(a,'Autocorrelation Function',4,TRUE)
a<-table.row.end(a)
a<-table.row.start(a)
a<-table.element(a,'Time lag k',header=TRUE)
a<-table.element(a,hyperlink('basics.htm','ACF(k)','click here for more information about the Autocorrelation Function'),header=TRUE)
a<-table.element(a,'T-STAT',header=TRUE)
a<-table.element(a,'P-value',header=TRUE)
a<-table.row.end(a)
for (i in 2:(par1+1)) {
a<-table.row.start(a)
a<-table.element(a,i-1,header=TRUE)
a<-table.element(a,round(myacf[i],6))
mytstat <- myacf[i]*sqrtn
a<-table.element(a,round(mytstat,4))
a<-table.element(a,round(1-pt(abs(mytstat),lengthx),6))
a<-table.row.end(a)
}
a<-table.end(a)
table.save(a,file='mytable.tab')
a<-table.start()
a<-table.row.start(a)
a<-table.element(a,'Partial Autocorrelation Function',4,TRUE)
a<-table.row.end(a)
a<-table.row.start(a)
a<-table.element(a,'Time lag k',header=TRUE)
a<-table.element(a,hyperlink('basics.htm','PACF(k)','click here for more information about the Partial Autocorrelation Function'),header=TRUE)
a<-table.element(a,'T-STAT',header=TRUE)
a<-table.element(a,'P-value',header=TRUE)
a<-table.row.end(a)
for (i in 1:par1) {
a<-table.row.start(a)
a<-table.element(a,i,header=TRUE)
a<-table.element(a,round(mypacf[i],6))
mytstat <- mypacf[i]*sqrtn
a<-table.element(a,round(mytstat,4))
a<-table.element(a,round(1-pt(abs(mytstat),lengthx),6))
a<-table.row.end(a)
}
a<-table.end(a)
table.save(a,file='mytable1.tab')