Free Statistics

of Irreproducible Research!

Author's title

Author*Unverified author*
R Software Modulerwasp_autocorrelation.wasp
Title produced by software(Partial) Autocorrelation Function
Date of computationWed, 19 Oct 2016 09:52:24 +0100
Cite this page as followsStatistical Computations at FreeStatistics.org, Office for Research Development and Education, URL https://freestatistics.org/blog/index.php?v=date/2016/Oct/19/t1476867183s5rp4t4bnj53h8v.htm/, Retrieved Tue, 30 Apr 2024 07:22:45 +0200
Statistical Computations at FreeStatistics.org, Office for Research Development and Education, URL https://freestatistics.org/blog/index.php?pk=, Retrieved Tue, 30 Apr 2024 07:22:45 +0200
QR Codes:

Original text written by user:
IsPrivate?No (this computation is public)
User-defined keywords
Estimated Impact0
Dataseries X:
480
548
634
489
399
658
497
495
445
525
565
427
477
511
538
444
559
433
459
492
526
523
636
519
671
599
579
593
684
599
721
516
556
700
579
552
734
760
714
698
800
712
782
610
596
748
581
641
598
609
526
716
552
464
631
465
539
537
488
520
477
480
645
455
379
477
424
316
381
376
389
472


Summary of computational transaction
Raw Inputview raw input (R code)
Raw Outputview raw output of R engine
Computing time1 seconds
R Server'Gwilym Jenkins' @ jenkins.wessa.net

\begin{tabular}{lllllllll}
\hline
Summary of computational transaction \tabularnewline
Raw Input & view raw input (R code)  \tabularnewline
Raw Output & view raw output of R engine  \tabularnewline
Computing time & 1 seconds \tabularnewline
R Server & 'Gwilym Jenkins' @ jenkins.wessa.net \tabularnewline
\hline
\end{tabular}
%Source: https://freestatistics.org/blog/index.php?pk=&T=0

[TABLE]
[ROW][C]Summary of computational transaction[/C][/ROW]
[ROW][C]Raw Input[/C][C]view raw input (R code) [/C][/ROW]
[ROW][C]Raw Output[/C][C]view raw output of R engine [/C][/ROW]
[ROW][C]Computing time[/C][C]1 seconds[/C][/ROW]
[ROW][C]R Server[/C][C]'Gwilym Jenkins' @ jenkins.wessa.net[/C][/ROW]
[/TABLE]
Source: https://freestatistics.org/blog/index.php?pk=&T=0

Globally Unique Identifier (entire table): ba.freestatistics.org/blog/index.php?pk=&T=0

As an alternative you can also use a QR Code:  

The GUIDs for individual cells are displayed in the table below:

Summary of computational transaction
Raw Inputview raw input (R code)
Raw Outputview raw output of R engine
Computing time1 seconds
R Server'Gwilym Jenkins' @ jenkins.wessa.net


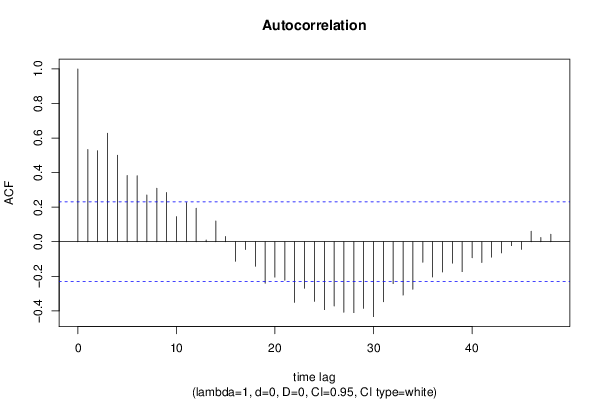
Autocorrelation Function
Time lag kACF(k)T-STATP-value
10.5334934.52681.2e-05
20.5263124.46591.4e-05
30.6278575.32751e-06
40.5008684.253.2e-05
50.3836153.25510.000864
60.3822143.24320.000896
70.2709762.29930.012195
80.3096732.62770.00525
90.2852262.42020.009018
100.1452431.23240.110899
110.2275131.93050.028741
120.19421.64780.051872
130.0104760.08890.464708
140.120451.02210.155089
150.0300030.25460.399884
16-0.112642-0.95580.171186
17-0.04497-0.38160.351946
18-0.142398-1.20830.115446
19-0.239985-2.03630.022698
20-0.205002-1.73950.04311
21-0.222741-1.890.03139
22-0.351059-2.97880.001971
23-0.269307-2.28510.012626
24-0.345017-2.92760.002285
25-0.393079-3.33540.000675
26-0.37224-3.15860.001159
27-0.408031-3.46230.000453
28-0.410194-3.48060.000427
29-0.385583-3.27180.000821
30-0.433544-3.67870.000224
31-0.347846-2.95160.002133
32-0.242333-2.05630.021691
33-0.30882-2.62040.005353
34-0.27486-2.33230.011243
35-0.118876-1.00870.15825
36-0.203775-1.72910.044039
37-0.174926-1.48430.071048
38-0.123983-1.0520.148151
39-0.172845-1.46660.073415
40-0.092685-0.78650.217089
41-0.120435-1.02190.155118
42-0.08933-0.7580.225466
43-0.064347-0.5460.293377
44-0.0226-0.19180.424232
45-0.044412-0.37680.353699
460.0609350.5170.303354
470.0249410.21160.416497
480.0430760.36550.3579

\begin{tabular}{lllllllll}
\hline
Autocorrelation Function \tabularnewline
Time lag k & ACF(k) & T-STAT & P-value \tabularnewline
1 & 0.533493 & 4.5268 & 1.2e-05 \tabularnewline
2 & 0.526312 & 4.4659 & 1.4e-05 \tabularnewline
3 & 0.627857 & 5.3275 & 1e-06 \tabularnewline
4 & 0.500868 & 4.25 & 3.2e-05 \tabularnewline
5 & 0.383615 & 3.2551 & 0.000864 \tabularnewline
6 & 0.382214 & 3.2432 & 0.000896 \tabularnewline
7 & 0.270976 & 2.2993 & 0.012195 \tabularnewline
8 & 0.309673 & 2.6277 & 0.00525 \tabularnewline
9 & 0.285226 & 2.4202 & 0.009018 \tabularnewline
10 & 0.145243 & 1.2324 & 0.110899 \tabularnewline
11 & 0.227513 & 1.9305 & 0.028741 \tabularnewline
12 & 0.1942 & 1.6478 & 0.051872 \tabularnewline
13 & 0.010476 & 0.0889 & 0.464708 \tabularnewline
14 & 0.12045 & 1.0221 & 0.155089 \tabularnewline
15 & 0.030003 & 0.2546 & 0.399884 \tabularnewline
16 & -0.112642 & -0.9558 & 0.171186 \tabularnewline
17 & -0.04497 & -0.3816 & 0.351946 \tabularnewline
18 & -0.142398 & -1.2083 & 0.115446 \tabularnewline
19 & -0.239985 & -2.0363 & 0.022698 \tabularnewline
20 & -0.205002 & -1.7395 & 0.04311 \tabularnewline
21 & -0.222741 & -1.89 & 0.03139 \tabularnewline
22 & -0.351059 & -2.9788 & 0.001971 \tabularnewline
23 & -0.269307 & -2.2851 & 0.012626 \tabularnewline
24 & -0.345017 & -2.9276 & 0.002285 \tabularnewline
25 & -0.393079 & -3.3354 & 0.000675 \tabularnewline
26 & -0.37224 & -3.1586 & 0.001159 \tabularnewline
27 & -0.408031 & -3.4623 & 0.000453 \tabularnewline
28 & -0.410194 & -3.4806 & 0.000427 \tabularnewline
29 & -0.385583 & -3.2718 & 0.000821 \tabularnewline
30 & -0.433544 & -3.6787 & 0.000224 \tabularnewline
31 & -0.347846 & -2.9516 & 0.002133 \tabularnewline
32 & -0.242333 & -2.0563 & 0.021691 \tabularnewline
33 & -0.30882 & -2.6204 & 0.005353 \tabularnewline
34 & -0.27486 & -2.3323 & 0.011243 \tabularnewline
35 & -0.118876 & -1.0087 & 0.15825 \tabularnewline
36 & -0.203775 & -1.7291 & 0.044039 \tabularnewline
37 & -0.174926 & -1.4843 & 0.071048 \tabularnewline
38 & -0.123983 & -1.052 & 0.148151 \tabularnewline
39 & -0.172845 & -1.4666 & 0.073415 \tabularnewline
40 & -0.092685 & -0.7865 & 0.217089 \tabularnewline
41 & -0.120435 & -1.0219 & 0.155118 \tabularnewline
42 & -0.08933 & -0.758 & 0.225466 \tabularnewline
43 & -0.064347 & -0.546 & 0.293377 \tabularnewline
44 & -0.0226 & -0.1918 & 0.424232 \tabularnewline
45 & -0.044412 & -0.3768 & 0.353699 \tabularnewline
46 & 0.060935 & 0.517 & 0.303354 \tabularnewline
47 & 0.024941 & 0.2116 & 0.416497 \tabularnewline
48 & 0.043076 & 0.3655 & 0.3579 \tabularnewline
\hline
\end{tabular}
%Source: https://freestatistics.org/blog/index.php?pk=&T=1

[TABLE]
[ROW][C]Autocorrelation Function[/C][/ROW]
[ROW][C]Time lag k[/C][C]ACF(k)[/C][C]T-STAT[/C][C]P-value[/C][/ROW]
[ROW][C]1[/C][C]0.533493[/C][C]4.5268[/C][C]1.2e-05[/C][/ROW]
[ROW][C]2[/C][C]0.526312[/C][C]4.4659[/C][C]1.4e-05[/C][/ROW]
[ROW][C]3[/C][C]0.627857[/C][C]5.3275[/C][C]1e-06[/C][/ROW]
[ROW][C]4[/C][C]0.500868[/C][C]4.25[/C][C]3.2e-05[/C][/ROW]
[ROW][C]5[/C][C]0.383615[/C][C]3.2551[/C][C]0.000864[/C][/ROW]
[ROW][C]6[/C][C]0.382214[/C][C]3.2432[/C][C]0.000896[/C][/ROW]
[ROW][C]7[/C][C]0.270976[/C][C]2.2993[/C][C]0.012195[/C][/ROW]
[ROW][C]8[/C][C]0.309673[/C][C]2.6277[/C][C]0.00525[/C][/ROW]
[ROW][C]9[/C][C]0.285226[/C][C]2.4202[/C][C]0.009018[/C][/ROW]
[ROW][C]10[/C][C]0.145243[/C][C]1.2324[/C][C]0.110899[/C][/ROW]
[ROW][C]11[/C][C]0.227513[/C][C]1.9305[/C][C]0.028741[/C][/ROW]
[ROW][C]12[/C][C]0.1942[/C][C]1.6478[/C][C]0.051872[/C][/ROW]
[ROW][C]13[/C][C]0.010476[/C][C]0.0889[/C][C]0.464708[/C][/ROW]
[ROW][C]14[/C][C]0.12045[/C][C]1.0221[/C][C]0.155089[/C][/ROW]
[ROW][C]15[/C][C]0.030003[/C][C]0.2546[/C][C]0.399884[/C][/ROW]
[ROW][C]16[/C][C]-0.112642[/C][C]-0.9558[/C][C]0.171186[/C][/ROW]
[ROW][C]17[/C][C]-0.04497[/C][C]-0.3816[/C][C]0.351946[/C][/ROW]
[ROW][C]18[/C][C]-0.142398[/C][C]-1.2083[/C][C]0.115446[/C][/ROW]
[ROW][C]19[/C][C]-0.239985[/C][C]-2.0363[/C][C]0.022698[/C][/ROW]
[ROW][C]20[/C][C]-0.205002[/C][C]-1.7395[/C][C]0.04311[/C][/ROW]
[ROW][C]21[/C][C]-0.222741[/C][C]-1.89[/C][C]0.03139[/C][/ROW]
[ROW][C]22[/C][C]-0.351059[/C][C]-2.9788[/C][C]0.001971[/C][/ROW]
[ROW][C]23[/C][C]-0.269307[/C][C]-2.2851[/C][C]0.012626[/C][/ROW]
[ROW][C]24[/C][C]-0.345017[/C][C]-2.9276[/C][C]0.002285[/C][/ROW]
[ROW][C]25[/C][C]-0.393079[/C][C]-3.3354[/C][C]0.000675[/C][/ROW]
[ROW][C]26[/C][C]-0.37224[/C][C]-3.1586[/C][C]0.001159[/C][/ROW]
[ROW][C]27[/C][C]-0.408031[/C][C]-3.4623[/C][C]0.000453[/C][/ROW]
[ROW][C]28[/C][C]-0.410194[/C][C]-3.4806[/C][C]0.000427[/C][/ROW]
[ROW][C]29[/C][C]-0.385583[/C][C]-3.2718[/C][C]0.000821[/C][/ROW]
[ROW][C]30[/C][C]-0.433544[/C][C]-3.6787[/C][C]0.000224[/C][/ROW]
[ROW][C]31[/C][C]-0.347846[/C][C]-2.9516[/C][C]0.002133[/C][/ROW]
[ROW][C]32[/C][C]-0.242333[/C][C]-2.0563[/C][C]0.021691[/C][/ROW]
[ROW][C]33[/C][C]-0.30882[/C][C]-2.6204[/C][C]0.005353[/C][/ROW]
[ROW][C]34[/C][C]-0.27486[/C][C]-2.3323[/C][C]0.011243[/C][/ROW]
[ROW][C]35[/C][C]-0.118876[/C][C]-1.0087[/C][C]0.15825[/C][/ROW]
[ROW][C]36[/C][C]-0.203775[/C][C]-1.7291[/C][C]0.044039[/C][/ROW]
[ROW][C]37[/C][C]-0.174926[/C][C]-1.4843[/C][C]0.071048[/C][/ROW]
[ROW][C]38[/C][C]-0.123983[/C][C]-1.052[/C][C]0.148151[/C][/ROW]
[ROW][C]39[/C][C]-0.172845[/C][C]-1.4666[/C][C]0.073415[/C][/ROW]
[ROW][C]40[/C][C]-0.092685[/C][C]-0.7865[/C][C]0.217089[/C][/ROW]
[ROW][C]41[/C][C]-0.120435[/C][C]-1.0219[/C][C]0.155118[/C][/ROW]
[ROW][C]42[/C][C]-0.08933[/C][C]-0.758[/C][C]0.225466[/C][/ROW]
[ROW][C]43[/C][C]-0.064347[/C][C]-0.546[/C][C]0.293377[/C][/ROW]
[ROW][C]44[/C][C]-0.0226[/C][C]-0.1918[/C][C]0.424232[/C][/ROW]
[ROW][C]45[/C][C]-0.044412[/C][C]-0.3768[/C][C]0.353699[/C][/ROW]
[ROW][C]46[/C][C]0.060935[/C][C]0.517[/C][C]0.303354[/C][/ROW]
[ROW][C]47[/C][C]0.024941[/C][C]0.2116[/C][C]0.416497[/C][/ROW]
[ROW][C]48[/C][C]0.043076[/C][C]0.3655[/C][C]0.3579[/C][/ROW]
[/TABLE]
Source: https://freestatistics.org/blog/index.php?pk=&T=1

Globally Unique Identifier (entire table): ba.freestatistics.org/blog/index.php?pk=&T=1

As an alternative you can also use a QR Code:  

The GUIDs for individual cells are displayed in the table below:

Autocorrelation Function
Time lag kACF(k)T-STATP-value
10.5334934.52681.2e-05
20.5263124.46591.4e-05
30.6278575.32751e-06
40.5008684.253.2e-05
50.3836153.25510.000864
60.3822143.24320.000896
70.2709762.29930.012195
80.3096732.62770.00525
90.2852262.42020.009018
100.1452431.23240.110899
110.2275131.93050.028741
120.19421.64780.051872
130.0104760.08890.464708
140.120451.02210.155089
150.0300030.25460.399884
16-0.112642-0.95580.171186
17-0.04497-0.38160.351946
18-0.142398-1.20830.115446
19-0.239985-2.03630.022698
20-0.205002-1.73950.04311
21-0.222741-1.890.03139
22-0.351059-2.97880.001971
23-0.269307-2.28510.012626
24-0.345017-2.92760.002285
25-0.393079-3.33540.000675
26-0.37224-3.15860.001159
27-0.408031-3.46230.000453
28-0.410194-3.48060.000427
29-0.385583-3.27180.000821
30-0.433544-3.67870.000224
31-0.347846-2.95160.002133
32-0.242333-2.05630.021691
33-0.30882-2.62040.005353
34-0.27486-2.33230.011243
35-0.118876-1.00870.15825
36-0.203775-1.72910.044039
37-0.174926-1.48430.071048
38-0.123983-1.0520.148151
39-0.172845-1.46660.073415
40-0.092685-0.78650.217089
41-0.120435-1.02190.155118
42-0.08933-0.7580.225466
43-0.064347-0.5460.293377
44-0.0226-0.19180.424232
45-0.044412-0.37680.353699
460.0609350.5170.303354
470.0249410.21160.416497
480.0430760.36550.3579


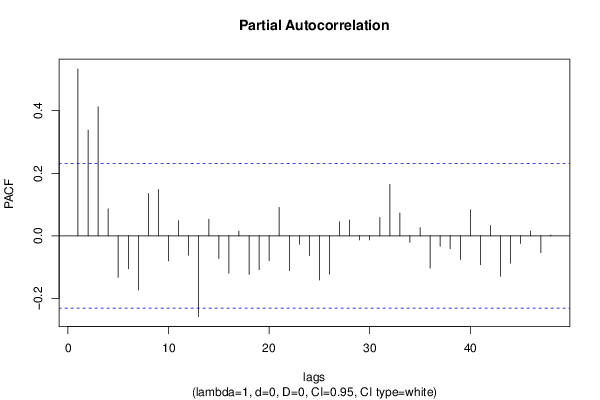
Partial Autocorrelation Function
Time lag kPACF(k)T-STATP-value
10.5334934.52681.2e-05
20.3378562.86680.002717
30.4129443.50390.000396
40.086230.73170.233368
5-0.13299-1.12850.131437
6-0.105187-0.89250.187539
7-0.173126-1.4690.073091
80.1352571.14770.127447
90.147951.25540.106697
10-0.080272-0.68110.248986
110.0486220.41260.340575
12-0.062275-0.52840.299416
13-0.258401-2.19260.015784
140.052870.44860.327526
15-0.072455-0.61480.270313
16-0.119602-1.01490.156786
170.0156520.13280.447357
18-0.123307-1.04630.149463
19-0.108196-0.91810.180824
20-0.07967-0.6760.250595
210.090860.7710.221623
22-0.111295-0.94440.17407
23-0.02737-0.23220.408504
24-0.063891-0.54210.294701
25-0.141327-1.19920.117192
26-0.123138-1.04490.149791
270.0449350.38130.352058
280.0508540.43150.333693
29-0.013074-0.11090.455987
30-0.013002-0.11030.456229
310.0588150.49910.309628
320.1649671.39980.082935
330.0728680.61830.269162
34-0.020997-0.17820.429547
350.0266020.22570.411027
36-0.103403-0.87740.191593
37-0.033345-0.28290.389016
38-0.041512-0.35220.362843
39-0.075521-0.64080.261837
400.0835920.70930.240215
41-0.092366-0.78370.217879
420.032880.2790.390524
43-0.12913-1.09570.138429
44-0.08738-0.74140.230418
45-0.024529-0.20810.417854
460.0156830.13310.447252
47-0.054053-0.45870.323933
480.0024470.02080.491747

\begin{tabular}{lllllllll}
\hline
Partial Autocorrelation Function \tabularnewline
Time lag k & PACF(k) & T-STAT & P-value \tabularnewline
1 & 0.533493 & 4.5268 & 1.2e-05 \tabularnewline
2 & 0.337856 & 2.8668 & 0.002717 \tabularnewline
3 & 0.412944 & 3.5039 & 0.000396 \tabularnewline
4 & 0.08623 & 0.7317 & 0.233368 \tabularnewline
5 & -0.13299 & -1.1285 & 0.131437 \tabularnewline
6 & -0.105187 & -0.8925 & 0.187539 \tabularnewline
7 & -0.173126 & -1.469 & 0.073091 \tabularnewline
8 & 0.135257 & 1.1477 & 0.127447 \tabularnewline
9 & 0.14795 & 1.2554 & 0.106697 \tabularnewline
10 & -0.080272 & -0.6811 & 0.248986 \tabularnewline
11 & 0.048622 & 0.4126 & 0.340575 \tabularnewline
12 & -0.062275 & -0.5284 & 0.299416 \tabularnewline
13 & -0.258401 & -2.1926 & 0.015784 \tabularnewline
14 & 0.05287 & 0.4486 & 0.327526 \tabularnewline
15 & -0.072455 & -0.6148 & 0.270313 \tabularnewline
16 & -0.119602 & -1.0149 & 0.156786 \tabularnewline
17 & 0.015652 & 0.1328 & 0.447357 \tabularnewline
18 & -0.123307 & -1.0463 & 0.149463 \tabularnewline
19 & -0.108196 & -0.9181 & 0.180824 \tabularnewline
20 & -0.07967 & -0.676 & 0.250595 \tabularnewline
21 & 0.09086 & 0.771 & 0.221623 \tabularnewline
22 & -0.111295 & -0.9444 & 0.17407 \tabularnewline
23 & -0.02737 & -0.2322 & 0.408504 \tabularnewline
24 & -0.063891 & -0.5421 & 0.294701 \tabularnewline
25 & -0.141327 & -1.1992 & 0.117192 \tabularnewline
26 & -0.123138 & -1.0449 & 0.149791 \tabularnewline
27 & 0.044935 & 0.3813 & 0.352058 \tabularnewline
28 & 0.050854 & 0.4315 & 0.333693 \tabularnewline
29 & -0.013074 & -0.1109 & 0.455987 \tabularnewline
30 & -0.013002 & -0.1103 & 0.456229 \tabularnewline
31 & 0.058815 & 0.4991 & 0.309628 \tabularnewline
32 & 0.164967 & 1.3998 & 0.082935 \tabularnewline
33 & 0.072868 & 0.6183 & 0.269162 \tabularnewline
34 & -0.020997 & -0.1782 & 0.429547 \tabularnewline
35 & 0.026602 & 0.2257 & 0.411027 \tabularnewline
36 & -0.103403 & -0.8774 & 0.191593 \tabularnewline
37 & -0.033345 & -0.2829 & 0.389016 \tabularnewline
38 & -0.041512 & -0.3522 & 0.362843 \tabularnewline
39 & -0.075521 & -0.6408 & 0.261837 \tabularnewline
40 & 0.083592 & 0.7093 & 0.240215 \tabularnewline
41 & -0.092366 & -0.7837 & 0.217879 \tabularnewline
42 & 0.03288 & 0.279 & 0.390524 \tabularnewline
43 & -0.12913 & -1.0957 & 0.138429 \tabularnewline
44 & -0.08738 & -0.7414 & 0.230418 \tabularnewline
45 & -0.024529 & -0.2081 & 0.417854 \tabularnewline
46 & 0.015683 & 0.1331 & 0.447252 \tabularnewline
47 & -0.054053 & -0.4587 & 0.323933 \tabularnewline
48 & 0.002447 & 0.0208 & 0.491747 \tabularnewline
\hline
\end{tabular}
%Source: https://freestatistics.org/blog/index.php?pk=&T=2

[TABLE]
[ROW][C]Partial Autocorrelation Function[/C][/ROW]
[ROW][C]Time lag k[/C][C]PACF(k)[/C][C]T-STAT[/C][C]P-value[/C][/ROW]
[ROW][C]1[/C][C]0.533493[/C][C]4.5268[/C][C]1.2e-05[/C][/ROW]
[ROW][C]2[/C][C]0.337856[/C][C]2.8668[/C][C]0.002717[/C][/ROW]
[ROW][C]3[/C][C]0.412944[/C][C]3.5039[/C][C]0.000396[/C][/ROW]
[ROW][C]4[/C][C]0.08623[/C][C]0.7317[/C][C]0.233368[/C][/ROW]
[ROW][C]5[/C][C]-0.13299[/C][C]-1.1285[/C][C]0.131437[/C][/ROW]
[ROW][C]6[/C][C]-0.105187[/C][C]-0.8925[/C][C]0.187539[/C][/ROW]
[ROW][C]7[/C][C]-0.173126[/C][C]-1.469[/C][C]0.073091[/C][/ROW]
[ROW][C]8[/C][C]0.135257[/C][C]1.1477[/C][C]0.127447[/C][/ROW]
[ROW][C]9[/C][C]0.14795[/C][C]1.2554[/C][C]0.106697[/C][/ROW]
[ROW][C]10[/C][C]-0.080272[/C][C]-0.6811[/C][C]0.248986[/C][/ROW]
[ROW][C]11[/C][C]0.048622[/C][C]0.4126[/C][C]0.340575[/C][/ROW]
[ROW][C]12[/C][C]-0.062275[/C][C]-0.5284[/C][C]0.299416[/C][/ROW]
[ROW][C]13[/C][C]-0.258401[/C][C]-2.1926[/C][C]0.015784[/C][/ROW]
[ROW][C]14[/C][C]0.05287[/C][C]0.4486[/C][C]0.327526[/C][/ROW]
[ROW][C]15[/C][C]-0.072455[/C][C]-0.6148[/C][C]0.270313[/C][/ROW]
[ROW][C]16[/C][C]-0.119602[/C][C]-1.0149[/C][C]0.156786[/C][/ROW]
[ROW][C]17[/C][C]0.015652[/C][C]0.1328[/C][C]0.447357[/C][/ROW]
[ROW][C]18[/C][C]-0.123307[/C][C]-1.0463[/C][C]0.149463[/C][/ROW]
[ROW][C]19[/C][C]-0.108196[/C][C]-0.9181[/C][C]0.180824[/C][/ROW]
[ROW][C]20[/C][C]-0.07967[/C][C]-0.676[/C][C]0.250595[/C][/ROW]
[ROW][C]21[/C][C]0.09086[/C][C]0.771[/C][C]0.221623[/C][/ROW]
[ROW][C]22[/C][C]-0.111295[/C][C]-0.9444[/C][C]0.17407[/C][/ROW]
[ROW][C]23[/C][C]-0.02737[/C][C]-0.2322[/C][C]0.408504[/C][/ROW]
[ROW][C]24[/C][C]-0.063891[/C][C]-0.5421[/C][C]0.294701[/C][/ROW]
[ROW][C]25[/C][C]-0.141327[/C][C]-1.1992[/C][C]0.117192[/C][/ROW]
[ROW][C]26[/C][C]-0.123138[/C][C]-1.0449[/C][C]0.149791[/C][/ROW]
[ROW][C]27[/C][C]0.044935[/C][C]0.3813[/C][C]0.352058[/C][/ROW]
[ROW][C]28[/C][C]0.050854[/C][C]0.4315[/C][C]0.333693[/C][/ROW]
[ROW][C]29[/C][C]-0.013074[/C][C]-0.1109[/C][C]0.455987[/C][/ROW]
[ROW][C]30[/C][C]-0.013002[/C][C]-0.1103[/C][C]0.456229[/C][/ROW]
[ROW][C]31[/C][C]0.058815[/C][C]0.4991[/C][C]0.309628[/C][/ROW]
[ROW][C]32[/C][C]0.164967[/C][C]1.3998[/C][C]0.082935[/C][/ROW]
[ROW][C]33[/C][C]0.072868[/C][C]0.6183[/C][C]0.269162[/C][/ROW]
[ROW][C]34[/C][C]-0.020997[/C][C]-0.1782[/C][C]0.429547[/C][/ROW]
[ROW][C]35[/C][C]0.026602[/C][C]0.2257[/C][C]0.411027[/C][/ROW]
[ROW][C]36[/C][C]-0.103403[/C][C]-0.8774[/C][C]0.191593[/C][/ROW]
[ROW][C]37[/C][C]-0.033345[/C][C]-0.2829[/C][C]0.389016[/C][/ROW]
[ROW][C]38[/C][C]-0.041512[/C][C]-0.3522[/C][C]0.362843[/C][/ROW]
[ROW][C]39[/C][C]-0.075521[/C][C]-0.6408[/C][C]0.261837[/C][/ROW]
[ROW][C]40[/C][C]0.083592[/C][C]0.7093[/C][C]0.240215[/C][/ROW]
[ROW][C]41[/C][C]-0.092366[/C][C]-0.7837[/C][C]0.217879[/C][/ROW]
[ROW][C]42[/C][C]0.03288[/C][C]0.279[/C][C]0.390524[/C][/ROW]
[ROW][C]43[/C][C]-0.12913[/C][C]-1.0957[/C][C]0.138429[/C][/ROW]
[ROW][C]44[/C][C]-0.08738[/C][C]-0.7414[/C][C]0.230418[/C][/ROW]
[ROW][C]45[/C][C]-0.024529[/C][C]-0.2081[/C][C]0.417854[/C][/ROW]
[ROW][C]46[/C][C]0.015683[/C][C]0.1331[/C][C]0.447252[/C][/ROW]
[ROW][C]47[/C][C]-0.054053[/C][C]-0.4587[/C][C]0.323933[/C][/ROW]
[ROW][C]48[/C][C]0.002447[/C][C]0.0208[/C][C]0.491747[/C][/ROW]
[/TABLE]
Source: https://freestatistics.org/blog/index.php?pk=&T=2

Globally Unique Identifier (entire table): ba.freestatistics.org/blog/index.php?pk=&T=2

As an alternative you can also use a QR Code:  

The GUIDs for individual cells are displayed in the table below:

Partial Autocorrelation Function
Time lag kPACF(k)T-STATP-value
10.5334934.52681.2e-05
20.3378562.86680.002717
30.4129443.50390.000396
40.086230.73170.233368
5-0.13299-1.12850.131437
6-0.105187-0.89250.187539
7-0.173126-1.4690.073091
80.1352571.14770.127447
90.147951.25540.106697
10-0.080272-0.68110.248986
110.0486220.41260.340575
12-0.062275-0.52840.299416
13-0.258401-2.19260.015784
140.052870.44860.327526
15-0.072455-0.61480.270313
16-0.119602-1.01490.156786
170.0156520.13280.447357
18-0.123307-1.04630.149463
19-0.108196-0.91810.180824
20-0.07967-0.6760.250595
210.090860.7710.221623
22-0.111295-0.94440.17407
23-0.02737-0.23220.408504
24-0.063891-0.54210.294701
25-0.141327-1.19920.117192
26-0.123138-1.04490.149791
270.0449350.38130.352058
280.0508540.43150.333693
29-0.013074-0.11090.455987
30-0.013002-0.11030.456229
310.0588150.49910.309628
320.1649671.39980.082935
330.0728680.61830.269162
34-0.020997-0.17820.429547
350.0266020.22570.411027
36-0.103403-0.87740.191593
37-0.033345-0.28290.389016
38-0.041512-0.35220.362843
39-0.075521-0.64080.261837
400.0835920.70930.240215
41-0.092366-0.78370.217879
420.032880.2790.390524
43-0.12913-1.09570.138429
44-0.08738-0.74140.230418
45-0.024529-0.20810.417854
460.0156830.13310.447252
47-0.054053-0.45870.323933
480.0024470.02080.491747


Parameters (Session):
par1 = 48 ; par2 = 1 ; par3 = 0 ; par4 = 0 ; par5 = 12 ; par6 = White Noise ; par7 = 0.95 ;
Parameters (R input):
par1 = 48 ; par2 = 1 ; par3 = 0 ; par4 = 0 ; par5 = 12 ; par6 = White Noise ; par7 = 0.95 ; par8 = ;
R code (references can be found in the software module):
if (par1 == 'Default') {
par1 = 10*log10(length(x))
} else {
par1 <- as.numeric(par1)
}
par2 <- as.numeric(par2)
par3 <- as.numeric(par3)
par4 <- as.numeric(par4)
par5 <- as.numeric(par5)
if (par6 == 'White Noise') par6 <- 'white' else par6 <- 'ma'
par7 <- as.numeric(par7)
if (par8 != '') par8 <- as.numeric(par8)
x <- na.omit(x)
ox <- x
if (par8 == '') {
if (par2 == 0) {
x <- log(x)
} else {
x <- (x ^ par2 - 1) / par2
}
} else {
x <- log(x,base=par8)
}
if (par3 > 0) x <- diff(x,lag=1,difference=par3)
if (par4 > 0) x <- diff(x,lag=par5,difference=par4)
bitmap(file='picts.png')
op <- par(mfrow=c(2,1))
plot(ox,type='l',main='Original Time Series',xlab='time',ylab='value')
if (par8=='') {
mytitle <- paste('Working Time Series (lambda=',par2,', d=',par3,', D=',par4,')',sep='')
mysub <- paste('(lambda=',par2,', d=',par3,', D=',par4,', CI=', par7, ', CI type=',par6,')',sep='')
} else {
mytitle <- paste('Working Time Series (base=',par8,', d=',par3,', D=',par4,')',sep='')
mysub <- paste('(base=',par8,', d=',par3,', D=',par4,', CI=', par7, ', CI type=',par6,')',sep='')
}
plot(x,type='l', main=mytitle,xlab='time',ylab='value')
par(op)
dev.off()
bitmap(file='pic1.png')
racf <- acf(x, par1, main='Autocorrelation', xlab='time lag', ylab='ACF', ci.type=par6, ci=par7, sub=mysub)
dev.off()
bitmap(file='pic2.png')
rpacf <- pacf(x,par1,main='Partial Autocorrelation',xlab='lags',ylab='PACF',sub=mysub)
dev.off()
(myacf <- c(racf$acf))
(mypacf <- c(rpacf$acf))
lengthx <- length(x)
sqrtn <- sqrt(lengthx)
load(file='createtable')
a<-table.start()
a<-table.row.start(a)
a<-table.element(a,'Autocorrelation Function',4,TRUE)
a<-table.row.end(a)
a<-table.row.start(a)
a<-table.element(a,'Time lag k',header=TRUE)
a<-table.element(a,hyperlink('basics.htm','ACF(k)','click here for more information about the Autocorrelation Function'),header=TRUE)
a<-table.element(a,'T-STAT',header=TRUE)
a<-table.element(a,'P-value',header=TRUE)
a<-table.row.end(a)
for (i in 2:(par1+1)) {
a<-table.row.start(a)
a<-table.element(a,i-1,header=TRUE)
a<-table.element(a,round(myacf[i],6))
mytstat <- myacf[i]*sqrtn
a<-table.element(a,round(mytstat,4))
a<-table.element(a,round(1-pt(abs(mytstat),lengthx),6))
a<-table.row.end(a)
}
a<-table.end(a)
table.save(a,file='mytable.tab')
a<-table.start()
a<-table.row.start(a)
a<-table.element(a,'Partial Autocorrelation Function',4,TRUE)
a<-table.row.end(a)
a<-table.row.start(a)
a<-table.element(a,'Time lag k',header=TRUE)
a<-table.element(a,hyperlink('basics.htm','PACF(k)','click here for more information about the Partial Autocorrelation Function'),header=TRUE)
a<-table.element(a,'T-STAT',header=TRUE)
a<-table.element(a,'P-value',header=TRUE)
a<-table.row.end(a)
for (i in 1:par1) {
a<-table.row.start(a)
a<-table.element(a,i,header=TRUE)
a<-table.element(a,round(mypacf[i],6))
mytstat <- mypacf[i]*sqrtn
a<-table.element(a,round(mytstat,4))
a<-table.element(a,round(1-pt(abs(mytstat),lengthx),6))
a<-table.row.end(a)
}
a<-table.end(a)
table.save(a,file='mytable1.tab')