Free Statistics

of Irreproducible Research!

Author's title

Author*Unverified author*
R Software Modulerwasp_autocorrelation.wasp
Title produced by software(Partial) Autocorrelation Function
Date of computationWed, 19 Oct 2016 11:01:48 +0100
Cite this page as followsStatistical Computations at FreeStatistics.org, Office for Research Development and Education, URL https://freestatistics.org/blog/index.php?v=date/2016/Oct/19/t1476871358zygkltksp52zcsj.htm/, Retrieved Tue, 30 Apr 2024 03:04:21 +0200
Statistical Computations at FreeStatistics.org, Office for Research Development and Education, URL https://freestatistics.org/blog/index.php?pk=, Retrieved Tue, 30 Apr 2024 03:04:21 +0200
QR Codes:

Original text written by user:
IsPrivate?No (this computation is public)
User-defined keywords
Estimated Impact0
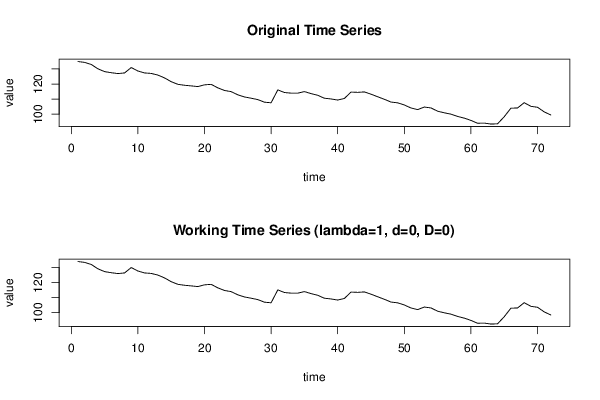
Dataseries X:
134,93
134,37
132,98
130,1
128,24
127,52
126,94
127,38
130,95
128,65
127,37
127,04
125,95
124,06
121,55
119,82
119,19
118,77
118,31
119,47
119,79
117,46
115,74
114,97
112,83
111,44
110,6
109,67
107,96
107,56
116,12
114,38
113,96
113,95
114,99
113,64
112,53
110,59
110,1
109,38
110,43
114,67
114,48
114,76
113,27
111,56
109,89
108,04
107,53
106,11
104,11
103
104,74
104,14
101,98
100,91
100,02
98,49
97,38
95,86
93,99
94,09
93,44
93,61
98,31
103,97
104,12
107,63
105,22
104,59
101,54
99,47


Summary of computational transaction
Raw Inputview raw input (R code)
Raw Outputview raw output of R engine
Computing time1 seconds
R Server'Gwilym Jenkins' @ jenkins.wessa.net

\begin{tabular}{lllllllll}
\hline
Summary of computational transaction \tabularnewline
Raw Input & view raw input (R code)  \tabularnewline
Raw Output & view raw output of R engine  \tabularnewline
Computing time & 1 seconds \tabularnewline
R Server & 'Gwilym Jenkins' @ jenkins.wessa.net \tabularnewline
\hline
\end{tabular}
%Source: https://freestatistics.org/blog/index.php?pk=&T=0

[TABLE]
[ROW][C]Summary of computational transaction[/C][/ROW]
[ROW][C]Raw Input[/C][C]view raw input (R code) [/C][/ROW]
[ROW][C]Raw Output[/C][C]view raw output of R engine [/C][/ROW]
[ROW][C]Computing time[/C][C]1 seconds[/C][/ROW]
[ROW][C]R Server[/C][C]'Gwilym Jenkins' @ jenkins.wessa.net[/C][/ROW]
[/TABLE]
Source: https://freestatistics.org/blog/index.php?pk=&T=0

Globally Unique Identifier (entire table): ba.freestatistics.org/blog/index.php?pk=&T=0

As an alternative you can also use a QR Code:  

The GUIDs for individual cells are displayed in the table below:

Summary of computational transaction
Raw Inputview raw input (R code)
Raw Outputview raw output of R engine
Computing time1 seconds
R Server'Gwilym Jenkins' @ jenkins.wessa.net


Autocorrelation Function
Time lag kACF(k)T-STATP-value
10.9402777.97850
20.8759397.43260
30.8152346.91750
40.7612926.45980
50.7178126.09080
60.6781395.75420
70.6464845.48560
80.6067735.14861e-06
90.5494884.66267e-06
100.4977664.22373.5e-05
110.4461333.78560.000157
120.3825043.24570.00089
130.318592.70330.004279
140.2593522.20070.015484
150.2089291.77280.040244
160.1672361.4190.080101
170.1342441.13910.129219
180.1092750.92720.178452
190.0906730.76940.222091
200.0718390.60960.27203
210.0527950.4480.327755
220.0415010.35210.362877
230.025830.21920.413568
240.0070380.05970.476274
25-0.010747-0.09120.463796
26-0.024296-0.20620.418624
27-0.034671-0.29420.384729
28-0.033895-0.28760.387237
29-0.021596-0.18330.427558
30-0.00508-0.04310.482867
31-0.009169-0.07780.469102
32-0.017322-0.1470.441778
33-0.028861-0.24490.403617
34-0.046655-0.39590.346681
35-0.074941-0.63590.263431
36-0.106176-0.90090.185314
37-0.133271-1.13080.130938
38-0.155416-1.31870.095716
39-0.17373-1.47410.0724
40-0.188047-1.59560.057476
41-0.201235-1.70750.046016
42-0.221782-1.88190.031947
43-0.256316-2.17490.016461
44-0.29059-2.46570.008028
45-0.321553-2.72850.003995
46-0.350737-2.97610.001987
47-0.377018-3.19910.001025
48-0.399043-3.3860.000576

\begin{tabular}{lllllllll}
\hline
Autocorrelation Function \tabularnewline
Time lag k & ACF(k) & T-STAT & P-value \tabularnewline
1 & 0.940277 & 7.9785 & 0 \tabularnewline
2 & 0.875939 & 7.4326 & 0 \tabularnewline
3 & 0.815234 & 6.9175 & 0 \tabularnewline
4 & 0.761292 & 6.4598 & 0 \tabularnewline
5 & 0.717812 & 6.0908 & 0 \tabularnewline
6 & 0.678139 & 5.7542 & 0 \tabularnewline
7 & 0.646484 & 5.4856 & 0 \tabularnewline
8 & 0.606773 & 5.1486 & 1e-06 \tabularnewline
9 & 0.549488 & 4.6626 & 7e-06 \tabularnewline
10 & 0.497766 & 4.2237 & 3.5e-05 \tabularnewline
11 & 0.446133 & 3.7856 & 0.000157 \tabularnewline
12 & 0.382504 & 3.2457 & 0.00089 \tabularnewline
13 & 0.31859 & 2.7033 & 0.004279 \tabularnewline
14 & 0.259352 & 2.2007 & 0.015484 \tabularnewline
15 & 0.208929 & 1.7728 & 0.040244 \tabularnewline
16 & 0.167236 & 1.419 & 0.080101 \tabularnewline
17 & 0.134244 & 1.1391 & 0.129219 \tabularnewline
18 & 0.109275 & 0.9272 & 0.178452 \tabularnewline
19 & 0.090673 & 0.7694 & 0.222091 \tabularnewline
20 & 0.071839 & 0.6096 & 0.27203 \tabularnewline
21 & 0.052795 & 0.448 & 0.327755 \tabularnewline
22 & 0.041501 & 0.3521 & 0.362877 \tabularnewline
23 & 0.02583 & 0.2192 & 0.413568 \tabularnewline
24 & 0.007038 & 0.0597 & 0.476274 \tabularnewline
25 & -0.010747 & -0.0912 & 0.463796 \tabularnewline
26 & -0.024296 & -0.2062 & 0.418624 \tabularnewline
27 & -0.034671 & -0.2942 & 0.384729 \tabularnewline
28 & -0.033895 & -0.2876 & 0.387237 \tabularnewline
29 & -0.021596 & -0.1833 & 0.427558 \tabularnewline
30 & -0.00508 & -0.0431 & 0.482867 \tabularnewline
31 & -0.009169 & -0.0778 & 0.469102 \tabularnewline
32 & -0.017322 & -0.147 & 0.441778 \tabularnewline
33 & -0.028861 & -0.2449 & 0.403617 \tabularnewline
34 & -0.046655 & -0.3959 & 0.346681 \tabularnewline
35 & -0.074941 & -0.6359 & 0.263431 \tabularnewline
36 & -0.106176 & -0.9009 & 0.185314 \tabularnewline
37 & -0.133271 & -1.1308 & 0.130938 \tabularnewline
38 & -0.155416 & -1.3187 & 0.095716 \tabularnewline
39 & -0.17373 & -1.4741 & 0.0724 \tabularnewline
40 & -0.188047 & -1.5956 & 0.057476 \tabularnewline
41 & -0.201235 & -1.7075 & 0.046016 \tabularnewline
42 & -0.221782 & -1.8819 & 0.031947 \tabularnewline
43 & -0.256316 & -2.1749 & 0.016461 \tabularnewline
44 & -0.29059 & -2.4657 & 0.008028 \tabularnewline
45 & -0.321553 & -2.7285 & 0.003995 \tabularnewline
46 & -0.350737 & -2.9761 & 0.001987 \tabularnewline
47 & -0.377018 & -3.1991 & 0.001025 \tabularnewline
48 & -0.399043 & -3.386 & 0.000576 \tabularnewline
\hline
\end{tabular}
%Source: https://freestatistics.org/blog/index.php?pk=&T=1

[TABLE]
[ROW][C]Autocorrelation Function[/C][/ROW]
[ROW][C]Time lag k[/C][C]ACF(k)[/C][C]T-STAT[/C][C]P-value[/C][/ROW]
[ROW][C]1[/C][C]0.940277[/C][C]7.9785[/C][C]0[/C][/ROW]
[ROW][C]2[/C][C]0.875939[/C][C]7.4326[/C][C]0[/C][/ROW]
[ROW][C]3[/C][C]0.815234[/C][C]6.9175[/C][C]0[/C][/ROW]
[ROW][C]4[/C][C]0.761292[/C][C]6.4598[/C][C]0[/C][/ROW]
[ROW][C]5[/C][C]0.717812[/C][C]6.0908[/C][C]0[/C][/ROW]
[ROW][C]6[/C][C]0.678139[/C][C]5.7542[/C][C]0[/C][/ROW]
[ROW][C]7[/C][C]0.646484[/C][C]5.4856[/C][C]0[/C][/ROW]
[ROW][C]8[/C][C]0.606773[/C][C]5.1486[/C][C]1e-06[/C][/ROW]
[ROW][C]9[/C][C]0.549488[/C][C]4.6626[/C][C]7e-06[/C][/ROW]
[ROW][C]10[/C][C]0.497766[/C][C]4.2237[/C][C]3.5e-05[/C][/ROW]
[ROW][C]11[/C][C]0.446133[/C][C]3.7856[/C][C]0.000157[/C][/ROW]
[ROW][C]12[/C][C]0.382504[/C][C]3.2457[/C][C]0.00089[/C][/ROW]
[ROW][C]13[/C][C]0.31859[/C][C]2.7033[/C][C]0.004279[/C][/ROW]
[ROW][C]14[/C][C]0.259352[/C][C]2.2007[/C][C]0.015484[/C][/ROW]
[ROW][C]15[/C][C]0.208929[/C][C]1.7728[/C][C]0.040244[/C][/ROW]
[ROW][C]16[/C][C]0.167236[/C][C]1.419[/C][C]0.080101[/C][/ROW]
[ROW][C]17[/C][C]0.134244[/C][C]1.1391[/C][C]0.129219[/C][/ROW]
[ROW][C]18[/C][C]0.109275[/C][C]0.9272[/C][C]0.178452[/C][/ROW]
[ROW][C]19[/C][C]0.090673[/C][C]0.7694[/C][C]0.222091[/C][/ROW]
[ROW][C]20[/C][C]0.071839[/C][C]0.6096[/C][C]0.27203[/C][/ROW]
[ROW][C]21[/C][C]0.052795[/C][C]0.448[/C][C]0.327755[/C][/ROW]
[ROW][C]22[/C][C]0.041501[/C][C]0.3521[/C][C]0.362877[/C][/ROW]
[ROW][C]23[/C][C]0.02583[/C][C]0.2192[/C][C]0.413568[/C][/ROW]
[ROW][C]24[/C][C]0.007038[/C][C]0.0597[/C][C]0.476274[/C][/ROW]
[ROW][C]25[/C][C]-0.010747[/C][C]-0.0912[/C][C]0.463796[/C][/ROW]
[ROW][C]26[/C][C]-0.024296[/C][C]-0.2062[/C][C]0.418624[/C][/ROW]
[ROW][C]27[/C][C]-0.034671[/C][C]-0.2942[/C][C]0.384729[/C][/ROW]
[ROW][C]28[/C][C]-0.033895[/C][C]-0.2876[/C][C]0.387237[/C][/ROW]
[ROW][C]29[/C][C]-0.021596[/C][C]-0.1833[/C][C]0.427558[/C][/ROW]
[ROW][C]30[/C][C]-0.00508[/C][C]-0.0431[/C][C]0.482867[/C][/ROW]
[ROW][C]31[/C][C]-0.009169[/C][C]-0.0778[/C][C]0.469102[/C][/ROW]
[ROW][C]32[/C][C]-0.017322[/C][C]-0.147[/C][C]0.441778[/C][/ROW]
[ROW][C]33[/C][C]-0.028861[/C][C]-0.2449[/C][C]0.403617[/C][/ROW]
[ROW][C]34[/C][C]-0.046655[/C][C]-0.3959[/C][C]0.346681[/C][/ROW]
[ROW][C]35[/C][C]-0.074941[/C][C]-0.6359[/C][C]0.263431[/C][/ROW]
[ROW][C]36[/C][C]-0.106176[/C][C]-0.9009[/C][C]0.185314[/C][/ROW]
[ROW][C]37[/C][C]-0.133271[/C][C]-1.1308[/C][C]0.130938[/C][/ROW]
[ROW][C]38[/C][C]-0.155416[/C][C]-1.3187[/C][C]0.095716[/C][/ROW]
[ROW][C]39[/C][C]-0.17373[/C][C]-1.4741[/C][C]0.0724[/C][/ROW]
[ROW][C]40[/C][C]-0.188047[/C][C]-1.5956[/C][C]0.057476[/C][/ROW]
[ROW][C]41[/C][C]-0.201235[/C][C]-1.7075[/C][C]0.046016[/C][/ROW]
[ROW][C]42[/C][C]-0.221782[/C][C]-1.8819[/C][C]0.031947[/C][/ROW]
[ROW][C]43[/C][C]-0.256316[/C][C]-2.1749[/C][C]0.016461[/C][/ROW]
[ROW][C]44[/C][C]-0.29059[/C][C]-2.4657[/C][C]0.008028[/C][/ROW]
[ROW][C]45[/C][C]-0.321553[/C][C]-2.7285[/C][C]0.003995[/C][/ROW]
[ROW][C]46[/C][C]-0.350737[/C][C]-2.9761[/C][C]0.001987[/C][/ROW]
[ROW][C]47[/C][C]-0.377018[/C][C]-3.1991[/C][C]0.001025[/C][/ROW]
[ROW][C]48[/C][C]-0.399043[/C][C]-3.386[/C][C]0.000576[/C][/ROW]
[/TABLE]
Source: https://freestatistics.org/blog/index.php?pk=&T=1

Globally Unique Identifier (entire table): ba.freestatistics.org/blog/index.php?pk=&T=1

As an alternative you can also use a QR Code:  

The GUIDs for individual cells are displayed in the table below:

Autocorrelation Function
Time lag kACF(k)T-STATP-value
10.9402777.97850
20.8759397.43260
30.8152346.91750
40.7612926.45980
50.7178126.09080
60.6781395.75420
70.6464845.48560
80.6067735.14861e-06
90.5494884.66267e-06
100.4977664.22373.5e-05
110.4461333.78560.000157
120.3825043.24570.00089
130.318592.70330.004279
140.2593522.20070.015484
150.2089291.77280.040244
160.1672361.4190.080101
170.1342441.13910.129219
180.1092750.92720.178452
190.0906730.76940.222091
200.0718390.60960.27203
210.0527950.4480.327755
220.0415010.35210.362877
230.025830.21920.413568
240.0070380.05970.476274
25-0.010747-0.09120.463796
26-0.024296-0.20620.418624
27-0.034671-0.29420.384729
28-0.033895-0.28760.387237
29-0.021596-0.18330.427558
30-0.00508-0.04310.482867
31-0.009169-0.07780.469102
32-0.017322-0.1470.441778
33-0.028861-0.24490.403617
34-0.046655-0.39590.346681
35-0.074941-0.63590.263431
36-0.106176-0.90090.185314
37-0.133271-1.13080.130938
38-0.155416-1.31870.095716
39-0.17373-1.47410.0724
40-0.188047-1.59560.057476
41-0.201235-1.70750.046016
42-0.221782-1.88190.031947
43-0.256316-2.17490.016461
44-0.29059-2.46570.008028
45-0.321553-2.72850.003995
46-0.350737-2.97610.001987
47-0.377018-3.19910.001025
48-0.399043-3.3860.000576


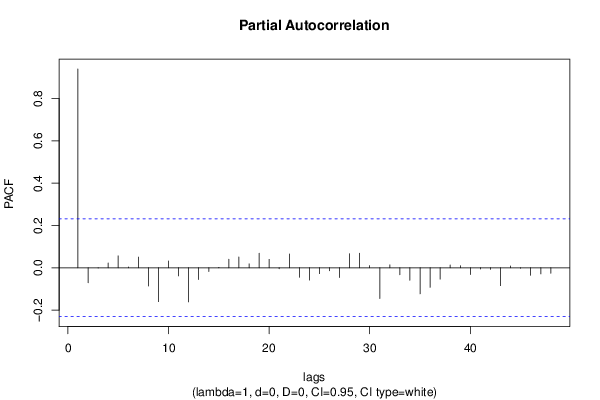
Partial Autocorrelation Function
Time lag kPACF(k)T-STATP-value
10.9402777.97850
2-0.070605-0.59910.275493
3-0.001344-0.01140.495466
40.0227780.19330.423642
50.0564740.47920.316624
60.0034980.02970.488202
70.0505320.42880.334683
8-0.085696-0.72720.234744
9-0.16016-1.3590.089193
100.0320980.27240.393064
11-0.038147-0.32370.373556
12-0.161333-1.3690.087635
13-0.055757-0.47310.318782
14-0.017515-0.14860.441133
150.0020460.01740.493099
160.0403410.34230.366561
170.0509090.4320.333523
180.0187880.15940.436892
190.0691790.5870.279518
200.040040.33970.367518
21-0.004349-0.03690.485331
220.0654150.55510.290285
23-0.04501-0.38190.351823
24-0.05814-0.49330.311639
25-0.027447-0.23290.408251
26-0.014165-0.12020.452331
27-0.046024-0.39050.348651
280.0662890.56250.287767
290.0691990.58720.279461
300.0105270.08930.464535
31-0.145286-1.23280.110832
320.0139050.1180.453202
33-0.032659-0.27710.391239
34-0.058531-0.49670.310474
35-0.123144-1.04490.149779
36-0.092425-0.78430.217732
37-0.053768-0.45620.324797
380.0134660.11430.454675
390.0098230.08340.466902
40-0.03186-0.27030.393834
41-0.005909-0.05010.480076
42-0.007639-0.06480.474249
43-0.084448-0.71660.237981
440.00830.07040.472025
45-0.002016-0.01710.493198
46-0.03502-0.29720.383601
47-0.028929-0.24550.403396
48-0.025948-0.22020.413177

\begin{tabular}{lllllllll}
\hline
Partial Autocorrelation Function \tabularnewline
Time lag k & PACF(k) & T-STAT & P-value \tabularnewline
1 & 0.940277 & 7.9785 & 0 \tabularnewline
2 & -0.070605 & -0.5991 & 0.275493 \tabularnewline
3 & -0.001344 & -0.0114 & 0.495466 \tabularnewline
4 & 0.022778 & 0.1933 & 0.423642 \tabularnewline
5 & 0.056474 & 0.4792 & 0.316624 \tabularnewline
6 & 0.003498 & 0.0297 & 0.488202 \tabularnewline
7 & 0.050532 & 0.4288 & 0.334683 \tabularnewline
8 & -0.085696 & -0.7272 & 0.234744 \tabularnewline
9 & -0.16016 & -1.359 & 0.089193 \tabularnewline
10 & 0.032098 & 0.2724 & 0.393064 \tabularnewline
11 & -0.038147 & -0.3237 & 0.373556 \tabularnewline
12 & -0.161333 & -1.369 & 0.087635 \tabularnewline
13 & -0.055757 & -0.4731 & 0.318782 \tabularnewline
14 & -0.017515 & -0.1486 & 0.441133 \tabularnewline
15 & 0.002046 & 0.0174 & 0.493099 \tabularnewline
16 & 0.040341 & 0.3423 & 0.366561 \tabularnewline
17 & 0.050909 & 0.432 & 0.333523 \tabularnewline
18 & 0.018788 & 0.1594 & 0.436892 \tabularnewline
19 & 0.069179 & 0.587 & 0.279518 \tabularnewline
20 & 0.04004 & 0.3397 & 0.367518 \tabularnewline
21 & -0.004349 & -0.0369 & 0.485331 \tabularnewline
22 & 0.065415 & 0.5551 & 0.290285 \tabularnewline
23 & -0.04501 & -0.3819 & 0.351823 \tabularnewline
24 & -0.05814 & -0.4933 & 0.311639 \tabularnewline
25 & -0.027447 & -0.2329 & 0.408251 \tabularnewline
26 & -0.014165 & -0.1202 & 0.452331 \tabularnewline
27 & -0.046024 & -0.3905 & 0.348651 \tabularnewline
28 & 0.066289 & 0.5625 & 0.287767 \tabularnewline
29 & 0.069199 & 0.5872 & 0.279461 \tabularnewline
30 & 0.010527 & 0.0893 & 0.464535 \tabularnewline
31 & -0.145286 & -1.2328 & 0.110832 \tabularnewline
32 & 0.013905 & 0.118 & 0.453202 \tabularnewline
33 & -0.032659 & -0.2771 & 0.391239 \tabularnewline
34 & -0.058531 & -0.4967 & 0.310474 \tabularnewline
35 & -0.123144 & -1.0449 & 0.149779 \tabularnewline
36 & -0.092425 & -0.7843 & 0.217732 \tabularnewline
37 & -0.053768 & -0.4562 & 0.324797 \tabularnewline
38 & 0.013466 & 0.1143 & 0.454675 \tabularnewline
39 & 0.009823 & 0.0834 & 0.466902 \tabularnewline
40 & -0.03186 & -0.2703 & 0.393834 \tabularnewline
41 & -0.005909 & -0.0501 & 0.480076 \tabularnewline
42 & -0.007639 & -0.0648 & 0.474249 \tabularnewline
43 & -0.084448 & -0.7166 & 0.237981 \tabularnewline
44 & 0.0083 & 0.0704 & 0.472025 \tabularnewline
45 & -0.002016 & -0.0171 & 0.493198 \tabularnewline
46 & -0.03502 & -0.2972 & 0.383601 \tabularnewline
47 & -0.028929 & -0.2455 & 0.403396 \tabularnewline
48 & -0.025948 & -0.2202 & 0.413177 \tabularnewline
\hline
\end{tabular}
%Source: https://freestatistics.org/blog/index.php?pk=&T=2

[TABLE]
[ROW][C]Partial Autocorrelation Function[/C][/ROW]
[ROW][C]Time lag k[/C][C]PACF(k)[/C][C]T-STAT[/C][C]P-value[/C][/ROW]
[ROW][C]1[/C][C]0.940277[/C][C]7.9785[/C][C]0[/C][/ROW]
[ROW][C]2[/C][C]-0.070605[/C][C]-0.5991[/C][C]0.275493[/C][/ROW]
[ROW][C]3[/C][C]-0.001344[/C][C]-0.0114[/C][C]0.495466[/C][/ROW]
[ROW][C]4[/C][C]0.022778[/C][C]0.1933[/C][C]0.423642[/C][/ROW]
[ROW][C]5[/C][C]0.056474[/C][C]0.4792[/C][C]0.316624[/C][/ROW]
[ROW][C]6[/C][C]0.003498[/C][C]0.0297[/C][C]0.488202[/C][/ROW]
[ROW][C]7[/C][C]0.050532[/C][C]0.4288[/C][C]0.334683[/C][/ROW]
[ROW][C]8[/C][C]-0.085696[/C][C]-0.7272[/C][C]0.234744[/C][/ROW]
[ROW][C]9[/C][C]-0.16016[/C][C]-1.359[/C][C]0.089193[/C][/ROW]
[ROW][C]10[/C][C]0.032098[/C][C]0.2724[/C][C]0.393064[/C][/ROW]
[ROW][C]11[/C][C]-0.038147[/C][C]-0.3237[/C][C]0.373556[/C][/ROW]
[ROW][C]12[/C][C]-0.161333[/C][C]-1.369[/C][C]0.087635[/C][/ROW]
[ROW][C]13[/C][C]-0.055757[/C][C]-0.4731[/C][C]0.318782[/C][/ROW]
[ROW][C]14[/C][C]-0.017515[/C][C]-0.1486[/C][C]0.441133[/C][/ROW]
[ROW][C]15[/C][C]0.002046[/C][C]0.0174[/C][C]0.493099[/C][/ROW]
[ROW][C]16[/C][C]0.040341[/C][C]0.3423[/C][C]0.366561[/C][/ROW]
[ROW][C]17[/C][C]0.050909[/C][C]0.432[/C][C]0.333523[/C][/ROW]
[ROW][C]18[/C][C]0.018788[/C][C]0.1594[/C][C]0.436892[/C][/ROW]
[ROW][C]19[/C][C]0.069179[/C][C]0.587[/C][C]0.279518[/C][/ROW]
[ROW][C]20[/C][C]0.04004[/C][C]0.3397[/C][C]0.367518[/C][/ROW]
[ROW][C]21[/C][C]-0.004349[/C][C]-0.0369[/C][C]0.485331[/C][/ROW]
[ROW][C]22[/C][C]0.065415[/C][C]0.5551[/C][C]0.290285[/C][/ROW]
[ROW][C]23[/C][C]-0.04501[/C][C]-0.3819[/C][C]0.351823[/C][/ROW]
[ROW][C]24[/C][C]-0.05814[/C][C]-0.4933[/C][C]0.311639[/C][/ROW]
[ROW][C]25[/C][C]-0.027447[/C][C]-0.2329[/C][C]0.408251[/C][/ROW]
[ROW][C]26[/C][C]-0.014165[/C][C]-0.1202[/C][C]0.452331[/C][/ROW]
[ROW][C]27[/C][C]-0.046024[/C][C]-0.3905[/C][C]0.348651[/C][/ROW]
[ROW][C]28[/C][C]0.066289[/C][C]0.5625[/C][C]0.287767[/C][/ROW]
[ROW][C]29[/C][C]0.069199[/C][C]0.5872[/C][C]0.279461[/C][/ROW]
[ROW][C]30[/C][C]0.010527[/C][C]0.0893[/C][C]0.464535[/C][/ROW]
[ROW][C]31[/C][C]-0.145286[/C][C]-1.2328[/C][C]0.110832[/C][/ROW]
[ROW][C]32[/C][C]0.013905[/C][C]0.118[/C][C]0.453202[/C][/ROW]
[ROW][C]33[/C][C]-0.032659[/C][C]-0.2771[/C][C]0.391239[/C][/ROW]
[ROW][C]34[/C][C]-0.058531[/C][C]-0.4967[/C][C]0.310474[/C][/ROW]
[ROW][C]35[/C][C]-0.123144[/C][C]-1.0449[/C][C]0.149779[/C][/ROW]
[ROW][C]36[/C][C]-0.092425[/C][C]-0.7843[/C][C]0.217732[/C][/ROW]
[ROW][C]37[/C][C]-0.053768[/C][C]-0.4562[/C][C]0.324797[/C][/ROW]
[ROW][C]38[/C][C]0.013466[/C][C]0.1143[/C][C]0.454675[/C][/ROW]
[ROW][C]39[/C][C]0.009823[/C][C]0.0834[/C][C]0.466902[/C][/ROW]
[ROW][C]40[/C][C]-0.03186[/C][C]-0.2703[/C][C]0.393834[/C][/ROW]
[ROW][C]41[/C][C]-0.005909[/C][C]-0.0501[/C][C]0.480076[/C][/ROW]
[ROW][C]42[/C][C]-0.007639[/C][C]-0.0648[/C][C]0.474249[/C][/ROW]
[ROW][C]43[/C][C]-0.084448[/C][C]-0.7166[/C][C]0.237981[/C][/ROW]
[ROW][C]44[/C][C]0.0083[/C][C]0.0704[/C][C]0.472025[/C][/ROW]
[ROW][C]45[/C][C]-0.002016[/C][C]-0.0171[/C][C]0.493198[/C][/ROW]
[ROW][C]46[/C][C]-0.03502[/C][C]-0.2972[/C][C]0.383601[/C][/ROW]
[ROW][C]47[/C][C]-0.028929[/C][C]-0.2455[/C][C]0.403396[/C][/ROW]
[ROW][C]48[/C][C]-0.025948[/C][C]-0.2202[/C][C]0.413177[/C][/ROW]
[/TABLE]
Source: https://freestatistics.org/blog/index.php?pk=&T=2

Globally Unique Identifier (entire table): ba.freestatistics.org/blog/index.php?pk=&T=2

As an alternative you can also use a QR Code:  

The GUIDs for individual cells are displayed in the table below:

Partial Autocorrelation Function
Time lag kPACF(k)T-STATP-value
10.9402777.97850
2-0.070605-0.59910.275493
3-0.001344-0.01140.495466
40.0227780.19330.423642
50.0564740.47920.316624
60.0034980.02970.488202
70.0505320.42880.334683
8-0.085696-0.72720.234744
9-0.16016-1.3590.089193
100.0320980.27240.393064
11-0.038147-0.32370.373556
12-0.161333-1.3690.087635
13-0.055757-0.47310.318782
14-0.017515-0.14860.441133
150.0020460.01740.493099
160.0403410.34230.366561
170.0509090.4320.333523
180.0187880.15940.436892
190.0691790.5870.279518
200.040040.33970.367518
21-0.004349-0.03690.485331
220.0654150.55510.290285
23-0.04501-0.38190.351823
24-0.05814-0.49330.311639
25-0.027447-0.23290.408251
26-0.014165-0.12020.452331
27-0.046024-0.39050.348651
280.0662890.56250.287767
290.0691990.58720.279461
300.0105270.08930.464535
31-0.145286-1.23280.110832
320.0139050.1180.453202
33-0.032659-0.27710.391239
34-0.058531-0.49670.310474
35-0.123144-1.04490.149779
36-0.092425-0.78430.217732
37-0.053768-0.45620.324797
380.0134660.11430.454675
390.0098230.08340.466902
40-0.03186-0.27030.393834
41-0.005909-0.05010.480076
42-0.007639-0.06480.474249
43-0.084448-0.71660.237981
440.00830.07040.472025
45-0.002016-0.01710.493198
46-0.03502-0.29720.383601
47-0.028929-0.24550.403396
48-0.025948-0.22020.413177


Parameters (Session):
par1 = 48 ; par2 = 1 ; par3 = 0 ; par4 = 0 ; par5 = 12 ; par6 = White Noise ; par7 = 0.95 ;
Parameters (R input):
par1 = 48 ; par2 = 1 ; par3 = 0 ; par4 = 0 ; par5 = 12 ; par6 = White Noise ; par7 = 0.95 ; par8 = ;
R code (references can be found in the software module):
if (par1 == 'Default') {
par1 = 10*log10(length(x))
} else {
par1 <- as.numeric(par1)
}
par2 <- as.numeric(par2)
par3 <- as.numeric(par3)
par4 <- as.numeric(par4)
par5 <- as.numeric(par5)
if (par6 == 'White Noise') par6 <- 'white' else par6 <- 'ma'
par7 <- as.numeric(par7)
if (par8 != '') par8 <- as.numeric(par8)
x <- na.omit(x)
ox <- x
if (par8 == '') {
if (par2 == 0) {
x <- log(x)
} else {
x <- (x ^ par2 - 1) / par2
}
} else {
x <- log(x,base=par8)
}
if (par3 > 0) x <- diff(x,lag=1,difference=par3)
if (par4 > 0) x <- diff(x,lag=par5,difference=par4)
bitmap(file='picts.png')
op <- par(mfrow=c(2,1))
plot(ox,type='l',main='Original Time Series',xlab='time',ylab='value')
if (par8=='') {
mytitle <- paste('Working Time Series (lambda=',par2,', d=',par3,', D=',par4,')',sep='')
mysub <- paste('(lambda=',par2,', d=',par3,', D=',par4,', CI=', par7, ', CI type=',par6,')',sep='')
} else {
mytitle <- paste('Working Time Series (base=',par8,', d=',par3,', D=',par4,')',sep='')
mysub <- paste('(base=',par8,', d=',par3,', D=',par4,', CI=', par7, ', CI type=',par6,')',sep='')
}
plot(x,type='l', main=mytitle,xlab='time',ylab='value')
par(op)
dev.off()
bitmap(file='pic1.png')
racf <- acf(x, par1, main='Autocorrelation', xlab='time lag', ylab='ACF', ci.type=par6, ci=par7, sub=mysub)
dev.off()
bitmap(file='pic2.png')
rpacf <- pacf(x,par1,main='Partial Autocorrelation',xlab='lags',ylab='PACF',sub=mysub)
dev.off()
(myacf <- c(racf$acf))
(mypacf <- c(rpacf$acf))
lengthx <- length(x)
sqrtn <- sqrt(lengthx)
load(file='createtable')
a<-table.start()
a<-table.row.start(a)
a<-table.element(a,'Autocorrelation Function',4,TRUE)
a<-table.row.end(a)
a<-table.row.start(a)
a<-table.element(a,'Time lag k',header=TRUE)
a<-table.element(a,hyperlink('basics.htm','ACF(k)','click here for more information about the Autocorrelation Function'),header=TRUE)
a<-table.element(a,'T-STAT',header=TRUE)
a<-table.element(a,'P-value',header=TRUE)
a<-table.row.end(a)
for (i in 2:(par1+1)) {
a<-table.row.start(a)
a<-table.element(a,i-1,header=TRUE)
a<-table.element(a,round(myacf[i],6))
mytstat <- myacf[i]*sqrtn
a<-table.element(a,round(mytstat,4))
a<-table.element(a,round(1-pt(abs(mytstat),lengthx),6))
a<-table.row.end(a)
}
a<-table.end(a)
table.save(a,file='mytable.tab')
a<-table.start()
a<-table.row.start(a)
a<-table.element(a,'Partial Autocorrelation Function',4,TRUE)
a<-table.row.end(a)
a<-table.row.start(a)
a<-table.element(a,'Time lag k',header=TRUE)
a<-table.element(a,hyperlink('basics.htm','PACF(k)','click here for more information about the Partial Autocorrelation Function'),header=TRUE)
a<-table.element(a,'T-STAT',header=TRUE)
a<-table.element(a,'P-value',header=TRUE)
a<-table.row.end(a)
for (i in 1:par1) {
a<-table.row.start(a)
a<-table.element(a,i,header=TRUE)
a<-table.element(a,round(mypacf[i],6))
mytstat <- mypacf[i]*sqrtn
a<-table.element(a,round(mytstat,4))
a<-table.element(a,round(1-pt(abs(mytstat),lengthx),6))
a<-table.row.end(a)
}
a<-table.end(a)
table.save(a,file='mytable1.tab')