Free Statistics

of Irreproducible Research!

Author's title

Author*Unverified author*
R Software Modulerwasp_autocorrelation.wasp
Title produced by software(Partial) Autocorrelation Function
Date of computationWed, 19 Oct 2016 11:04:10 +0100
Cite this page as followsStatistical Computations at FreeStatistics.org, Office for Research Development and Education, URL https://freestatistics.org/blog/index.php?v=date/2016/Oct/19/t1476871500x2clodhnbdlyxj3.htm/, Retrieved Tue, 30 Apr 2024 08:35:25 +0200
Statistical Computations at FreeStatistics.org, Office for Research Development and Education, URL https://freestatistics.org/blog/index.php?pk=, Retrieved Tue, 30 Apr 2024 08:35:25 +0200
QR Codes:

Original text written by user:
IsPrivate?No (this computation is public)
User-defined keywords
Estimated Impact0
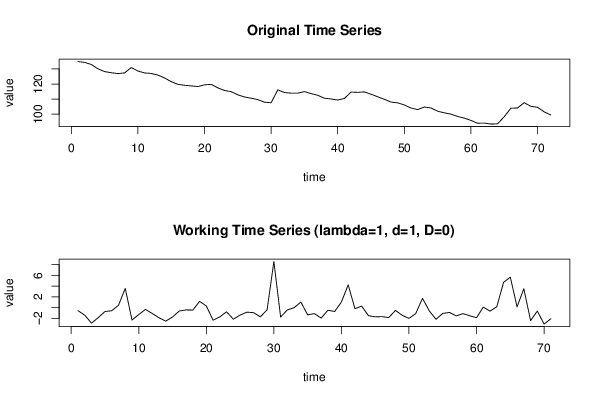
Dataseries X:
134.93
134.37
132.98
130.1
128.24
127.52
126.94
127.38
130.95
128.65
127.37
127.04
125.95
124.06
121.55
119.82
119.19
118.77
118.31
119.47
119.79
117.46
115.74
114.97
112.83
111.44
110.6
109.67
107.96
107.56
116.12
114.38
113.96
113.95
114.99
113.64
112.53
110.59
110.1
109.38
110.43
114.67
114.48
114.76
113.27
111.56
109.89
108.04
107.53
106.11
104.11
103
104.74
104.14
101.98
100.91
100.02
98.49
97.38
95.86
93.99
94.09
93.44
93.61
98.31
103.97
104.12
107.63
105.22
104.59
101.54
99.47


Summary of computational transaction
Raw Inputview raw input (R code)
Raw Outputview raw output of R engine
Computing time1 seconds
R Server'Gwilym Jenkins' @ jenkins.wessa.net

\begin{tabular}{lllllllll}
\hline
Summary of computational transaction \tabularnewline
Raw Input & view raw input (R code)  \tabularnewline
Raw Output & view raw output of R engine  \tabularnewline
Computing time & 1 seconds \tabularnewline
R Server & 'Gwilym Jenkins' @ jenkins.wessa.net \tabularnewline
\hline
\end{tabular}
%Source: https://freestatistics.org/blog/index.php?pk=&T=0

[TABLE]
[ROW][C]Summary of computational transaction[/C][/ROW]
[ROW][C]Raw Input[/C][C]view raw input (R code) [/C][/ROW]
[ROW][C]Raw Output[/C][C]view raw output of R engine [/C][/ROW]
[ROW][C]Computing time[/C][C]1 seconds[/C][/ROW]
[ROW][C]R Server[/C][C]'Gwilym Jenkins' @ jenkins.wessa.net[/C][/ROW]
[/TABLE]
Source: https://freestatistics.org/blog/index.php?pk=&T=0

Globally Unique Identifier (entire table): ba.freestatistics.org/blog/index.php?pk=&T=0

As an alternative you can also use a QR Code:  

The GUIDs for individual cells are displayed in the table below:

Summary of computational transaction
Raw Inputview raw input (R code)
Raw Outputview raw output of R engine
Computing time1 seconds
R Server'Gwilym Jenkins' @ jenkins.wessa.net


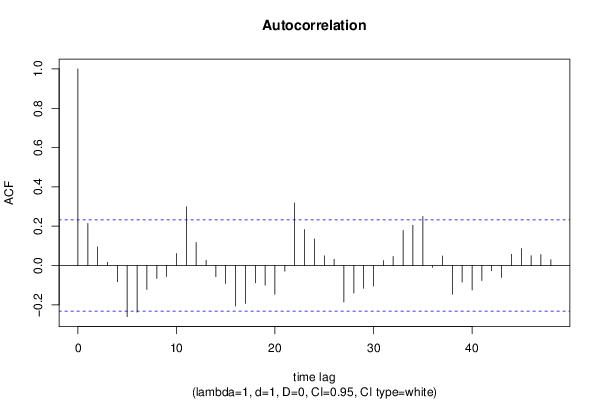
Autocorrelation Function
Time lag kACF(k)T-STATP-value
10.2139851.80310.03781
20.0944510.79590.214383
30.0158110.13320.447197
4-0.082545-0.69550.244496
5-0.260511-2.19510.015714
6-0.237686-2.00280.02451
7-0.121875-1.02690.153968
8-0.066757-0.56250.287773
9-0.056036-0.47220.319127
100.0612210.51590.303778
110.2988572.51820.007026
120.1171780.98740.163411
130.0266660.22470.411432
14-0.056889-0.47940.316579
15-0.091902-0.77440.220638
16-0.205931-1.73520.043522
17-0.192971-1.6260.05419
18-0.087995-0.74150.23043
19-0.10024-0.84460.200575
20-0.146937-1.23810.109876
21-0.029488-0.24850.402244
220.3182152.68130.004556
230.1829871.54190.063774
240.1343721.13220.130672
250.0487620.41090.341199
260.0310180.26140.397284
27-0.185878-1.56620.06087
28-0.140243-1.18170.120632
29-0.116048-0.97780.165736
30-0.104717-0.88240.190279
310.0246210.20750.418121
320.0459310.3870.349948
330.1782481.50190.068773
340.2046311.72430.044507
350.2485972.09470.019883
36-0.009828-0.08280.467118
370.0485880.40940.341736
38-0.146285-1.23260.110891
39-0.083926-0.70720.240886
40-0.12454-1.04940.148778
41-0.076999-0.64880.259279
42-0.026946-0.2270.410519
43-0.061111-0.51490.304101
440.0564680.47580.317835
450.0857650.72270.23613
460.0495820.41780.338682
470.0551680.46490.32173
480.0287940.24260.404497

\begin{tabular}{lllllllll}
\hline
Autocorrelation Function \tabularnewline
Time lag k & ACF(k) & T-STAT & P-value \tabularnewline
1 & 0.213985 & 1.8031 & 0.03781 \tabularnewline
2 & 0.094451 & 0.7959 & 0.214383 \tabularnewline
3 & 0.015811 & 0.1332 & 0.447197 \tabularnewline
4 & -0.082545 & -0.6955 & 0.244496 \tabularnewline
5 & -0.260511 & -2.1951 & 0.015714 \tabularnewline
6 & -0.237686 & -2.0028 & 0.02451 \tabularnewline
7 & -0.121875 & -1.0269 & 0.153968 \tabularnewline
8 & -0.066757 & -0.5625 & 0.287773 \tabularnewline
9 & -0.056036 & -0.4722 & 0.319127 \tabularnewline
10 & 0.061221 & 0.5159 & 0.303778 \tabularnewline
11 & 0.298857 & 2.5182 & 0.007026 \tabularnewline
12 & 0.117178 & 0.9874 & 0.163411 \tabularnewline
13 & 0.026666 & 0.2247 & 0.411432 \tabularnewline
14 & -0.056889 & -0.4794 & 0.316579 \tabularnewline
15 & -0.091902 & -0.7744 & 0.220638 \tabularnewline
16 & -0.205931 & -1.7352 & 0.043522 \tabularnewline
17 & -0.192971 & -1.626 & 0.05419 \tabularnewline
18 & -0.087995 & -0.7415 & 0.23043 \tabularnewline
19 & -0.10024 & -0.8446 & 0.200575 \tabularnewline
20 & -0.146937 & -1.2381 & 0.109876 \tabularnewline
21 & -0.029488 & -0.2485 & 0.402244 \tabularnewline
22 & 0.318215 & 2.6813 & 0.004556 \tabularnewline
23 & 0.182987 & 1.5419 & 0.063774 \tabularnewline
24 & 0.134372 & 1.1322 & 0.130672 \tabularnewline
25 & 0.048762 & 0.4109 & 0.341199 \tabularnewline
26 & 0.031018 & 0.2614 & 0.397284 \tabularnewline
27 & -0.185878 & -1.5662 & 0.06087 \tabularnewline
28 & -0.140243 & -1.1817 & 0.120632 \tabularnewline
29 & -0.116048 & -0.9778 & 0.165736 \tabularnewline
30 & -0.104717 & -0.8824 & 0.190279 \tabularnewline
31 & 0.024621 & 0.2075 & 0.418121 \tabularnewline
32 & 0.045931 & 0.387 & 0.349948 \tabularnewline
33 & 0.178248 & 1.5019 & 0.068773 \tabularnewline
34 & 0.204631 & 1.7243 & 0.044507 \tabularnewline
35 & 0.248597 & 2.0947 & 0.019883 \tabularnewline
36 & -0.009828 & -0.0828 & 0.467118 \tabularnewline
37 & 0.048588 & 0.4094 & 0.341736 \tabularnewline
38 & -0.146285 & -1.2326 & 0.110891 \tabularnewline
39 & -0.083926 & -0.7072 & 0.240886 \tabularnewline
40 & -0.12454 & -1.0494 & 0.148778 \tabularnewline
41 & -0.076999 & -0.6488 & 0.259279 \tabularnewline
42 & -0.026946 & -0.227 & 0.410519 \tabularnewline
43 & -0.061111 & -0.5149 & 0.304101 \tabularnewline
44 & 0.056468 & 0.4758 & 0.317835 \tabularnewline
45 & 0.085765 & 0.7227 & 0.23613 \tabularnewline
46 & 0.049582 & 0.4178 & 0.338682 \tabularnewline
47 & 0.055168 & 0.4649 & 0.32173 \tabularnewline
48 & 0.028794 & 0.2426 & 0.404497 \tabularnewline
\hline
\end{tabular}
%Source: https://freestatistics.org/blog/index.php?pk=&T=1

[TABLE]
[ROW][C]Autocorrelation Function[/C][/ROW]
[ROW][C]Time lag k[/C][C]ACF(k)[/C][C]T-STAT[/C][C]P-value[/C][/ROW]
[ROW][C]1[/C][C]0.213985[/C][C]1.8031[/C][C]0.03781[/C][/ROW]
[ROW][C]2[/C][C]0.094451[/C][C]0.7959[/C][C]0.214383[/C][/ROW]
[ROW][C]3[/C][C]0.015811[/C][C]0.1332[/C][C]0.447197[/C][/ROW]
[ROW][C]4[/C][C]-0.082545[/C][C]-0.6955[/C][C]0.244496[/C][/ROW]
[ROW][C]5[/C][C]-0.260511[/C][C]-2.1951[/C][C]0.015714[/C][/ROW]
[ROW][C]6[/C][C]-0.237686[/C][C]-2.0028[/C][C]0.02451[/C][/ROW]
[ROW][C]7[/C][C]-0.121875[/C][C]-1.0269[/C][C]0.153968[/C][/ROW]
[ROW][C]8[/C][C]-0.066757[/C][C]-0.5625[/C][C]0.287773[/C][/ROW]
[ROW][C]9[/C][C]-0.056036[/C][C]-0.4722[/C][C]0.319127[/C][/ROW]
[ROW][C]10[/C][C]0.061221[/C][C]0.5159[/C][C]0.303778[/C][/ROW]
[ROW][C]11[/C][C]0.298857[/C][C]2.5182[/C][C]0.007026[/C][/ROW]
[ROW][C]12[/C][C]0.117178[/C][C]0.9874[/C][C]0.163411[/C][/ROW]
[ROW][C]13[/C][C]0.026666[/C][C]0.2247[/C][C]0.411432[/C][/ROW]
[ROW][C]14[/C][C]-0.056889[/C][C]-0.4794[/C][C]0.316579[/C][/ROW]
[ROW][C]15[/C][C]-0.091902[/C][C]-0.7744[/C][C]0.220638[/C][/ROW]
[ROW][C]16[/C][C]-0.205931[/C][C]-1.7352[/C][C]0.043522[/C][/ROW]
[ROW][C]17[/C][C]-0.192971[/C][C]-1.626[/C][C]0.05419[/C][/ROW]
[ROW][C]18[/C][C]-0.087995[/C][C]-0.7415[/C][C]0.23043[/C][/ROW]
[ROW][C]19[/C][C]-0.10024[/C][C]-0.8446[/C][C]0.200575[/C][/ROW]
[ROW][C]20[/C][C]-0.146937[/C][C]-1.2381[/C][C]0.109876[/C][/ROW]
[ROW][C]21[/C][C]-0.029488[/C][C]-0.2485[/C][C]0.402244[/C][/ROW]
[ROW][C]22[/C][C]0.318215[/C][C]2.6813[/C][C]0.004556[/C][/ROW]
[ROW][C]23[/C][C]0.182987[/C][C]1.5419[/C][C]0.063774[/C][/ROW]
[ROW][C]24[/C][C]0.134372[/C][C]1.1322[/C][C]0.130672[/C][/ROW]
[ROW][C]25[/C][C]0.048762[/C][C]0.4109[/C][C]0.341199[/C][/ROW]
[ROW][C]26[/C][C]0.031018[/C][C]0.2614[/C][C]0.397284[/C][/ROW]
[ROW][C]27[/C][C]-0.185878[/C][C]-1.5662[/C][C]0.06087[/C][/ROW]
[ROW][C]28[/C][C]-0.140243[/C][C]-1.1817[/C][C]0.120632[/C][/ROW]
[ROW][C]29[/C][C]-0.116048[/C][C]-0.9778[/C][C]0.165736[/C][/ROW]
[ROW][C]30[/C][C]-0.104717[/C][C]-0.8824[/C][C]0.190279[/C][/ROW]
[ROW][C]31[/C][C]0.024621[/C][C]0.2075[/C][C]0.418121[/C][/ROW]
[ROW][C]32[/C][C]0.045931[/C][C]0.387[/C][C]0.349948[/C][/ROW]
[ROW][C]33[/C][C]0.178248[/C][C]1.5019[/C][C]0.068773[/C][/ROW]
[ROW][C]34[/C][C]0.204631[/C][C]1.7243[/C][C]0.044507[/C][/ROW]
[ROW][C]35[/C][C]0.248597[/C][C]2.0947[/C][C]0.019883[/C][/ROW]
[ROW][C]36[/C][C]-0.009828[/C][C]-0.0828[/C][C]0.467118[/C][/ROW]
[ROW][C]37[/C][C]0.048588[/C][C]0.4094[/C][C]0.341736[/C][/ROW]
[ROW][C]38[/C][C]-0.146285[/C][C]-1.2326[/C][C]0.110891[/C][/ROW]
[ROW][C]39[/C][C]-0.083926[/C][C]-0.7072[/C][C]0.240886[/C][/ROW]
[ROW][C]40[/C][C]-0.12454[/C][C]-1.0494[/C][C]0.148778[/C][/ROW]
[ROW][C]41[/C][C]-0.076999[/C][C]-0.6488[/C][C]0.259279[/C][/ROW]
[ROW][C]42[/C][C]-0.026946[/C][C]-0.227[/C][C]0.410519[/C][/ROW]
[ROW][C]43[/C][C]-0.061111[/C][C]-0.5149[/C][C]0.304101[/C][/ROW]
[ROW][C]44[/C][C]0.056468[/C][C]0.4758[/C][C]0.317835[/C][/ROW]
[ROW][C]45[/C][C]0.085765[/C][C]0.7227[/C][C]0.23613[/C][/ROW]
[ROW][C]46[/C][C]0.049582[/C][C]0.4178[/C][C]0.338682[/C][/ROW]
[ROW][C]47[/C][C]0.055168[/C][C]0.4649[/C][C]0.32173[/C][/ROW]
[ROW][C]48[/C][C]0.028794[/C][C]0.2426[/C][C]0.404497[/C][/ROW]
[/TABLE]
Source: https://freestatistics.org/blog/index.php?pk=&T=1

Globally Unique Identifier (entire table): ba.freestatistics.org/blog/index.php?pk=&T=1

As an alternative you can also use a QR Code:  

The GUIDs for individual cells are displayed in the table below:

Autocorrelation Function
Time lag kACF(k)T-STATP-value
10.2139851.80310.03781
20.0944510.79590.214383
30.0158110.13320.447197
4-0.082545-0.69550.244496
5-0.260511-2.19510.015714
6-0.237686-2.00280.02451
7-0.121875-1.02690.153968
8-0.066757-0.56250.287773
9-0.056036-0.47220.319127
100.0612210.51590.303778
110.2988572.51820.007026
120.1171780.98740.163411
130.0266660.22470.411432
14-0.056889-0.47940.316579
15-0.091902-0.77440.220638
16-0.205931-1.73520.043522
17-0.192971-1.6260.05419
18-0.087995-0.74150.23043
19-0.10024-0.84460.200575
20-0.146937-1.23810.109876
21-0.029488-0.24850.402244
220.3182152.68130.004556
230.1829871.54190.063774
240.1343721.13220.130672
250.0487620.41090.341199
260.0310180.26140.397284
27-0.185878-1.56620.06087
28-0.140243-1.18170.120632
29-0.116048-0.97780.165736
30-0.104717-0.88240.190279
310.0246210.20750.418121
320.0459310.3870.349948
330.1782481.50190.068773
340.2046311.72430.044507
350.2485972.09470.019883
36-0.009828-0.08280.467118
370.0485880.40940.341736
38-0.146285-1.23260.110891
39-0.083926-0.70720.240886
40-0.12454-1.04940.148778
41-0.076999-0.64880.259279
42-0.026946-0.2270.410519
43-0.061111-0.51490.304101
440.0564680.47580.317835
450.0857650.72270.23613
460.0495820.41780.338682
470.0551680.46490.32173
480.0287940.24260.404497


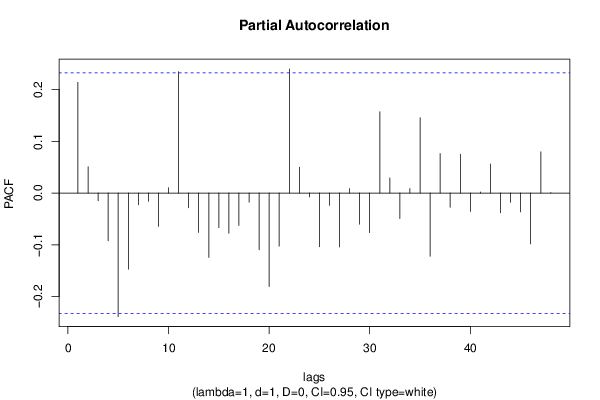
Partial Autocorrelation Function
Time lag kPACF(k)T-STATP-value
10.2139851.80310.03781
20.0509970.42970.334356
3-0.015007-0.12640.449867
4-0.092128-0.77630.220081
5-0.238886-2.01290.023959
6-0.146989-1.23860.109795
7-0.022565-0.19010.424873
8-0.015915-0.13410.446851
9-0.064373-0.54240.294615
100.0102690.08650.465646
110.2346561.97720.025949
12-0.028282-0.23830.406163
13-0.076239-0.64240.26134
14-0.124284-1.04720.149271
15-0.066839-0.56320.287539
16-0.077604-0.65390.257642
17-0.062535-0.52690.299942
18-0.017505-0.14750.441577
19-0.109626-0.92370.179379
20-0.180554-1.52140.066304
21-0.102631-0.86480.195034
220.2399472.02180.023482
230.049970.42110.337494
24-0.007492-0.06310.474922
25-0.103728-0.8740.192526
26-0.023732-0.20.421037
27-0.104002-0.87630.191901
280.0086390.07280.471087
29-0.060042-0.50590.307239
30-0.076407-0.64380.260884
310.1571391.32410.094862
320.0293360.24720.402737
33-0.049039-0.41320.34035
340.0085880.07240.471258
350.1455781.22670.112001
36-0.12214-1.02920.153446
370.0762830.64280.261221
38-0.027421-0.23110.408969
390.0750480.63240.264591
40-0.035768-0.30140.382
410.0022210.01870.492562
420.0563660.47490.318141
43-0.038115-0.32120.374516
44-0.017673-0.14890.441021
45-0.03634-0.30620.380172
46-0.098297-0.82830.205147
470.0796270.6710.252214
480.0003650.00310.498776

\begin{tabular}{lllllllll}
\hline
Partial Autocorrelation Function \tabularnewline
Time lag k & PACF(k) & T-STAT & P-value \tabularnewline
1 & 0.213985 & 1.8031 & 0.03781 \tabularnewline
2 & 0.050997 & 0.4297 & 0.334356 \tabularnewline
3 & -0.015007 & -0.1264 & 0.449867 \tabularnewline
4 & -0.092128 & -0.7763 & 0.220081 \tabularnewline
5 & -0.238886 & -2.0129 & 0.023959 \tabularnewline
6 & -0.146989 & -1.2386 & 0.109795 \tabularnewline
7 & -0.022565 & -0.1901 & 0.424873 \tabularnewline
8 & -0.015915 & -0.1341 & 0.446851 \tabularnewline
9 & -0.064373 & -0.5424 & 0.294615 \tabularnewline
10 & 0.010269 & 0.0865 & 0.465646 \tabularnewline
11 & 0.234656 & 1.9772 & 0.025949 \tabularnewline
12 & -0.028282 & -0.2383 & 0.406163 \tabularnewline
13 & -0.076239 & -0.6424 & 0.26134 \tabularnewline
14 & -0.124284 & -1.0472 & 0.149271 \tabularnewline
15 & -0.066839 & -0.5632 & 0.287539 \tabularnewline
16 & -0.077604 & -0.6539 & 0.257642 \tabularnewline
17 & -0.062535 & -0.5269 & 0.299942 \tabularnewline
18 & -0.017505 & -0.1475 & 0.441577 \tabularnewline
19 & -0.109626 & -0.9237 & 0.179379 \tabularnewline
20 & -0.180554 & -1.5214 & 0.066304 \tabularnewline
21 & -0.102631 & -0.8648 & 0.195034 \tabularnewline
22 & 0.239947 & 2.0218 & 0.023482 \tabularnewline
23 & 0.04997 & 0.4211 & 0.337494 \tabularnewline
24 & -0.007492 & -0.0631 & 0.474922 \tabularnewline
25 & -0.103728 & -0.874 & 0.192526 \tabularnewline
26 & -0.023732 & -0.2 & 0.421037 \tabularnewline
27 & -0.104002 & -0.8763 & 0.191901 \tabularnewline
28 & 0.008639 & 0.0728 & 0.471087 \tabularnewline
29 & -0.060042 & -0.5059 & 0.307239 \tabularnewline
30 & -0.076407 & -0.6438 & 0.260884 \tabularnewline
31 & 0.157139 & 1.3241 & 0.094862 \tabularnewline
32 & 0.029336 & 0.2472 & 0.402737 \tabularnewline
33 & -0.049039 & -0.4132 & 0.34035 \tabularnewline
34 & 0.008588 & 0.0724 & 0.471258 \tabularnewline
35 & 0.145578 & 1.2267 & 0.112001 \tabularnewline
36 & -0.12214 & -1.0292 & 0.153446 \tabularnewline
37 & 0.076283 & 0.6428 & 0.261221 \tabularnewline
38 & -0.027421 & -0.2311 & 0.408969 \tabularnewline
39 & 0.075048 & 0.6324 & 0.264591 \tabularnewline
40 & -0.035768 & -0.3014 & 0.382 \tabularnewline
41 & 0.002221 & 0.0187 & 0.492562 \tabularnewline
42 & 0.056366 & 0.4749 & 0.318141 \tabularnewline
43 & -0.038115 & -0.3212 & 0.374516 \tabularnewline
44 & -0.017673 & -0.1489 & 0.441021 \tabularnewline
45 & -0.03634 & -0.3062 & 0.380172 \tabularnewline
46 & -0.098297 & -0.8283 & 0.205147 \tabularnewline
47 & 0.079627 & 0.671 & 0.252214 \tabularnewline
48 & 0.000365 & 0.0031 & 0.498776 \tabularnewline
\hline
\end{tabular}
%Source: https://freestatistics.org/blog/index.php?pk=&T=2

[TABLE]
[ROW][C]Partial Autocorrelation Function[/C][/ROW]
[ROW][C]Time lag k[/C][C]PACF(k)[/C][C]T-STAT[/C][C]P-value[/C][/ROW]
[ROW][C]1[/C][C]0.213985[/C][C]1.8031[/C][C]0.03781[/C][/ROW]
[ROW][C]2[/C][C]0.050997[/C][C]0.4297[/C][C]0.334356[/C][/ROW]
[ROW][C]3[/C][C]-0.015007[/C][C]-0.1264[/C][C]0.449867[/C][/ROW]
[ROW][C]4[/C][C]-0.092128[/C][C]-0.7763[/C][C]0.220081[/C][/ROW]
[ROW][C]5[/C][C]-0.238886[/C][C]-2.0129[/C][C]0.023959[/C][/ROW]
[ROW][C]6[/C][C]-0.146989[/C][C]-1.2386[/C][C]0.109795[/C][/ROW]
[ROW][C]7[/C][C]-0.022565[/C][C]-0.1901[/C][C]0.424873[/C][/ROW]
[ROW][C]8[/C][C]-0.015915[/C][C]-0.1341[/C][C]0.446851[/C][/ROW]
[ROW][C]9[/C][C]-0.064373[/C][C]-0.5424[/C][C]0.294615[/C][/ROW]
[ROW][C]10[/C][C]0.010269[/C][C]0.0865[/C][C]0.465646[/C][/ROW]
[ROW][C]11[/C][C]0.234656[/C][C]1.9772[/C][C]0.025949[/C][/ROW]
[ROW][C]12[/C][C]-0.028282[/C][C]-0.2383[/C][C]0.406163[/C][/ROW]
[ROW][C]13[/C][C]-0.076239[/C][C]-0.6424[/C][C]0.26134[/C][/ROW]
[ROW][C]14[/C][C]-0.124284[/C][C]-1.0472[/C][C]0.149271[/C][/ROW]
[ROW][C]15[/C][C]-0.066839[/C][C]-0.5632[/C][C]0.287539[/C][/ROW]
[ROW][C]16[/C][C]-0.077604[/C][C]-0.6539[/C][C]0.257642[/C][/ROW]
[ROW][C]17[/C][C]-0.062535[/C][C]-0.5269[/C][C]0.299942[/C][/ROW]
[ROW][C]18[/C][C]-0.017505[/C][C]-0.1475[/C][C]0.441577[/C][/ROW]
[ROW][C]19[/C][C]-0.109626[/C][C]-0.9237[/C][C]0.179379[/C][/ROW]
[ROW][C]20[/C][C]-0.180554[/C][C]-1.5214[/C][C]0.066304[/C][/ROW]
[ROW][C]21[/C][C]-0.102631[/C][C]-0.8648[/C][C]0.195034[/C][/ROW]
[ROW][C]22[/C][C]0.239947[/C][C]2.0218[/C][C]0.023482[/C][/ROW]
[ROW][C]23[/C][C]0.04997[/C][C]0.4211[/C][C]0.337494[/C][/ROW]
[ROW][C]24[/C][C]-0.007492[/C][C]-0.0631[/C][C]0.474922[/C][/ROW]
[ROW][C]25[/C][C]-0.103728[/C][C]-0.874[/C][C]0.192526[/C][/ROW]
[ROW][C]26[/C][C]-0.023732[/C][C]-0.2[/C][C]0.421037[/C][/ROW]
[ROW][C]27[/C][C]-0.104002[/C][C]-0.8763[/C][C]0.191901[/C][/ROW]
[ROW][C]28[/C][C]0.008639[/C][C]0.0728[/C][C]0.471087[/C][/ROW]
[ROW][C]29[/C][C]-0.060042[/C][C]-0.5059[/C][C]0.307239[/C][/ROW]
[ROW][C]30[/C][C]-0.076407[/C][C]-0.6438[/C][C]0.260884[/C][/ROW]
[ROW][C]31[/C][C]0.157139[/C][C]1.3241[/C][C]0.094862[/C][/ROW]
[ROW][C]32[/C][C]0.029336[/C][C]0.2472[/C][C]0.402737[/C][/ROW]
[ROW][C]33[/C][C]-0.049039[/C][C]-0.4132[/C][C]0.34035[/C][/ROW]
[ROW][C]34[/C][C]0.008588[/C][C]0.0724[/C][C]0.471258[/C][/ROW]
[ROW][C]35[/C][C]0.145578[/C][C]1.2267[/C][C]0.112001[/C][/ROW]
[ROW][C]36[/C][C]-0.12214[/C][C]-1.0292[/C][C]0.153446[/C][/ROW]
[ROW][C]37[/C][C]0.076283[/C][C]0.6428[/C][C]0.261221[/C][/ROW]
[ROW][C]38[/C][C]-0.027421[/C][C]-0.2311[/C][C]0.408969[/C][/ROW]
[ROW][C]39[/C][C]0.075048[/C][C]0.6324[/C][C]0.264591[/C][/ROW]
[ROW][C]40[/C][C]-0.035768[/C][C]-0.3014[/C][C]0.382[/C][/ROW]
[ROW][C]41[/C][C]0.002221[/C][C]0.0187[/C][C]0.492562[/C][/ROW]
[ROW][C]42[/C][C]0.056366[/C][C]0.4749[/C][C]0.318141[/C][/ROW]
[ROW][C]43[/C][C]-0.038115[/C][C]-0.3212[/C][C]0.374516[/C][/ROW]
[ROW][C]44[/C][C]-0.017673[/C][C]-0.1489[/C][C]0.441021[/C][/ROW]
[ROW][C]45[/C][C]-0.03634[/C][C]-0.3062[/C][C]0.380172[/C][/ROW]
[ROW][C]46[/C][C]-0.098297[/C][C]-0.8283[/C][C]0.205147[/C][/ROW]
[ROW][C]47[/C][C]0.079627[/C][C]0.671[/C][C]0.252214[/C][/ROW]
[ROW][C]48[/C][C]0.000365[/C][C]0.0031[/C][C]0.498776[/C][/ROW]
[/TABLE]
Source: https://freestatistics.org/blog/index.php?pk=&T=2

Globally Unique Identifier (entire table): ba.freestatistics.org/blog/index.php?pk=&T=2

As an alternative you can also use a QR Code:  

The GUIDs for individual cells are displayed in the table below:

Partial Autocorrelation Function
Time lag kPACF(k)T-STATP-value
10.2139851.80310.03781
20.0509970.42970.334356
3-0.015007-0.12640.449867
4-0.092128-0.77630.220081
5-0.238886-2.01290.023959
6-0.146989-1.23860.109795
7-0.022565-0.19010.424873
8-0.015915-0.13410.446851
9-0.064373-0.54240.294615
100.0102690.08650.465646
110.2346561.97720.025949
12-0.028282-0.23830.406163
13-0.076239-0.64240.26134
14-0.124284-1.04720.149271
15-0.066839-0.56320.287539
16-0.077604-0.65390.257642
17-0.062535-0.52690.299942
18-0.017505-0.14750.441577
19-0.109626-0.92370.179379
20-0.180554-1.52140.066304
21-0.102631-0.86480.195034
220.2399472.02180.023482
230.049970.42110.337494
24-0.007492-0.06310.474922
25-0.103728-0.8740.192526
26-0.023732-0.20.421037
27-0.104002-0.87630.191901
280.0086390.07280.471087
29-0.060042-0.50590.307239
30-0.076407-0.64380.260884
310.1571391.32410.094862
320.0293360.24720.402737
33-0.049039-0.41320.34035
340.0085880.07240.471258
350.1455781.22670.112001
36-0.12214-1.02920.153446
370.0762830.64280.261221
38-0.027421-0.23110.408969
390.0750480.63240.264591
40-0.035768-0.30140.382
410.0022210.01870.492562
420.0563660.47490.318141
43-0.038115-0.32120.374516
44-0.017673-0.14890.441021
45-0.03634-0.30620.380172
46-0.098297-0.82830.205147
470.0796270.6710.252214
480.0003650.00310.498776


Parameters (Session):
par1 = 48 ; par2 = 1 ; par3 = 1 ; par4 = 0 ; par5 = 12 ; par6 = White Noise ; par7 = 0.95 ;
Parameters (R input):
par1 = 48 ; par2 = 1 ; par3 = 1 ; par4 = 0 ; par5 = 12 ; par6 = White Noise ; par7 = 0.95 ; par8 = ;
R code (references can be found in the software module):
par8 <- ''
par7 <- '0.95'
par6 <- 'White Noise'
par5 <- '12'
par4 <- '0'
par3 <- '0'
par2 <- '1'
par1 <- '48'
if (par1 == 'Default') {
par1 = 10*log10(length(x))
} else {
par1 <- as.numeric(par1)
}
par2 <- as.numeric(par2)
par3 <- as.numeric(par3)
par4 <- as.numeric(par4)
par5 <- as.numeric(par5)
if (par6 == 'White Noise') par6 <- 'white' else par6 <- 'ma'
par7 <- as.numeric(par7)
if (par8 != '') par8 <- as.numeric(par8)
x <- na.omit(x)
ox <- x
if (par8 == '') {
if (par2 == 0) {
x <- log(x)
} else {
x <- (x ^ par2 - 1) / par2
}
} else {
x <- log(x,base=par8)
}
if (par3 > 0) x <- diff(x,lag=1,difference=par3)
if (par4 > 0) x <- diff(x,lag=par5,difference=par4)
bitmap(file='picts.png')
op <- par(mfrow=c(2,1))
plot(ox,type='l',main='Original Time Series',xlab='time',ylab='value')
if (par8=='') {
mytitle <- paste('Working Time Series (lambda=',par2,', d=',par3,', D=',par4,')',sep='')
mysub <- paste('(lambda=',par2,', d=',par3,', D=',par4,', CI=', par7, ', CI type=',par6,')',sep='')
} else {
mytitle <- paste('Working Time Series (base=',par8,', d=',par3,', D=',par4,')',sep='')
mysub <- paste('(base=',par8,', d=',par3,', D=',par4,', CI=', par7, ', CI type=',par6,')',sep='')
}
plot(x,type='l', main=mytitle,xlab='time',ylab='value')
par(op)
dev.off()
bitmap(file='pic1.png')
racf <- acf(x, par1, main='Autocorrelation', xlab='time lag', ylab='ACF', ci.type=par6, ci=par7, sub=mysub)
dev.off()
bitmap(file='pic2.png')
rpacf <- pacf(x,par1,main='Partial Autocorrelation',xlab='lags',ylab='PACF',sub=mysub)
dev.off()
(myacf <- c(racf$acf))
(mypacf <- c(rpacf$acf))
lengthx <- length(x)
sqrtn <- sqrt(lengthx)
load(file='createtable')
a<-table.start()
a<-table.row.start(a)
a<-table.element(a,'Autocorrelation Function',4,TRUE)
a<-table.row.end(a)
a<-table.row.start(a)
a<-table.element(a,'Time lag k',header=TRUE)
a<-table.element(a,hyperlink('basics.htm','ACF(k)','click here for more information about the Autocorrelation Function'),header=TRUE)
a<-table.element(a,'T-STAT',header=TRUE)
a<-table.element(a,'P-value',header=TRUE)
a<-table.row.end(a)
for (i in 2:(par1+1)) {
a<-table.row.start(a)
a<-table.element(a,i-1,header=TRUE)
a<-table.element(a,round(myacf[i],6))
mytstat <- myacf[i]*sqrtn
a<-table.element(a,round(mytstat,4))
a<-table.element(a,round(1-pt(abs(mytstat),lengthx),6))
a<-table.row.end(a)
}
a<-table.end(a)
table.save(a,file='mytable.tab')
a<-table.start()
a<-table.row.start(a)
a<-table.element(a,'Partial Autocorrelation Function',4,TRUE)
a<-table.row.end(a)
a<-table.row.start(a)
a<-table.element(a,'Time lag k',header=TRUE)
a<-table.element(a,hyperlink('basics.htm','PACF(k)','click here for more information about the Partial Autocorrelation Function'),header=TRUE)
a<-table.element(a,'T-STAT',header=TRUE)
a<-table.element(a,'P-value',header=TRUE)
a<-table.row.end(a)
for (i in 1:par1) {
a<-table.row.start(a)
a<-table.element(a,i,header=TRUE)
a<-table.element(a,round(mypacf[i],6))
mytstat <- mypacf[i]*sqrtn
a<-table.element(a,round(mytstat,4))
a<-table.element(a,round(1-pt(abs(mytstat),lengthx),6))
a<-table.row.end(a)
}
a<-table.end(a)
table.save(a,file='mytable1.tab')