Free Statistics

of Irreproducible Research!

Author's title

Author*Unverified author*
R Software Modulerwasp_autocorrelation.wasp
Title produced by software(Partial) Autocorrelation Function
Date of computationWed, 19 Oct 2016 12:13:41 +0100
Cite this page as followsStatistical Computations at FreeStatistics.org, Office for Research Development and Education, URL https://freestatistics.org/blog/index.php?v=date/2016/Oct/19/t1476875725bt4eb74aemseczu.htm/, Retrieved Tue, 30 Apr 2024 04:33:06 +0200
Statistical Computations at FreeStatistics.org, Office for Research Development and Education, URL https://freestatistics.org/blog/index.php?pk=, Retrieved Tue, 30 Apr 2024 04:33:06 +0200
QR Codes:

Original text written by user:
IsPrivate?No (this computation is public)
User-defined keywords
Estimated Impact0
Dataseries X:
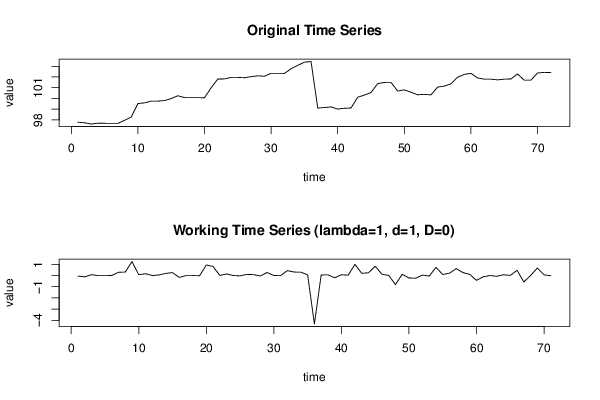
97,78
97,73
97,61
97,69
97,68
97,67
97,67
97,96
98,27
99,52
99,59
99,75
99,75
99,8
99,99
100,25
100,08
100,08
100,08
100,06
101
101,81
101,82
101,96
101,96
101,93
102,03
102,11
102,07
102,34
102,34
102,33
102,77
103,08
103,38
103,44
99,1
99,15
99,21
99,01
99,08
99,11
100,11
100,31
100,55
101,38
101,49
101,5
100,69
100,8
100,58
100,34
100,38
100,33
101,06
101,15
101,36
101,98
102,24
102,34
101,91
101,8
101,8
101,73
101,8
101,81
102,28
101,7
101,7
102,37
102,43
102,41


Summary of computational transaction
Raw Inputview raw input (R code)
Raw Outputview raw output of R engine
Computing time1 seconds
R Server'Sir Maurice George Kendall' @ kendall.wessa.net

\begin{tabular}{lllllllll}
\hline
Summary of computational transaction \tabularnewline
Raw Input & view raw input (R code)  \tabularnewline
Raw Output & view raw output of R engine  \tabularnewline
Computing time & 1 seconds \tabularnewline
R Server & 'Sir Maurice George Kendall' @ kendall.wessa.net \tabularnewline
\hline
\end{tabular}
%Source: https://freestatistics.org/blog/index.php?pk=&T=0

[TABLE]
[ROW][C]Summary of computational transaction[/C][/ROW]
[ROW][C]Raw Input[/C][C]view raw input (R code) [/C][/ROW]
[ROW][C]Raw Output[/C][C]view raw output of R engine [/C][/ROW]
[ROW][C]Computing time[/C][C]1 seconds[/C][/ROW]
[ROW][C]R Server[/C][C]'Sir Maurice George Kendall' @ kendall.wessa.net[/C][/ROW]
[/TABLE]
Source: https://freestatistics.org/blog/index.php?pk=&T=0

Globally Unique Identifier (entire table): ba.freestatistics.org/blog/index.php?pk=&T=0

As an alternative you can also use a QR Code:  

The GUIDs for individual cells are displayed in the table below:

Summary of computational transaction
Raw Inputview raw input (R code)
Raw Outputview raw output of R engine
Computing time1 seconds
R Server'Sir Maurice George Kendall' @ kendall.wessa.net


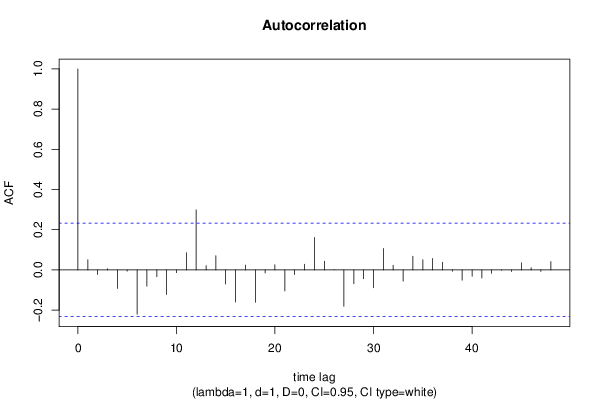
Autocorrelation Function
Time lag kACF(k)T-STATP-value
10.0507290.42750.335172
2-0.022557-0.19010.4249
30.0056310.04740.481146
4-0.092374-0.77840.219472
5-0.005975-0.05030.479993
6-0.22011-1.85470.033897
7-0.080869-0.68140.248914
8-0.033988-0.28640.387708
9-0.122505-1.03220.15273
10-0.013669-0.11520.454315
110.0854750.72020.236875
120.2987192.5170.007047
130.0214830.1810.428434
140.0708230.59680.276281
15-0.07014-0.5910.278197
16-0.159976-1.3480.090975
170.0237870.20040.420859
18-0.160853-1.35540.089797
19-0.015349-0.12930.44873
200.0260820.21980.413339
21-0.104524-0.88070.190716
22-0.023346-0.19670.422304
230.0280540.23640.406905
240.1614991.36080.088938
250.0431660.36370.358572
260.0004240.00360.498579
27-0.181305-1.52770.065515
28-0.069206-0.58310.280823
29-0.043886-0.36980.356319
30-0.08857-0.74630.228974
310.1067660.89960.18568
320.0225530.190.424911
33-0.055961-0.47150.319353
340.0681310.57410.283863
350.0504050.42470.336162
360.0566990.47780.317146
370.038090.32090.374596
38-0.006351-0.05350.478738
39-0.050773-0.42780.335039
40-0.031487-0.26530.395769
41-0.040191-0.33870.367933
42-0.017045-0.14360.443102
43-0.002155-0.01820.492782
44-0.008299-0.06990.472223
450.035130.2960.384041
460.01040.08760.465208
47-0.00734-0.06180.475429
480.0413150.34810.364388

\begin{tabular}{lllllllll}
\hline
Autocorrelation Function \tabularnewline
Time lag k & ACF(k) & T-STAT & P-value \tabularnewline
1 & 0.050729 & 0.4275 & 0.335172 \tabularnewline
2 & -0.022557 & -0.1901 & 0.4249 \tabularnewline
3 & 0.005631 & 0.0474 & 0.481146 \tabularnewline
4 & -0.092374 & -0.7784 & 0.219472 \tabularnewline
5 & -0.005975 & -0.0503 & 0.479993 \tabularnewline
6 & -0.22011 & -1.8547 & 0.033897 \tabularnewline
7 & -0.080869 & -0.6814 & 0.248914 \tabularnewline
8 & -0.033988 & -0.2864 & 0.387708 \tabularnewline
9 & -0.122505 & -1.0322 & 0.15273 \tabularnewline
10 & -0.013669 & -0.1152 & 0.454315 \tabularnewline
11 & 0.085475 & 0.7202 & 0.236875 \tabularnewline
12 & 0.298719 & 2.517 & 0.007047 \tabularnewline
13 & 0.021483 & 0.181 & 0.428434 \tabularnewline
14 & 0.070823 & 0.5968 & 0.276281 \tabularnewline
15 & -0.07014 & -0.591 & 0.278197 \tabularnewline
16 & -0.159976 & -1.348 & 0.090975 \tabularnewline
17 & 0.023787 & 0.2004 & 0.420859 \tabularnewline
18 & -0.160853 & -1.3554 & 0.089797 \tabularnewline
19 & -0.015349 & -0.1293 & 0.44873 \tabularnewline
20 & 0.026082 & 0.2198 & 0.413339 \tabularnewline
21 & -0.104524 & -0.8807 & 0.190716 \tabularnewline
22 & -0.023346 & -0.1967 & 0.422304 \tabularnewline
23 & 0.028054 & 0.2364 & 0.406905 \tabularnewline
24 & 0.161499 & 1.3608 & 0.088938 \tabularnewline
25 & 0.043166 & 0.3637 & 0.358572 \tabularnewline
26 & 0.000424 & 0.0036 & 0.498579 \tabularnewline
27 & -0.181305 & -1.5277 & 0.065515 \tabularnewline
28 & -0.069206 & -0.5831 & 0.280823 \tabularnewline
29 & -0.043886 & -0.3698 & 0.356319 \tabularnewline
30 & -0.08857 & -0.7463 & 0.228974 \tabularnewline
31 & 0.106766 & 0.8996 & 0.18568 \tabularnewline
32 & 0.022553 & 0.19 & 0.424911 \tabularnewline
33 & -0.055961 & -0.4715 & 0.319353 \tabularnewline
34 & 0.068131 & 0.5741 & 0.283863 \tabularnewline
35 & 0.050405 & 0.4247 & 0.336162 \tabularnewline
36 & 0.056699 & 0.4778 & 0.317146 \tabularnewline
37 & 0.03809 & 0.3209 & 0.374596 \tabularnewline
38 & -0.006351 & -0.0535 & 0.478738 \tabularnewline
39 & -0.050773 & -0.4278 & 0.335039 \tabularnewline
40 & -0.031487 & -0.2653 & 0.395769 \tabularnewline
41 & -0.040191 & -0.3387 & 0.367933 \tabularnewline
42 & -0.017045 & -0.1436 & 0.443102 \tabularnewline
43 & -0.002155 & -0.0182 & 0.492782 \tabularnewline
44 & -0.008299 & -0.0699 & 0.472223 \tabularnewline
45 & 0.03513 & 0.296 & 0.384041 \tabularnewline
46 & 0.0104 & 0.0876 & 0.465208 \tabularnewline
47 & -0.00734 & -0.0618 & 0.475429 \tabularnewline
48 & 0.041315 & 0.3481 & 0.364388 \tabularnewline
\hline
\end{tabular}
%Source: https://freestatistics.org/blog/index.php?pk=&T=1

[TABLE]
[ROW][C]Autocorrelation Function[/C][/ROW]
[ROW][C]Time lag k[/C][C]ACF(k)[/C][C]T-STAT[/C][C]P-value[/C][/ROW]
[ROW][C]1[/C][C]0.050729[/C][C]0.4275[/C][C]0.335172[/C][/ROW]
[ROW][C]2[/C][C]-0.022557[/C][C]-0.1901[/C][C]0.4249[/C][/ROW]
[ROW][C]3[/C][C]0.005631[/C][C]0.0474[/C][C]0.481146[/C][/ROW]
[ROW][C]4[/C][C]-0.092374[/C][C]-0.7784[/C][C]0.219472[/C][/ROW]
[ROW][C]5[/C][C]-0.005975[/C][C]-0.0503[/C][C]0.479993[/C][/ROW]
[ROW][C]6[/C][C]-0.22011[/C][C]-1.8547[/C][C]0.033897[/C][/ROW]
[ROW][C]7[/C][C]-0.080869[/C][C]-0.6814[/C][C]0.248914[/C][/ROW]
[ROW][C]8[/C][C]-0.033988[/C][C]-0.2864[/C][C]0.387708[/C][/ROW]
[ROW][C]9[/C][C]-0.122505[/C][C]-1.0322[/C][C]0.15273[/C][/ROW]
[ROW][C]10[/C][C]-0.013669[/C][C]-0.1152[/C][C]0.454315[/C][/ROW]
[ROW][C]11[/C][C]0.085475[/C][C]0.7202[/C][C]0.236875[/C][/ROW]
[ROW][C]12[/C][C]0.298719[/C][C]2.517[/C][C]0.007047[/C][/ROW]
[ROW][C]13[/C][C]0.021483[/C][C]0.181[/C][C]0.428434[/C][/ROW]
[ROW][C]14[/C][C]0.070823[/C][C]0.5968[/C][C]0.276281[/C][/ROW]
[ROW][C]15[/C][C]-0.07014[/C][C]-0.591[/C][C]0.278197[/C][/ROW]
[ROW][C]16[/C][C]-0.159976[/C][C]-1.348[/C][C]0.090975[/C][/ROW]
[ROW][C]17[/C][C]0.023787[/C][C]0.2004[/C][C]0.420859[/C][/ROW]
[ROW][C]18[/C][C]-0.160853[/C][C]-1.3554[/C][C]0.089797[/C][/ROW]
[ROW][C]19[/C][C]-0.015349[/C][C]-0.1293[/C][C]0.44873[/C][/ROW]
[ROW][C]20[/C][C]0.026082[/C][C]0.2198[/C][C]0.413339[/C][/ROW]
[ROW][C]21[/C][C]-0.104524[/C][C]-0.8807[/C][C]0.190716[/C][/ROW]
[ROW][C]22[/C][C]-0.023346[/C][C]-0.1967[/C][C]0.422304[/C][/ROW]
[ROW][C]23[/C][C]0.028054[/C][C]0.2364[/C][C]0.406905[/C][/ROW]
[ROW][C]24[/C][C]0.161499[/C][C]1.3608[/C][C]0.088938[/C][/ROW]
[ROW][C]25[/C][C]0.043166[/C][C]0.3637[/C][C]0.358572[/C][/ROW]
[ROW][C]26[/C][C]0.000424[/C][C]0.0036[/C][C]0.498579[/C][/ROW]
[ROW][C]27[/C][C]-0.181305[/C][C]-1.5277[/C][C]0.065515[/C][/ROW]
[ROW][C]28[/C][C]-0.069206[/C][C]-0.5831[/C][C]0.280823[/C][/ROW]
[ROW][C]29[/C][C]-0.043886[/C][C]-0.3698[/C][C]0.356319[/C][/ROW]
[ROW][C]30[/C][C]-0.08857[/C][C]-0.7463[/C][C]0.228974[/C][/ROW]
[ROW][C]31[/C][C]0.106766[/C][C]0.8996[/C][C]0.18568[/C][/ROW]
[ROW][C]32[/C][C]0.022553[/C][C]0.19[/C][C]0.424911[/C][/ROW]
[ROW][C]33[/C][C]-0.055961[/C][C]-0.4715[/C][C]0.319353[/C][/ROW]
[ROW][C]34[/C][C]0.068131[/C][C]0.5741[/C][C]0.283863[/C][/ROW]
[ROW][C]35[/C][C]0.050405[/C][C]0.4247[/C][C]0.336162[/C][/ROW]
[ROW][C]36[/C][C]0.056699[/C][C]0.4778[/C][C]0.317146[/C][/ROW]
[ROW][C]37[/C][C]0.03809[/C][C]0.3209[/C][C]0.374596[/C][/ROW]
[ROW][C]38[/C][C]-0.006351[/C][C]-0.0535[/C][C]0.478738[/C][/ROW]
[ROW][C]39[/C][C]-0.050773[/C][C]-0.4278[/C][C]0.335039[/C][/ROW]
[ROW][C]40[/C][C]-0.031487[/C][C]-0.2653[/C][C]0.395769[/C][/ROW]
[ROW][C]41[/C][C]-0.040191[/C][C]-0.3387[/C][C]0.367933[/C][/ROW]
[ROW][C]42[/C][C]-0.017045[/C][C]-0.1436[/C][C]0.443102[/C][/ROW]
[ROW][C]43[/C][C]-0.002155[/C][C]-0.0182[/C][C]0.492782[/C][/ROW]
[ROW][C]44[/C][C]-0.008299[/C][C]-0.0699[/C][C]0.472223[/C][/ROW]
[ROW][C]45[/C][C]0.03513[/C][C]0.296[/C][C]0.384041[/C][/ROW]
[ROW][C]46[/C][C]0.0104[/C][C]0.0876[/C][C]0.465208[/C][/ROW]
[ROW][C]47[/C][C]-0.00734[/C][C]-0.0618[/C][C]0.475429[/C][/ROW]
[ROW][C]48[/C][C]0.041315[/C][C]0.3481[/C][C]0.364388[/C][/ROW]
[/TABLE]
Source: https://freestatistics.org/blog/index.php?pk=&T=1

Globally Unique Identifier (entire table): ba.freestatistics.org/blog/index.php?pk=&T=1

As an alternative you can also use a QR Code:  

The GUIDs for individual cells are displayed in the table below:

Autocorrelation Function
Time lag kACF(k)T-STATP-value
10.0507290.42750.335172
2-0.022557-0.19010.4249
30.0056310.04740.481146
4-0.092374-0.77840.219472
5-0.005975-0.05030.479993
6-0.22011-1.85470.033897
7-0.080869-0.68140.248914
8-0.033988-0.28640.387708
9-0.122505-1.03220.15273
10-0.013669-0.11520.454315
110.0854750.72020.236875
120.2987192.5170.007047
130.0214830.1810.428434
140.0708230.59680.276281
15-0.07014-0.5910.278197
16-0.159976-1.3480.090975
170.0237870.20040.420859
18-0.160853-1.35540.089797
19-0.015349-0.12930.44873
200.0260820.21980.413339
21-0.104524-0.88070.190716
22-0.023346-0.19670.422304
230.0280540.23640.406905
240.1614991.36080.088938
250.0431660.36370.358572
260.0004240.00360.498579
27-0.181305-1.52770.065515
28-0.069206-0.58310.280823
29-0.043886-0.36980.356319
30-0.08857-0.74630.228974
310.1067660.89960.18568
320.0225530.190.424911
33-0.055961-0.47150.319353
340.0681310.57410.283863
350.0504050.42470.336162
360.0566990.47780.317146
370.038090.32090.374596
38-0.006351-0.05350.478738
39-0.050773-0.42780.335039
40-0.031487-0.26530.395769
41-0.040191-0.33870.367933
42-0.017045-0.14360.443102
43-0.002155-0.01820.492782
44-0.008299-0.06990.472223
450.035130.2960.384041
460.01040.08760.465208
47-0.00734-0.06180.475429
480.0413150.34810.364388


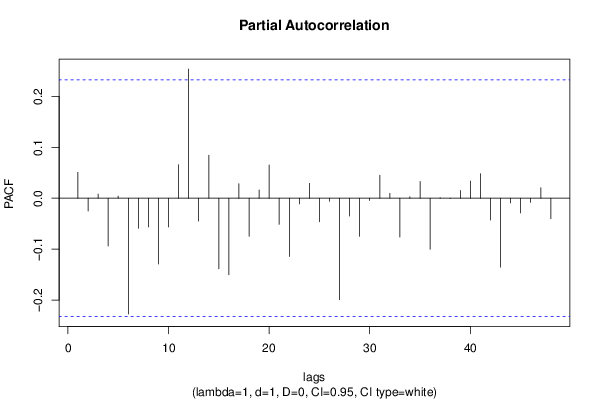
Partial Autocorrelation Function
Time lag kPACF(k)T-STATP-value
10.0507290.42750.335172
2-0.025195-0.21230.416242
30.0081080.06830.472862
4-0.093965-0.79180.215569
50.0041870.03530.485979
6-0.227546-1.91730.029609
7-0.058971-0.49690.310399
8-0.056403-0.47530.31803
9-0.12922-1.08880.139956
10-0.056427-0.47550.317958
110.0656070.55280.291064
120.2538572.1390.017936
13-0.044951-0.37880.352997
140.0842760.71010.239976
15-0.138686-1.16860.123239
16-0.150462-1.26780.104503
170.0284690.23990.405554
18-0.074609-0.62870.265791
190.0160580.13530.446377
200.065320.55040.291889
21-0.051342-0.43260.333303
22-0.114352-0.96350.169272
23-0.01122-0.09450.462473
240.0291090.24530.403474
25-0.046209-0.38940.349088
26-0.005968-0.05030.480019
27-0.19934-1.67970.048709
28-0.035008-0.2950.384435
29-0.074562-0.62830.26592
30-0.004612-0.03890.484555
310.0450360.37950.352732
320.0094870.07990.468255
33-0.076218-0.64220.261399
340.0030280.02550.489858
350.0327060.27560.391833
36-0.100357-0.84560.200301
370.0007810.00660.497385
38-0.000856-0.00720.497131
390.0150140.12650.449844
400.0336830.28380.388689
410.0481610.40580.34305
42-0.04276-0.36030.359845
43-0.13537-1.14070.128924
44-0.009444-0.07960.468398
45-0.028811-0.24280.404442
46-0.008194-0.0690.472574
470.0205430.17310.431532
48-0.040371-0.34020.367366

\begin{tabular}{lllllllll}
\hline
Partial Autocorrelation Function \tabularnewline
Time lag k & PACF(k) & T-STAT & P-value \tabularnewline
1 & 0.050729 & 0.4275 & 0.335172 \tabularnewline
2 & -0.025195 & -0.2123 & 0.416242 \tabularnewline
3 & 0.008108 & 0.0683 & 0.472862 \tabularnewline
4 & -0.093965 & -0.7918 & 0.215569 \tabularnewline
5 & 0.004187 & 0.0353 & 0.485979 \tabularnewline
6 & -0.227546 & -1.9173 & 0.029609 \tabularnewline
7 & -0.058971 & -0.4969 & 0.310399 \tabularnewline
8 & -0.056403 & -0.4753 & 0.31803 \tabularnewline
9 & -0.12922 & -1.0888 & 0.139956 \tabularnewline
10 & -0.056427 & -0.4755 & 0.317958 \tabularnewline
11 & 0.065607 & 0.5528 & 0.291064 \tabularnewline
12 & 0.253857 & 2.139 & 0.017936 \tabularnewline
13 & -0.044951 & -0.3788 & 0.352997 \tabularnewline
14 & 0.084276 & 0.7101 & 0.239976 \tabularnewline
15 & -0.138686 & -1.1686 & 0.123239 \tabularnewline
16 & -0.150462 & -1.2678 & 0.104503 \tabularnewline
17 & 0.028469 & 0.2399 & 0.405554 \tabularnewline
18 & -0.074609 & -0.6287 & 0.265791 \tabularnewline
19 & 0.016058 & 0.1353 & 0.446377 \tabularnewline
20 & 0.06532 & 0.5504 & 0.291889 \tabularnewline
21 & -0.051342 & -0.4326 & 0.333303 \tabularnewline
22 & -0.114352 & -0.9635 & 0.169272 \tabularnewline
23 & -0.01122 & -0.0945 & 0.462473 \tabularnewline
24 & 0.029109 & 0.2453 & 0.403474 \tabularnewline
25 & -0.046209 & -0.3894 & 0.349088 \tabularnewline
26 & -0.005968 & -0.0503 & 0.480019 \tabularnewline
27 & -0.19934 & -1.6797 & 0.048709 \tabularnewline
28 & -0.035008 & -0.295 & 0.384435 \tabularnewline
29 & -0.074562 & -0.6283 & 0.26592 \tabularnewline
30 & -0.004612 & -0.0389 & 0.484555 \tabularnewline
31 & 0.045036 & 0.3795 & 0.352732 \tabularnewline
32 & 0.009487 & 0.0799 & 0.468255 \tabularnewline
33 & -0.076218 & -0.6422 & 0.261399 \tabularnewline
34 & 0.003028 & 0.0255 & 0.489858 \tabularnewline
35 & 0.032706 & 0.2756 & 0.391833 \tabularnewline
36 & -0.100357 & -0.8456 & 0.200301 \tabularnewline
37 & 0.000781 & 0.0066 & 0.497385 \tabularnewline
38 & -0.000856 & -0.0072 & 0.497131 \tabularnewline
39 & 0.015014 & 0.1265 & 0.449844 \tabularnewline
40 & 0.033683 & 0.2838 & 0.388689 \tabularnewline
41 & 0.048161 & 0.4058 & 0.34305 \tabularnewline
42 & -0.04276 & -0.3603 & 0.359845 \tabularnewline
43 & -0.13537 & -1.1407 & 0.128924 \tabularnewline
44 & -0.009444 & -0.0796 & 0.468398 \tabularnewline
45 & -0.028811 & -0.2428 & 0.404442 \tabularnewline
46 & -0.008194 & -0.069 & 0.472574 \tabularnewline
47 & 0.020543 & 0.1731 & 0.431532 \tabularnewline
48 & -0.040371 & -0.3402 & 0.367366 \tabularnewline
\hline
\end{tabular}
%Source: https://freestatistics.org/blog/index.php?pk=&T=2

[TABLE]
[ROW][C]Partial Autocorrelation Function[/C][/ROW]
[ROW][C]Time lag k[/C][C]PACF(k)[/C][C]T-STAT[/C][C]P-value[/C][/ROW]
[ROW][C]1[/C][C]0.050729[/C][C]0.4275[/C][C]0.335172[/C][/ROW]
[ROW][C]2[/C][C]-0.025195[/C][C]-0.2123[/C][C]0.416242[/C][/ROW]
[ROW][C]3[/C][C]0.008108[/C][C]0.0683[/C][C]0.472862[/C][/ROW]
[ROW][C]4[/C][C]-0.093965[/C][C]-0.7918[/C][C]0.215569[/C][/ROW]
[ROW][C]5[/C][C]0.004187[/C][C]0.0353[/C][C]0.485979[/C][/ROW]
[ROW][C]6[/C][C]-0.227546[/C][C]-1.9173[/C][C]0.029609[/C][/ROW]
[ROW][C]7[/C][C]-0.058971[/C][C]-0.4969[/C][C]0.310399[/C][/ROW]
[ROW][C]8[/C][C]-0.056403[/C][C]-0.4753[/C][C]0.31803[/C][/ROW]
[ROW][C]9[/C][C]-0.12922[/C][C]-1.0888[/C][C]0.139956[/C][/ROW]
[ROW][C]10[/C][C]-0.056427[/C][C]-0.4755[/C][C]0.317958[/C][/ROW]
[ROW][C]11[/C][C]0.065607[/C][C]0.5528[/C][C]0.291064[/C][/ROW]
[ROW][C]12[/C][C]0.253857[/C][C]2.139[/C][C]0.017936[/C][/ROW]
[ROW][C]13[/C][C]-0.044951[/C][C]-0.3788[/C][C]0.352997[/C][/ROW]
[ROW][C]14[/C][C]0.084276[/C][C]0.7101[/C][C]0.239976[/C][/ROW]
[ROW][C]15[/C][C]-0.138686[/C][C]-1.1686[/C][C]0.123239[/C][/ROW]
[ROW][C]16[/C][C]-0.150462[/C][C]-1.2678[/C][C]0.104503[/C][/ROW]
[ROW][C]17[/C][C]0.028469[/C][C]0.2399[/C][C]0.405554[/C][/ROW]
[ROW][C]18[/C][C]-0.074609[/C][C]-0.6287[/C][C]0.265791[/C][/ROW]
[ROW][C]19[/C][C]0.016058[/C][C]0.1353[/C][C]0.446377[/C][/ROW]
[ROW][C]20[/C][C]0.06532[/C][C]0.5504[/C][C]0.291889[/C][/ROW]
[ROW][C]21[/C][C]-0.051342[/C][C]-0.4326[/C][C]0.333303[/C][/ROW]
[ROW][C]22[/C][C]-0.114352[/C][C]-0.9635[/C][C]0.169272[/C][/ROW]
[ROW][C]23[/C][C]-0.01122[/C][C]-0.0945[/C][C]0.462473[/C][/ROW]
[ROW][C]24[/C][C]0.029109[/C][C]0.2453[/C][C]0.403474[/C][/ROW]
[ROW][C]25[/C][C]-0.046209[/C][C]-0.3894[/C][C]0.349088[/C][/ROW]
[ROW][C]26[/C][C]-0.005968[/C][C]-0.0503[/C][C]0.480019[/C][/ROW]
[ROW][C]27[/C][C]-0.19934[/C][C]-1.6797[/C][C]0.048709[/C][/ROW]
[ROW][C]28[/C][C]-0.035008[/C][C]-0.295[/C][C]0.384435[/C][/ROW]
[ROW][C]29[/C][C]-0.074562[/C][C]-0.6283[/C][C]0.26592[/C][/ROW]
[ROW][C]30[/C][C]-0.004612[/C][C]-0.0389[/C][C]0.484555[/C][/ROW]
[ROW][C]31[/C][C]0.045036[/C][C]0.3795[/C][C]0.352732[/C][/ROW]
[ROW][C]32[/C][C]0.009487[/C][C]0.0799[/C][C]0.468255[/C][/ROW]
[ROW][C]33[/C][C]-0.076218[/C][C]-0.6422[/C][C]0.261399[/C][/ROW]
[ROW][C]34[/C][C]0.003028[/C][C]0.0255[/C][C]0.489858[/C][/ROW]
[ROW][C]35[/C][C]0.032706[/C][C]0.2756[/C][C]0.391833[/C][/ROW]
[ROW][C]36[/C][C]-0.100357[/C][C]-0.8456[/C][C]0.200301[/C][/ROW]
[ROW][C]37[/C][C]0.000781[/C][C]0.0066[/C][C]0.497385[/C][/ROW]
[ROW][C]38[/C][C]-0.000856[/C][C]-0.0072[/C][C]0.497131[/C][/ROW]
[ROW][C]39[/C][C]0.015014[/C][C]0.1265[/C][C]0.449844[/C][/ROW]
[ROW][C]40[/C][C]0.033683[/C][C]0.2838[/C][C]0.388689[/C][/ROW]
[ROW][C]41[/C][C]0.048161[/C][C]0.4058[/C][C]0.34305[/C][/ROW]
[ROW][C]42[/C][C]-0.04276[/C][C]-0.3603[/C][C]0.359845[/C][/ROW]
[ROW][C]43[/C][C]-0.13537[/C][C]-1.1407[/C][C]0.128924[/C][/ROW]
[ROW][C]44[/C][C]-0.009444[/C][C]-0.0796[/C][C]0.468398[/C][/ROW]
[ROW][C]45[/C][C]-0.028811[/C][C]-0.2428[/C][C]0.404442[/C][/ROW]
[ROW][C]46[/C][C]-0.008194[/C][C]-0.069[/C][C]0.472574[/C][/ROW]
[ROW][C]47[/C][C]0.020543[/C][C]0.1731[/C][C]0.431532[/C][/ROW]
[ROW][C]48[/C][C]-0.040371[/C][C]-0.3402[/C][C]0.367366[/C][/ROW]
[/TABLE]
Source: https://freestatistics.org/blog/index.php?pk=&T=2

Globally Unique Identifier (entire table): ba.freestatistics.org/blog/index.php?pk=&T=2

As an alternative you can also use a QR Code:  

The GUIDs for individual cells are displayed in the table below:

Partial Autocorrelation Function
Time lag kPACF(k)T-STATP-value
10.0507290.42750.335172
2-0.025195-0.21230.416242
30.0081080.06830.472862
4-0.093965-0.79180.215569
50.0041870.03530.485979
6-0.227546-1.91730.029609
7-0.058971-0.49690.310399
8-0.056403-0.47530.31803
9-0.12922-1.08880.139956
10-0.056427-0.47550.317958
110.0656070.55280.291064
120.2538572.1390.017936
13-0.044951-0.37880.352997
140.0842760.71010.239976
15-0.138686-1.16860.123239
16-0.150462-1.26780.104503
170.0284690.23990.405554
18-0.074609-0.62870.265791
190.0160580.13530.446377
200.065320.55040.291889
21-0.051342-0.43260.333303
22-0.114352-0.96350.169272
23-0.01122-0.09450.462473
240.0291090.24530.403474
25-0.046209-0.38940.349088
26-0.005968-0.05030.480019
27-0.19934-1.67970.048709
28-0.035008-0.2950.384435
29-0.074562-0.62830.26592
30-0.004612-0.03890.484555
310.0450360.37950.352732
320.0094870.07990.468255
33-0.076218-0.64220.261399
340.0030280.02550.489858
350.0327060.27560.391833
36-0.100357-0.84560.200301
370.0007810.00660.497385
38-0.000856-0.00720.497131
390.0150140.12650.449844
400.0336830.28380.388689
410.0481610.40580.34305
42-0.04276-0.36030.359845
43-0.13537-1.14070.128924
44-0.009444-0.07960.468398
45-0.028811-0.24280.404442
46-0.008194-0.0690.472574
470.0205430.17310.431532
48-0.040371-0.34020.367366


Parameters (Session):
par1 = 48 ; par2 = 1 ; par3 = 1 ; par4 = 0 ; par5 = 12 ; par6 = White Noise ; par7 = 0.95 ;
Parameters (R input):
par1 = 48 ; par2 = 1 ; par3 = 1 ; par4 = 0 ; par5 = 12 ; par6 = White Noise ; par7 = 0.95 ; par8 = ;
R code (references can be found in the software module):
if (par1 == 'Default') {
par1 = 10*log10(length(x))
} else {
par1 <- as.numeric(par1)
}
par2 <- as.numeric(par2)
par3 <- as.numeric(par3)
par4 <- as.numeric(par4)
par5 <- as.numeric(par5)
if (par6 == 'White Noise') par6 <- 'white' else par6 <- 'ma'
par7 <- as.numeric(par7)
if (par8 != '') par8 <- as.numeric(par8)
x <- na.omit(x)
ox <- x
if (par8 == '') {
if (par2 == 0) {
x <- log(x)
} else {
x <- (x ^ par2 - 1) / par2
}
} else {
x <- log(x,base=par8)
}
if (par3 > 0) x <- diff(x,lag=1,difference=par3)
if (par4 > 0) x <- diff(x,lag=par5,difference=par4)
bitmap(file='picts.png')
op <- par(mfrow=c(2,1))
plot(ox,type='l',main='Original Time Series',xlab='time',ylab='value')
if (par8=='') {
mytitle <- paste('Working Time Series (lambda=',par2,', d=',par3,', D=',par4,')',sep='')
mysub <- paste('(lambda=',par2,', d=',par3,', D=',par4,', CI=', par7, ', CI type=',par6,')',sep='')
} else {
mytitle <- paste('Working Time Series (base=',par8,', d=',par3,', D=',par4,')',sep='')
mysub <- paste('(base=',par8,', d=',par3,', D=',par4,', CI=', par7, ', CI type=',par6,')',sep='')
}
plot(x,type='l', main=mytitle,xlab='time',ylab='value')
par(op)
dev.off()
bitmap(file='pic1.png')
racf <- acf(x, par1, main='Autocorrelation', xlab='time lag', ylab='ACF', ci.type=par6, ci=par7, sub=mysub)
dev.off()
bitmap(file='pic2.png')
rpacf <- pacf(x,par1,main='Partial Autocorrelation',xlab='lags',ylab='PACF',sub=mysub)
dev.off()
(myacf <- c(racf$acf))
(mypacf <- c(rpacf$acf))
lengthx <- length(x)
sqrtn <- sqrt(lengthx)
load(file='createtable')
a<-table.start()
a<-table.row.start(a)
a<-table.element(a,'Autocorrelation Function',4,TRUE)
a<-table.row.end(a)
a<-table.row.start(a)
a<-table.element(a,'Time lag k',header=TRUE)
a<-table.element(a,hyperlink('basics.htm','ACF(k)','click here for more information about the Autocorrelation Function'),header=TRUE)
a<-table.element(a,'T-STAT',header=TRUE)
a<-table.element(a,'P-value',header=TRUE)
a<-table.row.end(a)
for (i in 2:(par1+1)) {
a<-table.row.start(a)
a<-table.element(a,i-1,header=TRUE)
a<-table.element(a,round(myacf[i],6))
mytstat <- myacf[i]*sqrtn
a<-table.element(a,round(mytstat,4))
a<-table.element(a,round(1-pt(abs(mytstat),lengthx),6))
a<-table.row.end(a)
}
a<-table.end(a)
table.save(a,file='mytable.tab')
a<-table.start()
a<-table.row.start(a)
a<-table.element(a,'Partial Autocorrelation Function',4,TRUE)
a<-table.row.end(a)
a<-table.row.start(a)
a<-table.element(a,'Time lag k',header=TRUE)
a<-table.element(a,hyperlink('basics.htm','PACF(k)','click here for more information about the Partial Autocorrelation Function'),header=TRUE)
a<-table.element(a,'T-STAT',header=TRUE)
a<-table.element(a,'P-value',header=TRUE)
a<-table.row.end(a)
for (i in 1:par1) {
a<-table.row.start(a)
a<-table.element(a,i,header=TRUE)
a<-table.element(a,round(mypacf[i],6))
mytstat <- mypacf[i]*sqrtn
a<-table.element(a,round(mytstat,4))
a<-table.element(a,round(1-pt(abs(mytstat),lengthx),6))
a<-table.row.end(a)
}
a<-table.end(a)
table.save(a,file='mytable1.tab')