Free Statistics

of Irreproducible Research!

Author's title

Author*Unverified author*
R Software Modulerwasp_autocorrelation.wasp
Title produced by software(Partial) Autocorrelation Function
Date of computationWed, 19 Oct 2016 12:16:02 +0100
Cite this page as followsStatistical Computations at FreeStatistics.org, Office for Research Development and Education, URL https://freestatistics.org/blog/index.php?v=date/2016/Oct/19/t14768757782p8krtvnmaqar5w.htm/, Retrieved Tue, 30 Apr 2024 04:28:29 +0200
Statistical Computations at FreeStatistics.org, Office for Research Development and Education, URL https://freestatistics.org/blog/index.php?pk=, Retrieved Tue, 30 Apr 2024 04:28:29 +0200
QR Codes:

Original text written by user:
IsPrivate?No (this computation is public)
User-defined keywords
Estimated Impact0
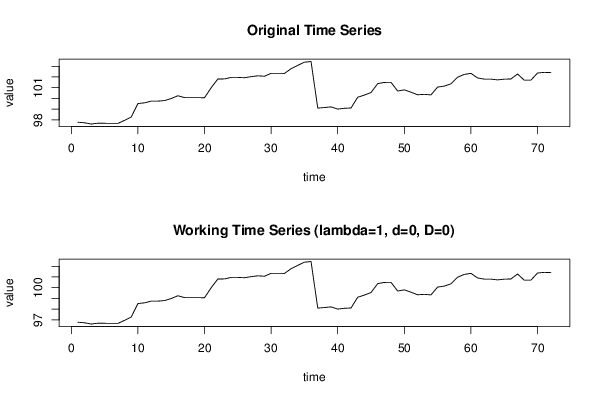
Dataseries X:
97.78
97.73
97.61
97.69
97.68
97.67
97.67
97.96
98.27
99.52
99.59
99.75
99.75
99.8
99.99
100.25
100.08
100.08
100.08
100.06
101
101.81
101.82
101.96
101.96
101.93
102.03
102.11
102.07
102.34
102.34
102.33
102.77
103.08
103.38
103.44
99.1
99.15
99.21
99.01
99.08
99.11
100.11
100.31
100.55
101.38
101.49
101.5
100.69
100.8
100.58
100.34
100.38
100.33
101.06
101.15
101.36
101.98
102.24
102.34
101.91
101.8
101.8
101.73
101.8
101.81
102.28
101.7
101.7
102.37
102.43
102.41


Summary of computational transaction
Raw Inputview raw input (R code)
Raw Outputview raw output of R engine
Computing time2 seconds
R Server'Sir Ronald Aylmer Fisher' @ fisher.wessa.net

\begin{tabular}{lllllllll}
\hline
Summary of computational transaction \tabularnewline
Raw Input & view raw input (R code)  \tabularnewline
Raw Output & view raw output of R engine  \tabularnewline
Computing time & 2 seconds \tabularnewline
R Server & 'Sir Ronald Aylmer Fisher' @ fisher.wessa.net \tabularnewline
\hline
\end{tabular}
%Source: https://freestatistics.org/blog/index.php?pk=&T=0

[TABLE]
[ROW][C]Summary of computational transaction[/C][/ROW]
[ROW][C]Raw Input[/C][C]view raw input (R code) [/C][/ROW]
[ROW][C]Raw Output[/C][C]view raw output of R engine [/C][/ROW]
[ROW][C]Computing time[/C][C]2 seconds[/C][/ROW]
[ROW][C]R Server[/C][C]'Sir Ronald Aylmer Fisher' @ fisher.wessa.net[/C][/ROW]
[/TABLE]
Source: https://freestatistics.org/blog/index.php?pk=&T=0

Globally Unique Identifier (entire table): ba.freestatistics.org/blog/index.php?pk=&T=0

As an alternative you can also use a QR Code:  

The GUIDs for individual cells are displayed in the table below:

Summary of computational transaction
Raw Inputview raw input (R code)
Raw Outputview raw output of R engine
Computing time2 seconds
R Server'Sir Ronald Aylmer Fisher' @ fisher.wessa.net


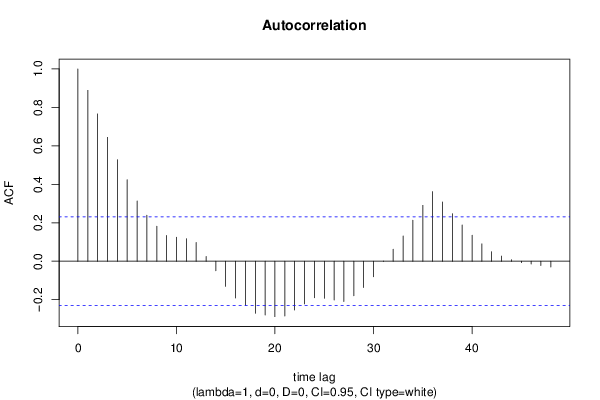
Autocorrelation Function
Time lag kACF(k)T-STATP-value
10.8884517.53880
20.7661996.50140
30.644215.46630
40.5275384.47631.4e-05
50.4235073.59360.000297
60.3128552.65470.004883
70.2393262.03080.022987
80.1817651.54230.063689
90.1338921.13610.129839
100.1243381.0550.147467
110.1170260.9930.162019
120.0969550.82270.2067
130.0249610.21180.416429
14-0.049804-0.42260.336922
15-0.13101-1.11170.134992
16-0.191764-1.62720.054035
17-0.22921-1.94490.027846
18-0.270277-2.29340.012374
19-0.279814-2.37430.010125
20-0.288352-2.44670.008429
21-0.285049-2.41870.009052
22-0.254223-2.15720.017166
23-0.22185-1.88250.031907
24-0.190534-1.61670.055154
25-0.192552-1.63390.053327
26-0.202146-1.71530.045298
27-0.209465-1.77740.039866
28-0.179314-1.52150.066253
29-0.136776-1.16060.124823
30-0.08083-0.68590.2475
31-0.001035-0.00880.496508
320.0626960.5320.298185
330.131581.11650.133961
340.2131081.80830.03737
350.2903682.46390.008067
360.3620213.07190.001501
370.3080362.61380.005449
380.2470622.09640.019781
390.1886011.60030.056952
400.1353281.14830.127324
410.0901750.76520.22334
420.0495020.420.337854
430.0264110.22410.411655
440.0079010.0670.473368
45-0.007318-0.06210.47533
46-0.014658-0.12440.450682
47-0.022093-0.18750.425911
48-0.029812-0.2530.40051

\begin{tabular}{lllllllll}
\hline
Autocorrelation Function \tabularnewline
Time lag k & ACF(k) & T-STAT & P-value \tabularnewline
1 & 0.888451 & 7.5388 & 0 \tabularnewline
2 & 0.766199 & 6.5014 & 0 \tabularnewline
3 & 0.64421 & 5.4663 & 0 \tabularnewline
4 & 0.527538 & 4.4763 & 1.4e-05 \tabularnewline
5 & 0.423507 & 3.5936 & 0.000297 \tabularnewline
6 & 0.312855 & 2.6547 & 0.004883 \tabularnewline
7 & 0.239326 & 2.0308 & 0.022987 \tabularnewline
8 & 0.181765 & 1.5423 & 0.063689 \tabularnewline
9 & 0.133892 & 1.1361 & 0.129839 \tabularnewline
10 & 0.124338 & 1.055 & 0.147467 \tabularnewline
11 & 0.117026 & 0.993 & 0.162019 \tabularnewline
12 & 0.096955 & 0.8227 & 0.2067 \tabularnewline
13 & 0.024961 & 0.2118 & 0.416429 \tabularnewline
14 & -0.049804 & -0.4226 & 0.336922 \tabularnewline
15 & -0.13101 & -1.1117 & 0.134992 \tabularnewline
16 & -0.191764 & -1.6272 & 0.054035 \tabularnewline
17 & -0.22921 & -1.9449 & 0.027846 \tabularnewline
18 & -0.270277 & -2.2934 & 0.012374 \tabularnewline
19 & -0.279814 & -2.3743 & 0.010125 \tabularnewline
20 & -0.288352 & -2.4467 & 0.008429 \tabularnewline
21 & -0.285049 & -2.4187 & 0.009052 \tabularnewline
22 & -0.254223 & -2.1572 & 0.017166 \tabularnewline
23 & -0.22185 & -1.8825 & 0.031907 \tabularnewline
24 & -0.190534 & -1.6167 & 0.055154 \tabularnewline
25 & -0.192552 & -1.6339 & 0.053327 \tabularnewline
26 & -0.202146 & -1.7153 & 0.045298 \tabularnewline
27 & -0.209465 & -1.7774 & 0.039866 \tabularnewline
28 & -0.179314 & -1.5215 & 0.066253 \tabularnewline
29 & -0.136776 & -1.1606 & 0.124823 \tabularnewline
30 & -0.08083 & -0.6859 & 0.2475 \tabularnewline
31 & -0.001035 & -0.0088 & 0.496508 \tabularnewline
32 & 0.062696 & 0.532 & 0.298185 \tabularnewline
33 & 0.13158 & 1.1165 & 0.133961 \tabularnewline
34 & 0.213108 & 1.8083 & 0.03737 \tabularnewline
35 & 0.290368 & 2.4639 & 0.008067 \tabularnewline
36 & 0.362021 & 3.0719 & 0.001501 \tabularnewline
37 & 0.308036 & 2.6138 & 0.005449 \tabularnewline
38 & 0.247062 & 2.0964 & 0.019781 \tabularnewline
39 & 0.188601 & 1.6003 & 0.056952 \tabularnewline
40 & 0.135328 & 1.1483 & 0.127324 \tabularnewline
41 & 0.090175 & 0.7652 & 0.22334 \tabularnewline
42 & 0.049502 & 0.42 & 0.337854 \tabularnewline
43 & 0.026411 & 0.2241 & 0.411655 \tabularnewline
44 & 0.007901 & 0.067 & 0.473368 \tabularnewline
45 & -0.007318 & -0.0621 & 0.47533 \tabularnewline
46 & -0.014658 & -0.1244 & 0.450682 \tabularnewline
47 & -0.022093 & -0.1875 & 0.425911 \tabularnewline
48 & -0.029812 & -0.253 & 0.40051 \tabularnewline
\hline
\end{tabular}
%Source: https://freestatistics.org/blog/index.php?pk=&T=1

[TABLE]
[ROW][C]Autocorrelation Function[/C][/ROW]
[ROW][C]Time lag k[/C][C]ACF(k)[/C][C]T-STAT[/C][C]P-value[/C][/ROW]
[ROW][C]1[/C][C]0.888451[/C][C]7.5388[/C][C]0[/C][/ROW]
[ROW][C]2[/C][C]0.766199[/C][C]6.5014[/C][C]0[/C][/ROW]
[ROW][C]3[/C][C]0.64421[/C][C]5.4663[/C][C]0[/C][/ROW]
[ROW][C]4[/C][C]0.527538[/C][C]4.4763[/C][C]1.4e-05[/C][/ROW]
[ROW][C]5[/C][C]0.423507[/C][C]3.5936[/C][C]0.000297[/C][/ROW]
[ROW][C]6[/C][C]0.312855[/C][C]2.6547[/C][C]0.004883[/C][/ROW]
[ROW][C]7[/C][C]0.239326[/C][C]2.0308[/C][C]0.022987[/C][/ROW]
[ROW][C]8[/C][C]0.181765[/C][C]1.5423[/C][C]0.063689[/C][/ROW]
[ROW][C]9[/C][C]0.133892[/C][C]1.1361[/C][C]0.129839[/C][/ROW]
[ROW][C]10[/C][C]0.124338[/C][C]1.055[/C][C]0.147467[/C][/ROW]
[ROW][C]11[/C][C]0.117026[/C][C]0.993[/C][C]0.162019[/C][/ROW]
[ROW][C]12[/C][C]0.096955[/C][C]0.8227[/C][C]0.2067[/C][/ROW]
[ROW][C]13[/C][C]0.024961[/C][C]0.2118[/C][C]0.416429[/C][/ROW]
[ROW][C]14[/C][C]-0.049804[/C][C]-0.4226[/C][C]0.336922[/C][/ROW]
[ROW][C]15[/C][C]-0.13101[/C][C]-1.1117[/C][C]0.134992[/C][/ROW]
[ROW][C]16[/C][C]-0.191764[/C][C]-1.6272[/C][C]0.054035[/C][/ROW]
[ROW][C]17[/C][C]-0.22921[/C][C]-1.9449[/C][C]0.027846[/C][/ROW]
[ROW][C]18[/C][C]-0.270277[/C][C]-2.2934[/C][C]0.012374[/C][/ROW]
[ROW][C]19[/C][C]-0.279814[/C][C]-2.3743[/C][C]0.010125[/C][/ROW]
[ROW][C]20[/C][C]-0.288352[/C][C]-2.4467[/C][C]0.008429[/C][/ROW]
[ROW][C]21[/C][C]-0.285049[/C][C]-2.4187[/C][C]0.009052[/C][/ROW]
[ROW][C]22[/C][C]-0.254223[/C][C]-2.1572[/C][C]0.017166[/C][/ROW]
[ROW][C]23[/C][C]-0.22185[/C][C]-1.8825[/C][C]0.031907[/C][/ROW]
[ROW][C]24[/C][C]-0.190534[/C][C]-1.6167[/C][C]0.055154[/C][/ROW]
[ROW][C]25[/C][C]-0.192552[/C][C]-1.6339[/C][C]0.053327[/C][/ROW]
[ROW][C]26[/C][C]-0.202146[/C][C]-1.7153[/C][C]0.045298[/C][/ROW]
[ROW][C]27[/C][C]-0.209465[/C][C]-1.7774[/C][C]0.039866[/C][/ROW]
[ROW][C]28[/C][C]-0.179314[/C][C]-1.5215[/C][C]0.066253[/C][/ROW]
[ROW][C]29[/C][C]-0.136776[/C][C]-1.1606[/C][C]0.124823[/C][/ROW]
[ROW][C]30[/C][C]-0.08083[/C][C]-0.6859[/C][C]0.2475[/C][/ROW]
[ROW][C]31[/C][C]-0.001035[/C][C]-0.0088[/C][C]0.496508[/C][/ROW]
[ROW][C]32[/C][C]0.062696[/C][C]0.532[/C][C]0.298185[/C][/ROW]
[ROW][C]33[/C][C]0.13158[/C][C]1.1165[/C][C]0.133961[/C][/ROW]
[ROW][C]34[/C][C]0.213108[/C][C]1.8083[/C][C]0.03737[/C][/ROW]
[ROW][C]35[/C][C]0.290368[/C][C]2.4639[/C][C]0.008067[/C][/ROW]
[ROW][C]36[/C][C]0.362021[/C][C]3.0719[/C][C]0.001501[/C][/ROW]
[ROW][C]37[/C][C]0.308036[/C][C]2.6138[/C][C]0.005449[/C][/ROW]
[ROW][C]38[/C][C]0.247062[/C][C]2.0964[/C][C]0.019781[/C][/ROW]
[ROW][C]39[/C][C]0.188601[/C][C]1.6003[/C][C]0.056952[/C][/ROW]
[ROW][C]40[/C][C]0.135328[/C][C]1.1483[/C][C]0.127324[/C][/ROW]
[ROW][C]41[/C][C]0.090175[/C][C]0.7652[/C][C]0.22334[/C][/ROW]
[ROW][C]42[/C][C]0.049502[/C][C]0.42[/C][C]0.337854[/C][/ROW]
[ROW][C]43[/C][C]0.026411[/C][C]0.2241[/C][C]0.411655[/C][/ROW]
[ROW][C]44[/C][C]0.007901[/C][C]0.067[/C][C]0.473368[/C][/ROW]
[ROW][C]45[/C][C]-0.007318[/C][C]-0.0621[/C][C]0.47533[/C][/ROW]
[ROW][C]46[/C][C]-0.014658[/C][C]-0.1244[/C][C]0.450682[/C][/ROW]
[ROW][C]47[/C][C]-0.022093[/C][C]-0.1875[/C][C]0.425911[/C][/ROW]
[ROW][C]48[/C][C]-0.029812[/C][C]-0.253[/C][C]0.40051[/C][/ROW]
[/TABLE]
Source: https://freestatistics.org/blog/index.php?pk=&T=1

Globally Unique Identifier (entire table): ba.freestatistics.org/blog/index.php?pk=&T=1

As an alternative you can also use a QR Code:  

The GUIDs for individual cells are displayed in the table below:

Autocorrelation Function
Time lag kACF(k)T-STATP-value
10.8884517.53880
20.7661996.50140
30.644215.46630
40.5275384.47631.4e-05
50.4235073.59360.000297
60.3128552.65470.004883
70.2393262.03080.022987
80.1817651.54230.063689
90.1338921.13610.129839
100.1243381.0550.147467
110.1170260.9930.162019
120.0969550.82270.2067
130.0249610.21180.416429
14-0.049804-0.42260.336922
15-0.13101-1.11170.134992
16-0.191764-1.62720.054035
17-0.22921-1.94490.027846
18-0.270277-2.29340.012374
19-0.279814-2.37430.010125
20-0.288352-2.44670.008429
21-0.285049-2.41870.009052
22-0.254223-2.15720.017166
23-0.22185-1.88250.031907
24-0.190534-1.61670.055154
25-0.192552-1.63390.053327
26-0.202146-1.71530.045298
27-0.209465-1.77740.039866
28-0.179314-1.52150.066253
29-0.136776-1.16060.124823
30-0.08083-0.68590.2475
31-0.001035-0.00880.496508
320.0626960.5320.298185
330.131581.11650.133961
340.2131081.80830.03737
350.2903682.46390.008067
360.3620213.07190.001501
370.3080362.61380.005449
380.2470622.09640.019781
390.1886011.60030.056952
400.1353281.14830.127324
410.0901750.76520.22334
420.0495020.420.337854
430.0264110.22410.411655
440.0079010.0670.473368
45-0.007318-0.06210.47533
46-0.014658-0.12440.450682
47-0.022093-0.18750.425911
48-0.029812-0.2530.40051


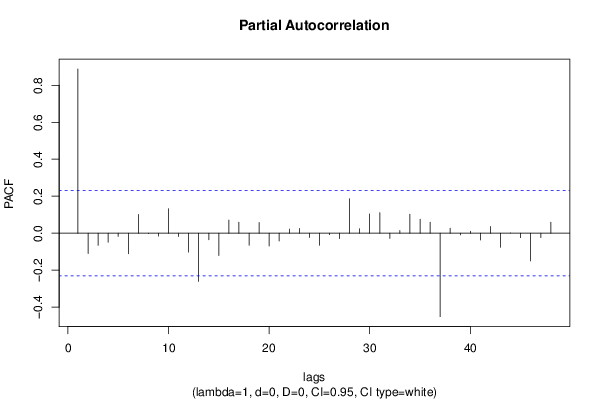
Partial Autocorrelation Function
Time lag kPACF(k)T-STATP-value
10.8884517.53880
2-0.109882-0.93240.177129
3-0.065812-0.55840.289141
4-0.048763-0.41380.340137
5-0.017451-0.14810.441349
6-0.110897-0.9410.174928
70.100720.85460.197793
8-0.001713-0.01450.494223
9-0.015804-0.13410.44685
100.1325111.12440.13229
11-0.01832-0.15540.438452
12-0.102319-0.86820.194084
13-0.260587-2.21120.015101
14-0.035294-0.29950.382718
15-0.120795-1.0250.154401
160.0708970.60160.274672
170.0589270.50.309296
18-0.065033-0.55180.29139
190.0577780.49030.31272
20-0.069329-0.58830.279095
21-0.042354-0.35940.360179
220.0219770.18650.426296
230.0254640.21610.414773
24-0.023716-0.20120.420542
25-0.065493-0.55570.290059
26-0.007727-0.06560.473951
27-0.029332-0.24890.402078
280.1863081.58090.059145
290.0244040.20710.418269
300.1035430.87860.191273
310.1110680.94240.174558
32-0.028226-0.23950.405699
330.014220.12070.452149
340.1021110.86640.194563
350.0756870.64220.261382
360.0592860.50310.30823
37-0.451552-3.83150.000135
380.0264810.22470.411427
39-0.009315-0.0790.468608
400.0100740.08550.466058
41-0.037319-0.31670.37621
420.0363190.30820.379418
43-0.076441-0.64860.259324
44-0.00058-0.00490.498042
45-0.024084-0.20440.419326
46-0.149793-1.2710.103903
47-0.023926-0.2030.419845
480.058750.49850.309822

\begin{tabular}{lllllllll}
\hline
Partial Autocorrelation Function \tabularnewline
Time lag k & PACF(k) & T-STAT & P-value \tabularnewline
1 & 0.888451 & 7.5388 & 0 \tabularnewline
2 & -0.109882 & -0.9324 & 0.177129 \tabularnewline
3 & -0.065812 & -0.5584 & 0.289141 \tabularnewline
4 & -0.048763 & -0.4138 & 0.340137 \tabularnewline
5 & -0.017451 & -0.1481 & 0.441349 \tabularnewline
6 & -0.110897 & -0.941 & 0.174928 \tabularnewline
7 & 0.10072 & 0.8546 & 0.197793 \tabularnewline
8 & -0.001713 & -0.0145 & 0.494223 \tabularnewline
9 & -0.015804 & -0.1341 & 0.44685 \tabularnewline
10 & 0.132511 & 1.1244 & 0.13229 \tabularnewline
11 & -0.01832 & -0.1554 & 0.438452 \tabularnewline
12 & -0.102319 & -0.8682 & 0.194084 \tabularnewline
13 & -0.260587 & -2.2112 & 0.015101 \tabularnewline
14 & -0.035294 & -0.2995 & 0.382718 \tabularnewline
15 & -0.120795 & -1.025 & 0.154401 \tabularnewline
16 & 0.070897 & 0.6016 & 0.274672 \tabularnewline
17 & 0.058927 & 0.5 & 0.309296 \tabularnewline
18 & -0.065033 & -0.5518 & 0.29139 \tabularnewline
19 & 0.057778 & 0.4903 & 0.31272 \tabularnewline
20 & -0.069329 & -0.5883 & 0.279095 \tabularnewline
21 & -0.042354 & -0.3594 & 0.360179 \tabularnewline
22 & 0.021977 & 0.1865 & 0.426296 \tabularnewline
23 & 0.025464 & 0.2161 & 0.414773 \tabularnewline
24 & -0.023716 & -0.2012 & 0.420542 \tabularnewline
25 & -0.065493 & -0.5557 & 0.290059 \tabularnewline
26 & -0.007727 & -0.0656 & 0.473951 \tabularnewline
27 & -0.029332 & -0.2489 & 0.402078 \tabularnewline
28 & 0.186308 & 1.5809 & 0.059145 \tabularnewline
29 & 0.024404 & 0.2071 & 0.418269 \tabularnewline
30 & 0.103543 & 0.8786 & 0.191273 \tabularnewline
31 & 0.111068 & 0.9424 & 0.174558 \tabularnewline
32 & -0.028226 & -0.2395 & 0.405699 \tabularnewline
33 & 0.01422 & 0.1207 & 0.452149 \tabularnewline
34 & 0.102111 & 0.8664 & 0.194563 \tabularnewline
35 & 0.075687 & 0.6422 & 0.261382 \tabularnewline
36 & 0.059286 & 0.5031 & 0.30823 \tabularnewline
37 & -0.451552 & -3.8315 & 0.000135 \tabularnewline
38 & 0.026481 & 0.2247 & 0.411427 \tabularnewline
39 & -0.009315 & -0.079 & 0.468608 \tabularnewline
40 & 0.010074 & 0.0855 & 0.466058 \tabularnewline
41 & -0.037319 & -0.3167 & 0.37621 \tabularnewline
42 & 0.036319 & 0.3082 & 0.379418 \tabularnewline
43 & -0.076441 & -0.6486 & 0.259324 \tabularnewline
44 & -0.00058 & -0.0049 & 0.498042 \tabularnewline
45 & -0.024084 & -0.2044 & 0.419326 \tabularnewline
46 & -0.149793 & -1.271 & 0.103903 \tabularnewline
47 & -0.023926 & -0.203 & 0.419845 \tabularnewline
48 & 0.05875 & 0.4985 & 0.309822 \tabularnewline
\hline
\end{tabular}
%Source: https://freestatistics.org/blog/index.php?pk=&T=2

[TABLE]
[ROW][C]Partial Autocorrelation Function[/C][/ROW]
[ROW][C]Time lag k[/C][C]PACF(k)[/C][C]T-STAT[/C][C]P-value[/C][/ROW]
[ROW][C]1[/C][C]0.888451[/C][C]7.5388[/C][C]0[/C][/ROW]
[ROW][C]2[/C][C]-0.109882[/C][C]-0.9324[/C][C]0.177129[/C][/ROW]
[ROW][C]3[/C][C]-0.065812[/C][C]-0.5584[/C][C]0.289141[/C][/ROW]
[ROW][C]4[/C][C]-0.048763[/C][C]-0.4138[/C][C]0.340137[/C][/ROW]
[ROW][C]5[/C][C]-0.017451[/C][C]-0.1481[/C][C]0.441349[/C][/ROW]
[ROW][C]6[/C][C]-0.110897[/C][C]-0.941[/C][C]0.174928[/C][/ROW]
[ROW][C]7[/C][C]0.10072[/C][C]0.8546[/C][C]0.197793[/C][/ROW]
[ROW][C]8[/C][C]-0.001713[/C][C]-0.0145[/C][C]0.494223[/C][/ROW]
[ROW][C]9[/C][C]-0.015804[/C][C]-0.1341[/C][C]0.44685[/C][/ROW]
[ROW][C]10[/C][C]0.132511[/C][C]1.1244[/C][C]0.13229[/C][/ROW]
[ROW][C]11[/C][C]-0.01832[/C][C]-0.1554[/C][C]0.438452[/C][/ROW]
[ROW][C]12[/C][C]-0.102319[/C][C]-0.8682[/C][C]0.194084[/C][/ROW]
[ROW][C]13[/C][C]-0.260587[/C][C]-2.2112[/C][C]0.015101[/C][/ROW]
[ROW][C]14[/C][C]-0.035294[/C][C]-0.2995[/C][C]0.382718[/C][/ROW]
[ROW][C]15[/C][C]-0.120795[/C][C]-1.025[/C][C]0.154401[/C][/ROW]
[ROW][C]16[/C][C]0.070897[/C][C]0.6016[/C][C]0.274672[/C][/ROW]
[ROW][C]17[/C][C]0.058927[/C][C]0.5[/C][C]0.309296[/C][/ROW]
[ROW][C]18[/C][C]-0.065033[/C][C]-0.5518[/C][C]0.29139[/C][/ROW]
[ROW][C]19[/C][C]0.057778[/C][C]0.4903[/C][C]0.31272[/C][/ROW]
[ROW][C]20[/C][C]-0.069329[/C][C]-0.5883[/C][C]0.279095[/C][/ROW]
[ROW][C]21[/C][C]-0.042354[/C][C]-0.3594[/C][C]0.360179[/C][/ROW]
[ROW][C]22[/C][C]0.021977[/C][C]0.1865[/C][C]0.426296[/C][/ROW]
[ROW][C]23[/C][C]0.025464[/C][C]0.2161[/C][C]0.414773[/C][/ROW]
[ROW][C]24[/C][C]-0.023716[/C][C]-0.2012[/C][C]0.420542[/C][/ROW]
[ROW][C]25[/C][C]-0.065493[/C][C]-0.5557[/C][C]0.290059[/C][/ROW]
[ROW][C]26[/C][C]-0.007727[/C][C]-0.0656[/C][C]0.473951[/C][/ROW]
[ROW][C]27[/C][C]-0.029332[/C][C]-0.2489[/C][C]0.402078[/C][/ROW]
[ROW][C]28[/C][C]0.186308[/C][C]1.5809[/C][C]0.059145[/C][/ROW]
[ROW][C]29[/C][C]0.024404[/C][C]0.2071[/C][C]0.418269[/C][/ROW]
[ROW][C]30[/C][C]0.103543[/C][C]0.8786[/C][C]0.191273[/C][/ROW]
[ROW][C]31[/C][C]0.111068[/C][C]0.9424[/C][C]0.174558[/C][/ROW]
[ROW][C]32[/C][C]-0.028226[/C][C]-0.2395[/C][C]0.405699[/C][/ROW]
[ROW][C]33[/C][C]0.01422[/C][C]0.1207[/C][C]0.452149[/C][/ROW]
[ROW][C]34[/C][C]0.102111[/C][C]0.8664[/C][C]0.194563[/C][/ROW]
[ROW][C]35[/C][C]0.075687[/C][C]0.6422[/C][C]0.261382[/C][/ROW]
[ROW][C]36[/C][C]0.059286[/C][C]0.5031[/C][C]0.30823[/C][/ROW]
[ROW][C]37[/C][C]-0.451552[/C][C]-3.8315[/C][C]0.000135[/C][/ROW]
[ROW][C]38[/C][C]0.026481[/C][C]0.2247[/C][C]0.411427[/C][/ROW]
[ROW][C]39[/C][C]-0.009315[/C][C]-0.079[/C][C]0.468608[/C][/ROW]
[ROW][C]40[/C][C]0.010074[/C][C]0.0855[/C][C]0.466058[/C][/ROW]
[ROW][C]41[/C][C]-0.037319[/C][C]-0.3167[/C][C]0.37621[/C][/ROW]
[ROW][C]42[/C][C]0.036319[/C][C]0.3082[/C][C]0.379418[/C][/ROW]
[ROW][C]43[/C][C]-0.076441[/C][C]-0.6486[/C][C]0.259324[/C][/ROW]
[ROW][C]44[/C][C]-0.00058[/C][C]-0.0049[/C][C]0.498042[/C][/ROW]
[ROW][C]45[/C][C]-0.024084[/C][C]-0.2044[/C][C]0.419326[/C][/ROW]
[ROW][C]46[/C][C]-0.149793[/C][C]-1.271[/C][C]0.103903[/C][/ROW]
[ROW][C]47[/C][C]-0.023926[/C][C]-0.203[/C][C]0.419845[/C][/ROW]
[ROW][C]48[/C][C]0.05875[/C][C]0.4985[/C][C]0.309822[/C][/ROW]
[/TABLE]
Source: https://freestatistics.org/blog/index.php?pk=&T=2

Globally Unique Identifier (entire table): ba.freestatistics.org/blog/index.php?pk=&T=2

As an alternative you can also use a QR Code:  

The GUIDs for individual cells are displayed in the table below:

Partial Autocorrelation Function
Time lag kPACF(k)T-STATP-value
10.8884517.53880
2-0.109882-0.93240.177129
3-0.065812-0.55840.289141
4-0.048763-0.41380.340137
5-0.017451-0.14810.441349
6-0.110897-0.9410.174928
70.100720.85460.197793
8-0.001713-0.01450.494223
9-0.015804-0.13410.44685
100.1325111.12440.13229
11-0.01832-0.15540.438452
12-0.102319-0.86820.194084
13-0.260587-2.21120.015101
14-0.035294-0.29950.382718
15-0.120795-1.0250.154401
160.0708970.60160.274672
170.0589270.50.309296
18-0.065033-0.55180.29139
190.0577780.49030.31272
20-0.069329-0.58830.279095
21-0.042354-0.35940.360179
220.0219770.18650.426296
230.0254640.21610.414773
24-0.023716-0.20120.420542
25-0.065493-0.55570.290059
26-0.007727-0.06560.473951
27-0.029332-0.24890.402078
280.1863081.58090.059145
290.0244040.20710.418269
300.1035430.87860.191273
310.1110680.94240.174558
32-0.028226-0.23950.405699
330.014220.12070.452149
340.1021110.86640.194563
350.0756870.64220.261382
360.0592860.50310.30823
37-0.451552-3.83150.000135
380.0264810.22470.411427
39-0.009315-0.0790.468608
400.0100740.08550.466058
41-0.037319-0.31670.37621
420.0363190.30820.379418
43-0.076441-0.64860.259324
44-0.00058-0.00490.498042
45-0.024084-0.20440.419326
46-0.149793-1.2710.103903
47-0.023926-0.2030.419845
480.058750.49850.309822


Parameters (Session):
par1 = 48 ; par2 = 1 ; par3 = 0 ; par4 = 0 ; par5 = 12 ; par6 = White Noise ; par7 = 0.95 ;
Parameters (R input):
par1 = 48 ; par2 = 1 ; par3 = 0 ; par4 = 0 ; par5 = 12 ; par6 = White Noise ; par7 = 0.95 ; par8 = ;
R code (references can be found in the software module):
par8 <- ''
par7 <- '0.95'
par6 <- 'White Noise'
par5 <- '12'
par4 <- '0'
par3 <- '1'
par2 <- '1'
par1 <- '48'
if (par1 == 'Default') {
par1 = 10*log10(length(x))
} else {
par1 <- as.numeric(par1)
}
par2 <- as.numeric(par2)
par3 <- as.numeric(par3)
par4 <- as.numeric(par4)
par5 <- as.numeric(par5)
if (par6 == 'White Noise') par6 <- 'white' else par6 <- 'ma'
par7 <- as.numeric(par7)
if (par8 != '') par8 <- as.numeric(par8)
x <- na.omit(x)
ox <- x
if (par8 == '') {
if (par2 == 0) {
x <- log(x)
} else {
x <- (x ^ par2 - 1) / par2
}
} else {
x <- log(x,base=par8)
}
if (par3 > 0) x <- diff(x,lag=1,difference=par3)
if (par4 > 0) x <- diff(x,lag=par5,difference=par4)
bitmap(file='picts.png')
op <- par(mfrow=c(2,1))
plot(ox,type='l',main='Original Time Series',xlab='time',ylab='value')
if (par8=='') {
mytitle <- paste('Working Time Series (lambda=',par2,', d=',par3,', D=',par4,')',sep='')
mysub <- paste('(lambda=',par2,', d=',par3,', D=',par4,', CI=', par7, ', CI type=',par6,')',sep='')
} else {
mytitle <- paste('Working Time Series (base=',par8,', d=',par3,', D=',par4,')',sep='')
mysub <- paste('(base=',par8,', d=',par3,', D=',par4,', CI=', par7, ', CI type=',par6,')',sep='')
}
plot(x,type='l', main=mytitle,xlab='time',ylab='value')
par(op)
dev.off()
bitmap(file='pic1.png')
racf <- acf(x, par1, main='Autocorrelation', xlab='time lag', ylab='ACF', ci.type=par6, ci=par7, sub=mysub)
dev.off()
bitmap(file='pic2.png')
rpacf <- pacf(x,par1,main='Partial Autocorrelation',xlab='lags',ylab='PACF',sub=mysub)
dev.off()
(myacf <- c(racf$acf))
(mypacf <- c(rpacf$acf))
lengthx <- length(x)
sqrtn <- sqrt(lengthx)
load(file='createtable')
a<-table.start()
a<-table.row.start(a)
a<-table.element(a,'Autocorrelation Function',4,TRUE)
a<-table.row.end(a)
a<-table.row.start(a)
a<-table.element(a,'Time lag k',header=TRUE)
a<-table.element(a,hyperlink('basics.htm','ACF(k)','click here for more information about the Autocorrelation Function'),header=TRUE)
a<-table.element(a,'T-STAT',header=TRUE)
a<-table.element(a,'P-value',header=TRUE)
a<-table.row.end(a)
for (i in 2:(par1+1)) {
a<-table.row.start(a)
a<-table.element(a,i-1,header=TRUE)
a<-table.element(a,round(myacf[i],6))
mytstat <- myacf[i]*sqrtn
a<-table.element(a,round(mytstat,4))
a<-table.element(a,round(1-pt(abs(mytstat),lengthx),6))
a<-table.row.end(a)
}
a<-table.end(a)
table.save(a,file='mytable.tab')
a<-table.start()
a<-table.row.start(a)
a<-table.element(a,'Partial Autocorrelation Function',4,TRUE)
a<-table.row.end(a)
a<-table.row.start(a)
a<-table.element(a,'Time lag k',header=TRUE)
a<-table.element(a,hyperlink('basics.htm','PACF(k)','click here for more information about the Partial Autocorrelation Function'),header=TRUE)
a<-table.element(a,'T-STAT',header=TRUE)
a<-table.element(a,'P-value',header=TRUE)
a<-table.row.end(a)
for (i in 1:par1) {
a<-table.row.start(a)
a<-table.element(a,i,header=TRUE)
a<-table.element(a,round(mypacf[i],6))
mytstat <- mypacf[i]*sqrtn
a<-table.element(a,round(mytstat,4))
a<-table.element(a,round(1-pt(abs(mytstat),lengthx),6))
a<-table.row.end(a)
}
a<-table.end(a)
table.save(a,file='mytable1.tab')