Free Statistics

of Irreproducible Research!

Author's title

Author*Unverified author*
R Software Modulerwasp_autocorrelation.wasp
Title produced by software(Partial) Autocorrelation Function
Date of computationWed, 19 Oct 2016 12:20:40 +0100
Cite this page as followsStatistical Computations at FreeStatistics.org, Office for Research Development and Education, URL https://freestatistics.org/blog/index.php?v=date/2016/Oct/19/t1476876101lnt3l8g7ckkbc0v.htm/, Retrieved Tue, 30 Apr 2024 07:28:45 +0200
Statistical Computations at FreeStatistics.org, Office for Research Development and Education, URL https://freestatistics.org/blog/index.php?pk=, Retrieved Tue, 30 Apr 2024 07:28:45 +0200
QR Codes:

Original text written by user:
IsPrivate?No (this computation is public)
User-defined keywords
Estimated Impact0
Dataseries X:
77,34
78,15
78,31
78,71
78,68
78,85
78,97
79,47
80,6
82,24
83,25
84,55
85,91
86,84
87,44
87,79
88,08
88,38
88,53
88,79
88,85
89,26
89,31
89,39
89,76
89,94
89,99
90,08
89,95
90,2
89,7
89,5
89,25
89,13
89,07
89,06
89,15
89,38
89,4
89,51
89,62
89,65
89,68
89,92
90,26
90,89
91,08
91,13
91,83
92,66
93,45
93,95
94,12
94,31
94,25
94,51
94,58
94,85
95,31
95,75
96,06
96,4
96,57
96,47
96,34
96,22
96,2
96,71
97,05
97,82
98,22
98,5
98,94
99,5
99,89
100
100,1
100,16
100,05
100,03
100
100,32
100,53
100,49
100,38
100,22
100,5
100,57
100,6
100,23
100,29
100,01
100,13
100,22
100,2
100,34
100,73
100,29
101,11
101,09
101,01
101,27
101,57
101,69
101
101,43
101,13
101,23


Summary of computational transaction
Raw Inputview raw input (R code)
Raw Outputview raw output of R engine
Computing time2 seconds
R Server'Gwilym Jenkins' @ jenkins.wessa.net

\begin{tabular}{lllllllll}
\hline
Summary of computational transaction \tabularnewline
Raw Input & view raw input (R code)  \tabularnewline
Raw Output & view raw output of R engine  \tabularnewline
Computing time & 2 seconds \tabularnewline
R Server & 'Gwilym Jenkins' @ jenkins.wessa.net \tabularnewline
\hline
\end{tabular}
%Source: https://freestatistics.org/blog/index.php?pk=&T=0

[TABLE]
[ROW][C]Summary of computational transaction[/C][/ROW]
[ROW][C]Raw Input[/C][C]view raw input (R code) [/C][/ROW]
[ROW][C]Raw Output[/C][C]view raw output of R engine [/C][/ROW]
[ROW][C]Computing time[/C][C]2 seconds[/C][/ROW]
[ROW][C]R Server[/C][C]'Gwilym Jenkins' @ jenkins.wessa.net[/C][/ROW]
[/TABLE]
Source: https://freestatistics.org/blog/index.php?pk=&T=0

Globally Unique Identifier (entire table): ba.freestatistics.org/blog/index.php?pk=&T=0

As an alternative you can also use a QR Code:  

The GUIDs for individual cells are displayed in the table below:

Summary of computational transaction
Raw Inputview raw input (R code)
Raw Outputview raw output of R engine
Computing time2 seconds
R Server'Gwilym Jenkins' @ jenkins.wessa.net


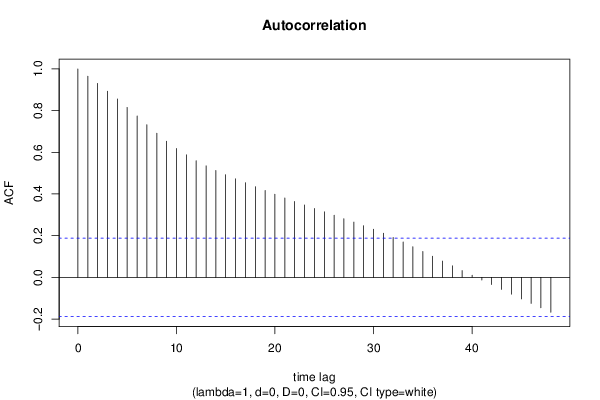
Autocorrelation Function
Time lag kACF(k)T-STATP-value
10.96527810.03150
20.9306419.67150
30.8933749.28420
40.8559818.89560
50.8155098.4750
60.7742478.04620
70.7325457.61280
80.691587.18710
90.6529646.78580
100.6185446.42810
110.5875986.10650
120.55925.81140
130.5348395.55820
140.5129575.33080
150.4924355.11751e-06
160.4727054.91252e-06
170.4537754.71584e-06
180.4351174.52198e-06
190.4169664.33321.7e-05
200.3988714.14523.4e-05
210.3808293.95776.8e-05
220.3640073.78290.000127
230.347573.61210.000231
240.330753.43730.000418
250.3143023.26630.00073
260.2978353.09520.001253
270.2812432.92280.002113
280.2650412.75440.003451
290.2478142.57540.005683
300.2308532.39910.009074
310.2116742.19980.014977
320.1913381.98840.024646
330.169651.76310.04036
340.1469851.52750.064779
350.1239611.28820.100208
360.1010361.050.148032
370.0780560.81120.209524
380.0552830.57450.283408
390.0322030.33470.369265
400.0098990.10290.459128
41-0.012429-0.12920.448735
42-0.034693-0.36050.359572
43-0.057633-0.59890.275232
44-0.080694-0.83860.201775
45-0.103468-1.07530.142324
46-0.124965-1.29870.09841
47-0.146245-1.51980.065739
48-0.167691-1.74270.042116

\begin{tabular}{lllllllll}
\hline
Autocorrelation Function \tabularnewline
Time lag k & ACF(k) & T-STAT & P-value \tabularnewline
1 & 0.965278 & 10.0315 & 0 \tabularnewline
2 & 0.930641 & 9.6715 & 0 \tabularnewline
3 & 0.893374 & 9.2842 & 0 \tabularnewline
4 & 0.855981 & 8.8956 & 0 \tabularnewline
5 & 0.815509 & 8.475 & 0 \tabularnewline
6 & 0.774247 & 8.0462 & 0 \tabularnewline
7 & 0.732545 & 7.6128 & 0 \tabularnewline
8 & 0.69158 & 7.1871 & 0 \tabularnewline
9 & 0.652964 & 6.7858 & 0 \tabularnewline
10 & 0.618544 & 6.4281 & 0 \tabularnewline
11 & 0.587598 & 6.1065 & 0 \tabularnewline
12 & 0.5592 & 5.8114 & 0 \tabularnewline
13 & 0.534839 & 5.5582 & 0 \tabularnewline
14 & 0.512957 & 5.3308 & 0 \tabularnewline
15 & 0.492435 & 5.1175 & 1e-06 \tabularnewline
16 & 0.472705 & 4.9125 & 2e-06 \tabularnewline
17 & 0.453775 & 4.7158 & 4e-06 \tabularnewline
18 & 0.435117 & 4.5219 & 8e-06 \tabularnewline
19 & 0.416966 & 4.3332 & 1.7e-05 \tabularnewline
20 & 0.398871 & 4.1452 & 3.4e-05 \tabularnewline
21 & 0.380829 & 3.9577 & 6.8e-05 \tabularnewline
22 & 0.364007 & 3.7829 & 0.000127 \tabularnewline
23 & 0.34757 & 3.6121 & 0.000231 \tabularnewline
24 & 0.33075 & 3.4373 & 0.000418 \tabularnewline
25 & 0.314302 & 3.2663 & 0.00073 \tabularnewline
26 & 0.297835 & 3.0952 & 0.001253 \tabularnewline
27 & 0.281243 & 2.9228 & 0.002113 \tabularnewline
28 & 0.265041 & 2.7544 & 0.003451 \tabularnewline
29 & 0.247814 & 2.5754 & 0.005683 \tabularnewline
30 & 0.230853 & 2.3991 & 0.009074 \tabularnewline
31 & 0.211674 & 2.1998 & 0.014977 \tabularnewline
32 & 0.191338 & 1.9884 & 0.024646 \tabularnewline
33 & 0.16965 & 1.7631 & 0.04036 \tabularnewline
34 & 0.146985 & 1.5275 & 0.064779 \tabularnewline
35 & 0.123961 & 1.2882 & 0.100208 \tabularnewline
36 & 0.101036 & 1.05 & 0.148032 \tabularnewline
37 & 0.078056 & 0.8112 & 0.209524 \tabularnewline
38 & 0.055283 & 0.5745 & 0.283408 \tabularnewline
39 & 0.032203 & 0.3347 & 0.369265 \tabularnewline
40 & 0.009899 & 0.1029 & 0.459128 \tabularnewline
41 & -0.012429 & -0.1292 & 0.448735 \tabularnewline
42 & -0.034693 & -0.3605 & 0.359572 \tabularnewline
43 & -0.057633 & -0.5989 & 0.275232 \tabularnewline
44 & -0.080694 & -0.8386 & 0.201775 \tabularnewline
45 & -0.103468 & -1.0753 & 0.142324 \tabularnewline
46 & -0.124965 & -1.2987 & 0.09841 \tabularnewline
47 & -0.146245 & -1.5198 & 0.065739 \tabularnewline
48 & -0.167691 & -1.7427 & 0.042116 \tabularnewline
\hline
\end{tabular}
%Source: https://freestatistics.org/blog/index.php?pk=&T=1

[TABLE]
[ROW][C]Autocorrelation Function[/C][/ROW]
[ROW][C]Time lag k[/C][C]ACF(k)[/C][C]T-STAT[/C][C]P-value[/C][/ROW]
[ROW][C]1[/C][C]0.965278[/C][C]10.0315[/C][C]0[/C][/ROW]
[ROW][C]2[/C][C]0.930641[/C][C]9.6715[/C][C]0[/C][/ROW]
[ROW][C]3[/C][C]0.893374[/C][C]9.2842[/C][C]0[/C][/ROW]
[ROW][C]4[/C][C]0.855981[/C][C]8.8956[/C][C]0[/C][/ROW]
[ROW][C]5[/C][C]0.815509[/C][C]8.475[/C][C]0[/C][/ROW]
[ROW][C]6[/C][C]0.774247[/C][C]8.0462[/C][C]0[/C][/ROW]
[ROW][C]7[/C][C]0.732545[/C][C]7.6128[/C][C]0[/C][/ROW]
[ROW][C]8[/C][C]0.69158[/C][C]7.1871[/C][C]0[/C][/ROW]
[ROW][C]9[/C][C]0.652964[/C][C]6.7858[/C][C]0[/C][/ROW]
[ROW][C]10[/C][C]0.618544[/C][C]6.4281[/C][C]0[/C][/ROW]
[ROW][C]11[/C][C]0.587598[/C][C]6.1065[/C][C]0[/C][/ROW]
[ROW][C]12[/C][C]0.5592[/C][C]5.8114[/C][C]0[/C][/ROW]
[ROW][C]13[/C][C]0.534839[/C][C]5.5582[/C][C]0[/C][/ROW]
[ROW][C]14[/C][C]0.512957[/C][C]5.3308[/C][C]0[/C][/ROW]
[ROW][C]15[/C][C]0.492435[/C][C]5.1175[/C][C]1e-06[/C][/ROW]
[ROW][C]16[/C][C]0.472705[/C][C]4.9125[/C][C]2e-06[/C][/ROW]
[ROW][C]17[/C][C]0.453775[/C][C]4.7158[/C][C]4e-06[/C][/ROW]
[ROW][C]18[/C][C]0.435117[/C][C]4.5219[/C][C]8e-06[/C][/ROW]
[ROW][C]19[/C][C]0.416966[/C][C]4.3332[/C][C]1.7e-05[/C][/ROW]
[ROW][C]20[/C][C]0.398871[/C][C]4.1452[/C][C]3.4e-05[/C][/ROW]
[ROW][C]21[/C][C]0.380829[/C][C]3.9577[/C][C]6.8e-05[/C][/ROW]
[ROW][C]22[/C][C]0.364007[/C][C]3.7829[/C][C]0.000127[/C][/ROW]
[ROW][C]23[/C][C]0.34757[/C][C]3.6121[/C][C]0.000231[/C][/ROW]
[ROW][C]24[/C][C]0.33075[/C][C]3.4373[/C][C]0.000418[/C][/ROW]
[ROW][C]25[/C][C]0.314302[/C][C]3.2663[/C][C]0.00073[/C][/ROW]
[ROW][C]26[/C][C]0.297835[/C][C]3.0952[/C][C]0.001253[/C][/ROW]
[ROW][C]27[/C][C]0.281243[/C][C]2.9228[/C][C]0.002113[/C][/ROW]
[ROW][C]28[/C][C]0.265041[/C][C]2.7544[/C][C]0.003451[/C][/ROW]
[ROW][C]29[/C][C]0.247814[/C][C]2.5754[/C][C]0.005683[/C][/ROW]
[ROW][C]30[/C][C]0.230853[/C][C]2.3991[/C][C]0.009074[/C][/ROW]
[ROW][C]31[/C][C]0.211674[/C][C]2.1998[/C][C]0.014977[/C][/ROW]
[ROW][C]32[/C][C]0.191338[/C][C]1.9884[/C][C]0.024646[/C][/ROW]
[ROW][C]33[/C][C]0.16965[/C][C]1.7631[/C][C]0.04036[/C][/ROW]
[ROW][C]34[/C][C]0.146985[/C][C]1.5275[/C][C]0.064779[/C][/ROW]
[ROW][C]35[/C][C]0.123961[/C][C]1.2882[/C][C]0.100208[/C][/ROW]
[ROW][C]36[/C][C]0.101036[/C][C]1.05[/C][C]0.148032[/C][/ROW]
[ROW][C]37[/C][C]0.078056[/C][C]0.8112[/C][C]0.209524[/C][/ROW]
[ROW][C]38[/C][C]0.055283[/C][C]0.5745[/C][C]0.283408[/C][/ROW]
[ROW][C]39[/C][C]0.032203[/C][C]0.3347[/C][C]0.369265[/C][/ROW]
[ROW][C]40[/C][C]0.009899[/C][C]0.1029[/C][C]0.459128[/C][/ROW]
[ROW][C]41[/C][C]-0.012429[/C][C]-0.1292[/C][C]0.448735[/C][/ROW]
[ROW][C]42[/C][C]-0.034693[/C][C]-0.3605[/C][C]0.359572[/C][/ROW]
[ROW][C]43[/C][C]-0.057633[/C][C]-0.5989[/C][C]0.275232[/C][/ROW]
[ROW][C]44[/C][C]-0.080694[/C][C]-0.8386[/C][C]0.201775[/C][/ROW]
[ROW][C]45[/C][C]-0.103468[/C][C]-1.0753[/C][C]0.142324[/C][/ROW]
[ROW][C]46[/C][C]-0.124965[/C][C]-1.2987[/C][C]0.09841[/C][/ROW]
[ROW][C]47[/C][C]-0.146245[/C][C]-1.5198[/C][C]0.065739[/C][/ROW]
[ROW][C]48[/C][C]-0.167691[/C][C]-1.7427[/C][C]0.042116[/C][/ROW]
[/TABLE]
Source: https://freestatistics.org/blog/index.php?pk=&T=1

Globally Unique Identifier (entire table): ba.freestatistics.org/blog/index.php?pk=&T=1

As an alternative you can also use a QR Code:  

The GUIDs for individual cells are displayed in the table below:

Autocorrelation Function
Time lag kACF(k)T-STATP-value
10.96527810.03150
20.9306419.67150
30.8933749.28420
40.8559818.89560
50.8155098.4750
60.7742478.04620
70.7325457.61280
80.691587.18710
90.6529646.78580
100.6185446.42810
110.5875986.10650
120.55925.81140
130.5348395.55820
140.5129575.33080
150.4924355.11751e-06
160.4727054.91252e-06
170.4537754.71584e-06
180.4351174.52198e-06
190.4169664.33321.7e-05
200.3988714.14523.4e-05
210.3808293.95776.8e-05
220.3640073.78290.000127
230.347573.61210.000231
240.330753.43730.000418
250.3143023.26630.00073
260.2978353.09520.001253
270.2812432.92280.002113
280.2650412.75440.003451
290.2478142.57540.005683
300.2308532.39910.009074
310.2116742.19980.014977
320.1913381.98840.024646
330.169651.76310.04036
340.1469851.52750.064779
350.1239611.28820.100208
360.1010361.050.148032
370.0780560.81120.209524
380.0552830.57450.283408
390.0322030.33470.369265
400.0098990.10290.459128
41-0.012429-0.12920.448735
42-0.034693-0.36050.359572
43-0.057633-0.59890.275232
44-0.080694-0.83860.201775
45-0.103468-1.07530.142324
46-0.124965-1.29870.09841
47-0.146245-1.51980.065739
48-0.167691-1.74270.042116


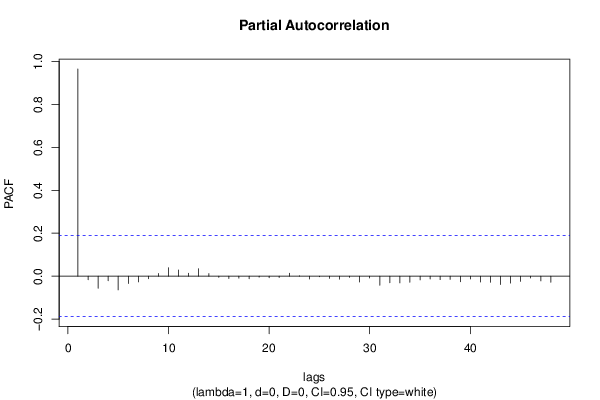
Partial Autocorrelation Function
Time lag kPACF(k)T-STATP-value
10.96527810.03150
2-0.016412-0.17060.432444
3-0.056497-0.58710.27917
4-0.021686-0.22540.41106
5-0.064032-0.66540.253594
6-0.034185-0.35530.361543
7-0.026783-0.27830.390642
8-0.012415-0.1290.44879
90.0128340.13340.447072
100.0393440.40890.341721
110.0289190.30050.382175
120.0135460.14080.444157
130.0347220.36080.359462
140.0117780.12240.451403
15-0.005514-0.05730.477205
16-0.010647-0.11060.456051
17-0.009262-0.09630.461749
18-0.012243-0.12720.449496
19-0.004587-0.04770.481035
20-0.007657-0.07960.468361
21-0.006167-0.06410.474511
220.0138370.14380.442965
230.0013440.0140.494439
24-0.012955-0.13460.446577
25-0.002403-0.0250.490063
26-0.010181-0.10580.457967
27-0.013772-0.14310.443231
28-0.0057-0.05920.476436
29-0.026947-0.280.389991
30-0.008422-0.08750.465207
31-0.042109-0.43760.331273
32-0.0307-0.3190.375156
33-0.031336-0.32570.372658
34-0.028132-0.29240.385289
35-0.017414-0.1810.428365
36-0.013268-0.13790.445293
37-0.016283-0.16920.432973
38-0.015114-0.15710.437741
39-0.025718-0.26730.394884
40-0.013641-0.14180.443767
41-0.027391-0.28470.388225
42-0.028296-0.29410.384636
43-0.039221-0.40760.342189
44-0.032311-0.33580.368843
45-0.024418-0.25380.400082
46-0.008431-0.08760.465172
47-0.022055-0.22920.409572
48-0.028714-0.29840.382986

\begin{tabular}{lllllllll}
\hline
Partial Autocorrelation Function \tabularnewline
Time lag k & PACF(k) & T-STAT & P-value \tabularnewline
1 & 0.965278 & 10.0315 & 0 \tabularnewline
2 & -0.016412 & -0.1706 & 0.432444 \tabularnewline
3 & -0.056497 & -0.5871 & 0.27917 \tabularnewline
4 & -0.021686 & -0.2254 & 0.41106 \tabularnewline
5 & -0.064032 & -0.6654 & 0.253594 \tabularnewline
6 & -0.034185 & -0.3553 & 0.361543 \tabularnewline
7 & -0.026783 & -0.2783 & 0.390642 \tabularnewline
8 & -0.012415 & -0.129 & 0.44879 \tabularnewline
9 & 0.012834 & 0.1334 & 0.447072 \tabularnewline
10 & 0.039344 & 0.4089 & 0.341721 \tabularnewline
11 & 0.028919 & 0.3005 & 0.382175 \tabularnewline
12 & 0.013546 & 0.1408 & 0.444157 \tabularnewline
13 & 0.034722 & 0.3608 & 0.359462 \tabularnewline
14 & 0.011778 & 0.1224 & 0.451403 \tabularnewline
15 & -0.005514 & -0.0573 & 0.477205 \tabularnewline
16 & -0.010647 & -0.1106 & 0.456051 \tabularnewline
17 & -0.009262 & -0.0963 & 0.461749 \tabularnewline
18 & -0.012243 & -0.1272 & 0.449496 \tabularnewline
19 & -0.004587 & -0.0477 & 0.481035 \tabularnewline
20 & -0.007657 & -0.0796 & 0.468361 \tabularnewline
21 & -0.006167 & -0.0641 & 0.474511 \tabularnewline
22 & 0.013837 & 0.1438 & 0.442965 \tabularnewline
23 & 0.001344 & 0.014 & 0.494439 \tabularnewline
24 & -0.012955 & -0.1346 & 0.446577 \tabularnewline
25 & -0.002403 & -0.025 & 0.490063 \tabularnewline
26 & -0.010181 & -0.1058 & 0.457967 \tabularnewline
27 & -0.013772 & -0.1431 & 0.443231 \tabularnewline
28 & -0.0057 & -0.0592 & 0.476436 \tabularnewline
29 & -0.026947 & -0.28 & 0.389991 \tabularnewline
30 & -0.008422 & -0.0875 & 0.465207 \tabularnewline
31 & -0.042109 & -0.4376 & 0.331273 \tabularnewline
32 & -0.0307 & -0.319 & 0.375156 \tabularnewline
33 & -0.031336 & -0.3257 & 0.372658 \tabularnewline
34 & -0.028132 & -0.2924 & 0.385289 \tabularnewline
35 & -0.017414 & -0.181 & 0.428365 \tabularnewline
36 & -0.013268 & -0.1379 & 0.445293 \tabularnewline
37 & -0.016283 & -0.1692 & 0.432973 \tabularnewline
38 & -0.015114 & -0.1571 & 0.437741 \tabularnewline
39 & -0.025718 & -0.2673 & 0.394884 \tabularnewline
40 & -0.013641 & -0.1418 & 0.443767 \tabularnewline
41 & -0.027391 & -0.2847 & 0.388225 \tabularnewline
42 & -0.028296 & -0.2941 & 0.384636 \tabularnewline
43 & -0.039221 & -0.4076 & 0.342189 \tabularnewline
44 & -0.032311 & -0.3358 & 0.368843 \tabularnewline
45 & -0.024418 & -0.2538 & 0.400082 \tabularnewline
46 & -0.008431 & -0.0876 & 0.465172 \tabularnewline
47 & -0.022055 & -0.2292 & 0.409572 \tabularnewline
48 & -0.028714 & -0.2984 & 0.382986 \tabularnewline
\hline
\end{tabular}
%Source: https://freestatistics.org/blog/index.php?pk=&T=2

[TABLE]
[ROW][C]Partial Autocorrelation Function[/C][/ROW]
[ROW][C]Time lag k[/C][C]PACF(k)[/C][C]T-STAT[/C][C]P-value[/C][/ROW]
[ROW][C]1[/C][C]0.965278[/C][C]10.0315[/C][C]0[/C][/ROW]
[ROW][C]2[/C][C]-0.016412[/C][C]-0.1706[/C][C]0.432444[/C][/ROW]
[ROW][C]3[/C][C]-0.056497[/C][C]-0.5871[/C][C]0.27917[/C][/ROW]
[ROW][C]4[/C][C]-0.021686[/C][C]-0.2254[/C][C]0.41106[/C][/ROW]
[ROW][C]5[/C][C]-0.064032[/C][C]-0.6654[/C][C]0.253594[/C][/ROW]
[ROW][C]6[/C][C]-0.034185[/C][C]-0.3553[/C][C]0.361543[/C][/ROW]
[ROW][C]7[/C][C]-0.026783[/C][C]-0.2783[/C][C]0.390642[/C][/ROW]
[ROW][C]8[/C][C]-0.012415[/C][C]-0.129[/C][C]0.44879[/C][/ROW]
[ROW][C]9[/C][C]0.012834[/C][C]0.1334[/C][C]0.447072[/C][/ROW]
[ROW][C]10[/C][C]0.039344[/C][C]0.4089[/C][C]0.341721[/C][/ROW]
[ROW][C]11[/C][C]0.028919[/C][C]0.3005[/C][C]0.382175[/C][/ROW]
[ROW][C]12[/C][C]0.013546[/C][C]0.1408[/C][C]0.444157[/C][/ROW]
[ROW][C]13[/C][C]0.034722[/C][C]0.3608[/C][C]0.359462[/C][/ROW]
[ROW][C]14[/C][C]0.011778[/C][C]0.1224[/C][C]0.451403[/C][/ROW]
[ROW][C]15[/C][C]-0.005514[/C][C]-0.0573[/C][C]0.477205[/C][/ROW]
[ROW][C]16[/C][C]-0.010647[/C][C]-0.1106[/C][C]0.456051[/C][/ROW]
[ROW][C]17[/C][C]-0.009262[/C][C]-0.0963[/C][C]0.461749[/C][/ROW]
[ROW][C]18[/C][C]-0.012243[/C][C]-0.1272[/C][C]0.449496[/C][/ROW]
[ROW][C]19[/C][C]-0.004587[/C][C]-0.0477[/C][C]0.481035[/C][/ROW]
[ROW][C]20[/C][C]-0.007657[/C][C]-0.0796[/C][C]0.468361[/C][/ROW]
[ROW][C]21[/C][C]-0.006167[/C][C]-0.0641[/C][C]0.474511[/C][/ROW]
[ROW][C]22[/C][C]0.013837[/C][C]0.1438[/C][C]0.442965[/C][/ROW]
[ROW][C]23[/C][C]0.001344[/C][C]0.014[/C][C]0.494439[/C][/ROW]
[ROW][C]24[/C][C]-0.012955[/C][C]-0.1346[/C][C]0.446577[/C][/ROW]
[ROW][C]25[/C][C]-0.002403[/C][C]-0.025[/C][C]0.490063[/C][/ROW]
[ROW][C]26[/C][C]-0.010181[/C][C]-0.1058[/C][C]0.457967[/C][/ROW]
[ROW][C]27[/C][C]-0.013772[/C][C]-0.1431[/C][C]0.443231[/C][/ROW]
[ROW][C]28[/C][C]-0.0057[/C][C]-0.0592[/C][C]0.476436[/C][/ROW]
[ROW][C]29[/C][C]-0.026947[/C][C]-0.28[/C][C]0.389991[/C][/ROW]
[ROW][C]30[/C][C]-0.008422[/C][C]-0.0875[/C][C]0.465207[/C][/ROW]
[ROW][C]31[/C][C]-0.042109[/C][C]-0.4376[/C][C]0.331273[/C][/ROW]
[ROW][C]32[/C][C]-0.0307[/C][C]-0.319[/C][C]0.375156[/C][/ROW]
[ROW][C]33[/C][C]-0.031336[/C][C]-0.3257[/C][C]0.372658[/C][/ROW]
[ROW][C]34[/C][C]-0.028132[/C][C]-0.2924[/C][C]0.385289[/C][/ROW]
[ROW][C]35[/C][C]-0.017414[/C][C]-0.181[/C][C]0.428365[/C][/ROW]
[ROW][C]36[/C][C]-0.013268[/C][C]-0.1379[/C][C]0.445293[/C][/ROW]
[ROW][C]37[/C][C]-0.016283[/C][C]-0.1692[/C][C]0.432973[/C][/ROW]
[ROW][C]38[/C][C]-0.015114[/C][C]-0.1571[/C][C]0.437741[/C][/ROW]
[ROW][C]39[/C][C]-0.025718[/C][C]-0.2673[/C][C]0.394884[/C][/ROW]
[ROW][C]40[/C][C]-0.013641[/C][C]-0.1418[/C][C]0.443767[/C][/ROW]
[ROW][C]41[/C][C]-0.027391[/C][C]-0.2847[/C][C]0.388225[/C][/ROW]
[ROW][C]42[/C][C]-0.028296[/C][C]-0.2941[/C][C]0.384636[/C][/ROW]
[ROW][C]43[/C][C]-0.039221[/C][C]-0.4076[/C][C]0.342189[/C][/ROW]
[ROW][C]44[/C][C]-0.032311[/C][C]-0.3358[/C][C]0.368843[/C][/ROW]
[ROW][C]45[/C][C]-0.024418[/C][C]-0.2538[/C][C]0.400082[/C][/ROW]
[ROW][C]46[/C][C]-0.008431[/C][C]-0.0876[/C][C]0.465172[/C][/ROW]
[ROW][C]47[/C][C]-0.022055[/C][C]-0.2292[/C][C]0.409572[/C][/ROW]
[ROW][C]48[/C][C]-0.028714[/C][C]-0.2984[/C][C]0.382986[/C][/ROW]
[/TABLE]
Source: https://freestatistics.org/blog/index.php?pk=&T=2

Globally Unique Identifier (entire table): ba.freestatistics.org/blog/index.php?pk=&T=2

As an alternative you can also use a QR Code:  

The GUIDs for individual cells are displayed in the table below:

Partial Autocorrelation Function
Time lag kPACF(k)T-STATP-value
10.96527810.03150
2-0.016412-0.17060.432444
3-0.056497-0.58710.27917
4-0.021686-0.22540.41106
5-0.064032-0.66540.253594
6-0.034185-0.35530.361543
7-0.026783-0.27830.390642
8-0.012415-0.1290.44879
90.0128340.13340.447072
100.0393440.40890.341721
110.0289190.30050.382175
120.0135460.14080.444157
130.0347220.36080.359462
140.0117780.12240.451403
15-0.005514-0.05730.477205
16-0.010647-0.11060.456051
17-0.009262-0.09630.461749
18-0.012243-0.12720.449496
19-0.004587-0.04770.481035
20-0.007657-0.07960.468361
21-0.006167-0.06410.474511
220.0138370.14380.442965
230.0013440.0140.494439
24-0.012955-0.13460.446577
25-0.002403-0.0250.490063
26-0.010181-0.10580.457967
27-0.013772-0.14310.443231
28-0.0057-0.05920.476436
29-0.026947-0.280.389991
30-0.008422-0.08750.465207
31-0.042109-0.43760.331273
32-0.0307-0.3190.375156
33-0.031336-0.32570.372658
34-0.028132-0.29240.385289
35-0.017414-0.1810.428365
36-0.013268-0.13790.445293
37-0.016283-0.16920.432973
38-0.015114-0.15710.437741
39-0.025718-0.26730.394884
40-0.013641-0.14180.443767
41-0.027391-0.28470.388225
42-0.028296-0.29410.384636
43-0.039221-0.40760.342189
44-0.032311-0.33580.368843
45-0.024418-0.25380.400082
46-0.008431-0.08760.465172
47-0.022055-0.22920.409572
48-0.028714-0.29840.382986


Parameters (Session):
par1 = 48 ; par2 = 1 ; par3 = 0 ; par4 = 0 ; par5 = 12 ; par6 = White Noise ; par7 = 0.95 ;
Parameters (R input):
par1 = 48 ; par2 = 1 ; par3 = 0 ; par4 = 0 ; par5 = 12 ; par6 = White Noise ; par7 = 0.95 ; par8 = ;
R code (references can be found in the software module):
if (par1 == 'Default') {
par1 = 10*log10(length(x))
} else {
par1 <- as.numeric(par1)
}
par2 <- as.numeric(par2)
par3 <- as.numeric(par3)
par4 <- as.numeric(par4)
par5 <- as.numeric(par5)
if (par6 == 'White Noise') par6 <- 'white' else par6 <- 'ma'
par7 <- as.numeric(par7)
if (par8 != '') par8 <- as.numeric(par8)
x <- na.omit(x)
ox <- x
if (par8 == '') {
if (par2 == 0) {
x <- log(x)
} else {
x <- (x ^ par2 - 1) / par2
}
} else {
x <- log(x,base=par8)
}
if (par3 > 0) x <- diff(x,lag=1,difference=par3)
if (par4 > 0) x <- diff(x,lag=par5,difference=par4)
bitmap(file='picts.png')
op <- par(mfrow=c(2,1))
plot(ox,type='l',main='Original Time Series',xlab='time',ylab='value')
if (par8=='') {
mytitle <- paste('Working Time Series (lambda=',par2,', d=',par3,', D=',par4,')',sep='')
mysub <- paste('(lambda=',par2,', d=',par3,', D=',par4,', CI=', par7, ', CI type=',par6,')',sep='')
} else {
mytitle <- paste('Working Time Series (base=',par8,', d=',par3,', D=',par4,')',sep='')
mysub <- paste('(base=',par8,', d=',par3,', D=',par4,', CI=', par7, ', CI type=',par6,')',sep='')
}
plot(x,type='l', main=mytitle,xlab='time',ylab='value')
par(op)
dev.off()
bitmap(file='pic1.png')
racf <- acf(x, par1, main='Autocorrelation', xlab='time lag', ylab='ACF', ci.type=par6, ci=par7, sub=mysub)
dev.off()
bitmap(file='pic2.png')
rpacf <- pacf(x,par1,main='Partial Autocorrelation',xlab='lags',ylab='PACF',sub=mysub)
dev.off()
(myacf <- c(racf$acf))
(mypacf <- c(rpacf$acf))
lengthx <- length(x)
sqrtn <- sqrt(lengthx)
load(file='createtable')
a<-table.start()
a<-table.row.start(a)
a<-table.element(a,'Autocorrelation Function',4,TRUE)
a<-table.row.end(a)
a<-table.row.start(a)
a<-table.element(a,'Time lag k',header=TRUE)
a<-table.element(a,hyperlink('basics.htm','ACF(k)','click here for more information about the Autocorrelation Function'),header=TRUE)
a<-table.element(a,'T-STAT',header=TRUE)
a<-table.element(a,'P-value',header=TRUE)
a<-table.row.end(a)
for (i in 2:(par1+1)) {
a<-table.row.start(a)
a<-table.element(a,i-1,header=TRUE)
a<-table.element(a,round(myacf[i],6))
mytstat <- myacf[i]*sqrtn
a<-table.element(a,round(mytstat,4))
a<-table.element(a,round(1-pt(abs(mytstat),lengthx),6))
a<-table.row.end(a)
}
a<-table.end(a)
table.save(a,file='mytable.tab')
a<-table.start()
a<-table.row.start(a)
a<-table.element(a,'Partial Autocorrelation Function',4,TRUE)
a<-table.row.end(a)
a<-table.row.start(a)
a<-table.element(a,'Time lag k',header=TRUE)
a<-table.element(a,hyperlink('basics.htm','PACF(k)','click here for more information about the Partial Autocorrelation Function'),header=TRUE)
a<-table.element(a,'T-STAT',header=TRUE)
a<-table.element(a,'P-value',header=TRUE)
a<-table.row.end(a)
for (i in 1:par1) {
a<-table.row.start(a)
a<-table.element(a,i,header=TRUE)
a<-table.element(a,round(mypacf[i],6))
mytstat <- mypacf[i]*sqrtn
a<-table.element(a,round(mytstat,4))
a<-table.element(a,round(1-pt(abs(mytstat),lengthx),6))
a<-table.row.end(a)
}
a<-table.end(a)
table.save(a,file='mytable1.tab')